Estimated zip code population in 2022: 4,427 Zip code population in 2010: 4,092 Zip code population in 2000: 3,921
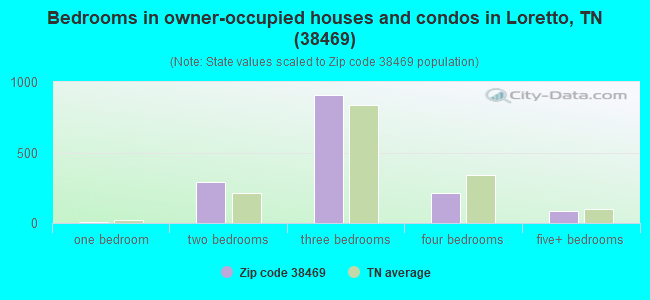
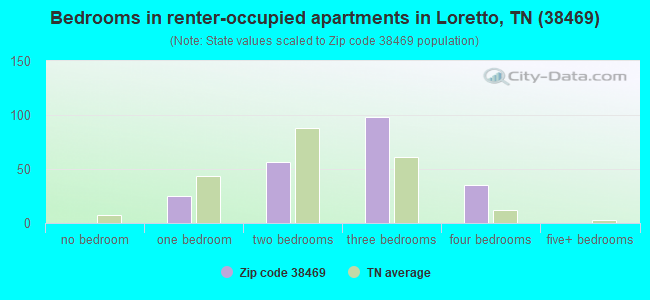
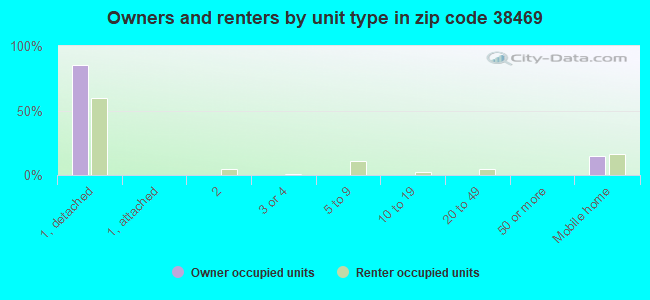
Houses and condos: 1,872 Renter-occupied apartments: 215
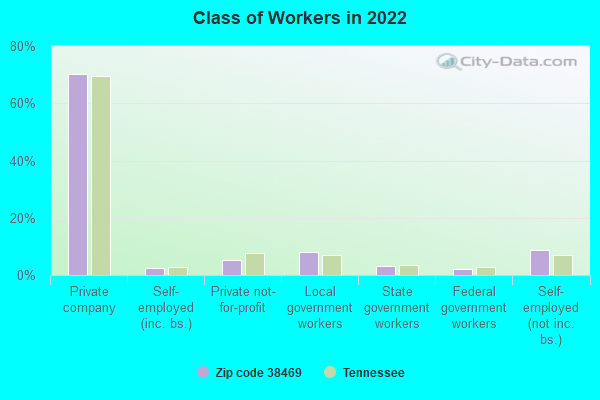
% of renters here:
12%
State:
33%
March 2022 cost of living index in zip code 38469: 78.4 (low, U.S. average is 100)
Land area: 67.7 sq. mi. Water area: 0.0 sq. mi.
Population density: 65 people per square mile
(very low).
OSM Map
General Map
Google Map
MSN Map
OSM Map
General Map
Google Map
MSN Map
OSM Map
General Map
Google Map
MSN Map
OSM Map
General Map
Google Map
MSN Map
Please wait while loading the map...
Real estate property taxes paid for housing units in 2022:
This zip code:
0.5% ($853)
Tennessee:
0.5% ($1,376)
Median real estate property taxes paid for housing units with mortgages in 2022: $881 (0.5%) Median real estate property taxes paid for housing units with no mortgage in 2022: $826 (0.6%)
Business Search- 14 Million verified businesses
Males: 2,129
(48.1%)
Females: 2,297
(51.9%)
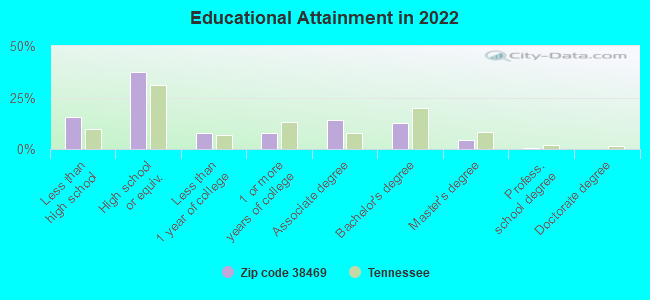
For population 25 years and over in 38469:
High school or higher: 82.9%
Bachelor's degree or higher: 17.5%
Graduate or professional degree: 5.0%
Unemployed: 4.1%
Mean travel time to work (commute): 27.0 minutes
For population 15 years and over in 38469:
Never married: 23.3%
Now married: 56.0%
Separated: 1.2%
Widowed: 8.2%
Divorced: 11.2%
Zip code 38469 compared to state average:
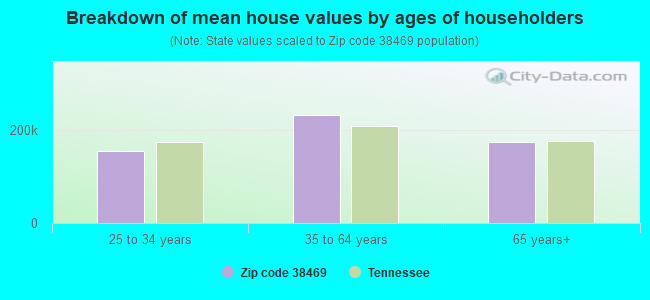
Median house value below state average.
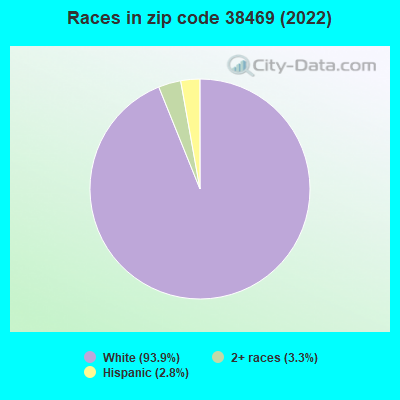
Black race population percentage significantly below state average.
Hispanic race population percentage below state average.
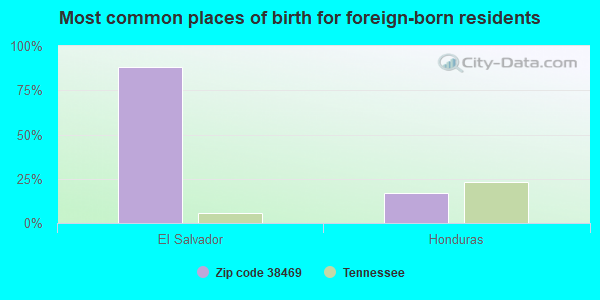
Foreign-born population percentage significantly below state average.
Renting percentage significantly below state average.
Length of stay since moving in significantly above state average.
Percentage of population with a bachelor's degree or higher below state average.
Estimated median house/condo value in 2022: $171,174
38469:
$171,174
Tennessee:
$284,800
According to our research of Tennessee and other state lists, there were 8 registered sex offenders living in 38469 zip code as of May 28, 2024. The ratio of all residents to sex offenders in zip code 38469 is 508 to 1. The ratio of registered sex offenders to all residents in this zip code is lower than the state average.
Median resident age:
This zip code:
42.7 years
Tennessee median age:
39.2 years
Average household size:
This zip code:
2.6 people
Tennessee:
2.4 people
Averages for the 2020 tax year for zip code 38469, filed in 2021:
Average Adjusted Gross Income (AGI) in 2020: $54,311 (Individual Income Tax Returns)
Here:
$54,311
State:
$69,014
Salary/wage: $46,913 (reported on 80.7% of returns)
Here:
$46,913
State:
$55,872
(% of AGI for various income ranges: 1238.2% for AGIs below $25k, 3371.8% for AGIs $25k-50k, 6525.0% for AGIs $50k-75k, 8496.2% for AGIs $75k-100k, 14584.3% for AGIs $100k-200k)
Taxable interest for individuals: $1,904 (reported on 27.3% of returns)
This zip code:
$1,904
Tennessee:
$1,945
(% of AGI for various income ranges: 21.1% for AGIs below $25k, 30.0% for AGIs $25k-50k, 80.5% for AGIs $50k-75k, 102.3% for AGIs $75k-100k, 177.1% for AGIs $100k-200k)
Ordinary dividends: $3,562 (reported on 9.1% of returns)
Here:
$3,562
State:
$8,105
(% of AGI for various income ranges: 6.1% for AGIs below $25k, 11.6% for AGIs $25k-50k, 15.5% for AGIs $50k-75k, 334.3% for AGIs $100k-200k)
Net capital gain/loss in AGI: +$20,053 (reported on 9.7% of returns)
Here:
+$20,053
State:
+$33,664
(% of AGI for various income ranges: 2.5% for AGIs below $25k, 27.9% for AGIs $25k-50k, 103.0% for AGIs $50k-75k, 418.6% for AGIs $100k-200k)
Profit/loss from business: +$22,103 (reported on 17.0% of returns)
Here:
+$22,103
State:
+$18,991
(% of AGI for various income ranges: 170.2% for AGIs below $25k, 209.7% for AGIs $25k-50k, 307.0% for AGIs $50k-75k, 321.5% for AGIs $75k-100k, 2895.0% for AGIs $100k-200k)
Taxable individual retirement arrangement distribution: $9,847 (reported on 8.5% of returns)
38469:
$9,847
Tennessee:
$20,036
(% of AGI for various income ranges: 48.4% for AGIs below $25k, 81.1% for AGIs $25k-50k, 245.5% for AGIs $50k-75k, 332.1% for AGIs $100k-200k)
Total itemized deductions: $32,400 (reported on 2.3% of returns)
Here:
$32,400
State:
$40,136
(% of AGI for various income ranges: 996.9% for AGIs $75k-100k)
Charity contributions: $18,333 (reported on 1.7% of returns)
Here:
$18,333
State:
$19,852
(% of AGI for various income ranges: 423.1% for AGIs $75k-100k)
Taxes paid: $4,750 (reported on 2.3% of returns)
38469:
$4,750
State:
$6,038
(% of AGI for various income ranges: 146.2% for AGIs $75k-100k)
Earned income credit: $2,645 (reported on 18.8% of returns)
Here:
$2,645
State:
$2,391
(% of AGI for various income ranges: 125.5% for AGIs below $25k, 84.5% for AGIs $25k-50k)
Percentage of individuals using paid preparers for their 2020 taxes: 95.5%
Here:
95%
State:
93%
(% for various income ranges: 95.0% for AGIs below $25k, 97.9% for AGIs $25k-50k, 96.4% for AGIs $50k-75k, 94.1% for AGIs $75k-100k, 90.5% for AGIs $100k-200k, 100.0% for AGIs over 200k)
Averages for the 2012 tax year for zip code 38469, filed in 2013:
Average Adjusted Gross Income (AGI) in 2012: $41,901 (Individual Income Tax Returns)
Here:
$41,901
State:
$53,767
Salary/wage: $37,243 (reported on 84.7% of returns)
Here:
$37,243
State:
$45,421
(% of AGI for various income ranges: 73.9% for AGIs below $25k, 78.3% for AGIs $25k-50k, 83.6% for AGIs $50k-75k, 80.0% for AGIs $75k-100k, 63.4% for AGIs $100k-200k)
Taxable interest for individuals: $1,236 (reported on 28.8% of returns)
This zip code:
$1,236
Tennessee:
$1,732
(% of AGI for various income ranges: 1.6% for AGIs below $25k, 0.7% for AGIs $25k-50k, 0.2% for AGIs $50k-75k, 1.4% for AGIs $75k-100k, 0.7% for AGIs $100k-200k)
Ordinary dividends: $2,638 (reported on 9.8% of returns)
Here:
$2,638
State:
$6,739
(% of AGI for various income ranges: 0.3% for AGIs below $25k, 0.4% for AGIs $25k-50k, 0.1% for AGIs $50k-75k, 0.6% for AGIs $75k-100k, 1.4% for AGIs $100k-200k)
Net capital gain/loss in AGI: +$2,114 (reported on 8.6% of returns)
Here:
+$2,114
State:
+$19,082
(% of AGI for various income ranges: 0.1% for AGIs below $25k, 0.4% for AGIs $25k-50k, 0.2% for AGIs $75k-100k, 1.1% for AGIs $100k-200k)
Profit/loss from business: +$13,241 (reported on 16.6% of returns)
Here:
+$13,241
State:
+$15,240
(% of AGI for various income ranges: 8.6% for AGIs below $25k, 3.9% for AGIs $25k-50k, 3.6% for AGIs $50k-75k, 4.3% for AGIs $75k-100k, 6.6% for AGIs $100k-200k)
Taxable individual retirement arrangement distribution: $6,287 (reported on 9.2% of returns)
38469:
$6,287
Tennessee:
$15,505
(% of AGI for various income ranges: 3.3% for AGIs below $25k, 1.9% for AGIs $25k-50k, 0.7% for AGIs $50k-75k, 2.2% for AGIs $75k-100k)
Total itemized deductions: $18,748 (22% of AGI, reported on 16.6% of returns)
Here:
$18,748
State:
$21,976
Here:
22.4% of AGI
State:
17.8% of AGI
(% of AGI for various income ranges: 3.8% for AGIs below $25k, 5.3% for AGIs $25k-50k, 8.1% for AGIs $50k-75k, 8.5% for AGIs $75k-100k, 9.9% for AGIs $100k-200k)
Charity contributions: $5,610 (reported on 12.9% of returns)
Here:
$5,610
State:
$6,709
(% of AGI for various income ranges: 1.3% for AGIs $25k-50k, 1.5% for AGIs $50k-75k, 1.8% for AGIs $75k-100k, 3.2% for AGIs $100k-200k)
Taxes paid: $3,293 (reported on 16.6% of returns)
38469:
$3,293
State:
$4,829
(% of AGI for various income ranges: 0.5% for AGIs below $25k, 0.7% for AGIs $25k-50k, 1.3% for AGIs $50k-75k, 1.5% for AGIs $75k-100k, 2.1% for AGIs $100k-200k)
Earned income credit: $2,223 (reported on 23.9% of returns)
Here:
$2,223
State:
$2,404
(% of AGI for various income ranges: 7.4% for AGIs below $25k, 1.1% for AGIs $25k-50k)
Percentage of individuals using paid preparers for their 2012 taxes: 69.3%
Here:
69%
State:
52%
(% for various income ranges: 62.2% for AGIs below $25k, 70.7% for AGIs $25k-50k, 79.2% for AGIs $50k-75k, 84.6% for AGIs $75k-100k, 72.7% for AGIs $100k-200k)
Averages for the 2004 tax year for zip code 38469, filed in 2005:
Average Adjusted Gross Income (AGI) in 2004: $34,228 (Individual Income Tax Returns)
Here:
$34,228
State:
$44,088
Salary/wage: $33,018 (reported on 85.7% of returns)
Here:
$33,018
State:
$38,825
(% of AGI for various income ranges: 93.0% for AGIs below $10k, 79.1% for AGIs $10k-25k, 85.3% for AGIs $25k-50k, 86.8% for AGIs $50k-75k, 82.7% for AGIs $75k-100k, 71.9% for AGIs over 100k)
Taxable interest for individuals: $1,365 (reported on 39.5% of returns)
This zip code:
$1,365
Tennessee:
$1,802
(% of AGI for various income ranges: 4.9% for AGIs below $10k, 3.7% for AGIs $10k-25k, 1.5% for AGIs $25k-50k, 0.8% for AGIs $50k-75k, 1.6% for AGIs $75k-100k, 0.5% for AGIs over 100k)
Taxable dividends: $2,215 (reported on 9.8% of returns)
Here:
$2,215
State:
$3,727
(% of AGI for various income ranges: 0.8% for AGIs below $10k, 0.5% for AGIs $10k-25k, 0.3% for AGIs $25k-50k, 0.2% for AGIs $50k-75k, 0.5% for AGIs $75k-100k, 2.3% for AGIs over 100k)
Net capital gain/loss: +$2,292 (reported on 7.0% of returns)
Here:
+$2,292
State:
+$15,776
(% of AGI for various income ranges: 1.0% for AGIs below $10k, 0.4% for AGIs $10k-25k, -0.0% for AGIs $25k-50k, 0.7% for AGIs $50k-75k, 0.3% for AGIs $75k-100k, 1.3% for AGIs over 100k)
Profit/loss from business: +$5,493 (reported on 18.5% of returns)
Here:
+$5,493
State:
+$12,882
(% of AGI for various income ranges: 9.1% for AGIs below $10k, 4.4% for AGIs $10k-25k, 3.4% for AGIs $25k-50k, 1.9% for AGIs $50k-75k, 2.9% for AGIs $75k-100k, 1.6% for AGIs over 100k)
IRA payment deduction: $3,516 (reported on 1.9% of returns)
38469:
$3,516
Tennessee:
$2,934
Total itemized deductions: $15,634 (24% of AGI, reported on 16.4% of returns)
Here:
$15,634
State:
$18,035
Here:
24.2% of AGI
State:
19.9% of AGI
(% of AGI for various income ranges: 5.5% for AGIs $10k-25k, 5.9% for AGIs $25k-50k, 9.1% for AGIs $50k-75k, 10.4% for AGIs $75k-100k, 8.4% for AGIs over 100k)
Charity contributions deductions: $4,089 (6% of AGI, reported on 14.6% of returns)
Here:
$4,089
State:
$5,167
Here:
6.1% of AGI
State:
5.3% of AGI
(% of AGI for various income ranges: 1.3% for AGIs $10k-25k, 0.9% for AGIs $25k-50k, 1.9% for AGIs $50k-75k, 2.9% for AGIs $75k-100k, 2.8% for AGIs over 100k)
Total tax: $4,080 (reported on 70.8% of returns)
38469:
$4,080
State:
$7,482
(% of AGI for various income ranges: 2.7% for AGIs below $10k, 3.8% for AGIs $10k-25k, 5.7% for AGIs $25k-50k, 8.0% for AGIs $50k-75k, 9.8% for AGIs $75k-100k, 18.9% for AGIs over 100k)
Earned income credit: $1,887 (reported on 20.3% of returns)
Here:
$1,887
State:
$1,826
Percentage of individuals using paid preparers for their 2004 taxes: 72.1%
Here:
72%
State:
60%
(% for various income ranges: 61.8% for AGIs below $10k, 72.7% for AGIs $10k-25k, 77.4% for AGIs $25k-50k, 72.4% for AGIs $50k-75k, 75.3% for AGIs $75k-100k, 76.9% for AGIs over 100k)
Household received Food Stamps/SNAP in the past 12 months: 200 Household did not receive Food Stamps/SNAP in the past 12 months: 1,529
Women who had a birth in the past 12 months: 82 (52 now married, 29 unmarried) Women who did not have a birth in the past 12 months: 935 (431 now married, 503 unmarried)
Housing units in zip code 38469 with a mortgage: 798 (106 second mortgage, 93 both second mortgage and home equity loan) Houses without a mortgage: 11
Median monthly owner costs for units with a mortgage: $995 Median monthly owner costs for units without a mortgage: $347
Residents with income below the poverty level in 2022:
This zip code:
14.1%
Whole state:
13.3%
Residents with income below 50% of the poverty level in 2022:
This zip code:
8.9%
Whole state:
7.1%
Median number of rooms in houses and condos:
Here:
6.1
State:
6.5
Median number of rooms in apartments:
Here:
5.2
State:
4.4
Notable locations in this zip code not listed on our city pages
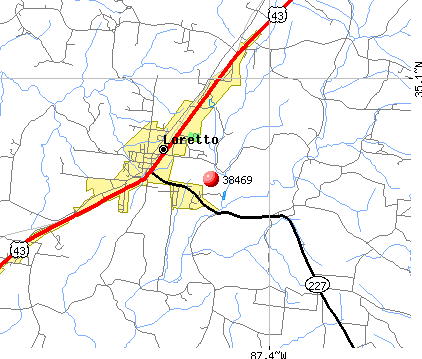
Notable locations in zip code 38469: Hill Poultry Farm (A), Loretto Volunteer Fire Department (B), Loretto City Hall (C). Display/hide their locations on the map
Churches in zip code 38469 include: Sacred Heart Catholic Church (A), Liberty Grove Church (B), Fairview First Congregational Methodist Church (C), Peppertown Church (D), Loretto United Methodist Church (E), Loretto Church of Christ (F), First Baptist Church (G), Bluewater Church (H), Daisy Chapel (I). Display/hide their locations on the map
Cemeteries: Saint Truitt Cemetery (1), Belew Cemetery (2), Restview Cemetery (3), Peppertown Cemetery (4), Loretto Cemetery (5), Liberty Grove Cemetery (6), Fairview Cemetery (7). Display/hide their locations on the map
Size of family households: 586 2-persons, 372 3-persons, 214 4-persons, 83 5-persons, 11 6-persons, 7 7-or-more-persons
Size of nonfamily households: 399 1-person, 50 2-persons, 3 3-persons
718 married couples with children.
221 single-parent households (50 men, 171 women).
99.2% of residents of 38469 zip code speak English at home.
0.5% of residents speak Spanish at home (100% very well).
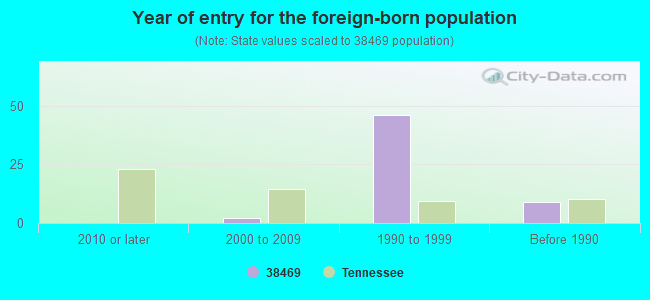
Foreign born population: 60 (1.4%) (20.4% of them are naturalized citizens)
This zip code:
1.4%
Whole state:
5.6%
88%El Salvador
17%Honduras
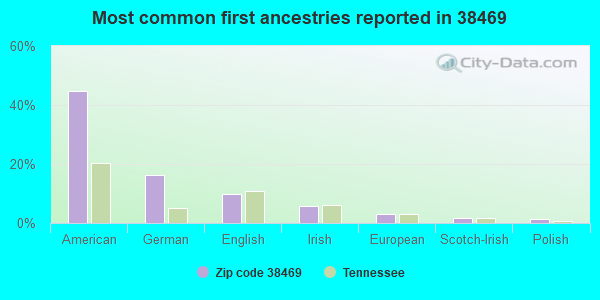
45%American
16%German
10%English
6%Irish
3%European
2%Scotch-Irish
2%Polish
Year of entry for the foreign-born population
02010 or later
22000 to 2009
461990 to 1999
9Before 1990
Facilities with environmental interests located in this zip code:
ENTERPRISE FABRICATORS INC (MILITARY ST in LORETTO, TN)
(Resource Conservation and Recovery Act (tracking hazardous waste)) Business NAICS classification: BURIAL CASKET MANUFACTURING.
Housing units lacking complete plumbing facilities: 2.4% Housing units lacking complete kitchen facilities: 1.5%
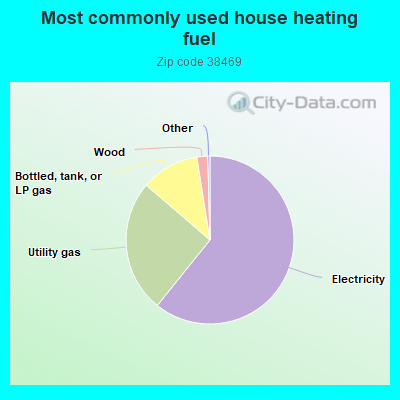
60.8%Electricity
25.5%Utility gas
11.2%Bottled, tank, or LP gas
2.1%Wood
Population in 1990: 3,369. Population change in the 1990s: +552 (+16.4%).
Place of birth for U.S.-born residents:
This state: 2,706
Northeast: 35
Midwest: 537
South: 889
West: 175
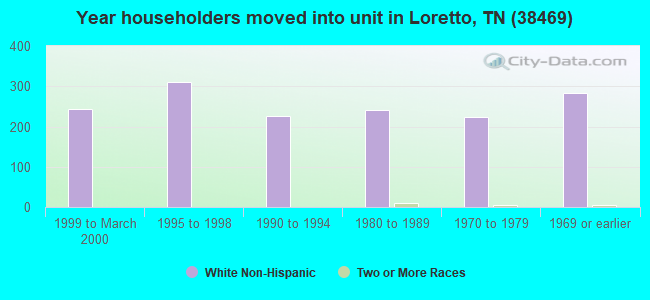
65% of the 38469 zip code residents lived in the same house 5 years ago. Out of people who lived in different houses, 74% lived in this county. Out of people who lived in different counties, 50% lived in Tennessee.
94% of the 38469 zip code residents lived in the same house 1 year ago. Out of people who lived in different houses, 87% moved from this county. Out of people who lived in different houses, 5% moved from different county within same state. Out of people who lived in different houses, 2% moved from different state. Out of people who lived in different houses, 5% moved from abroad.
Private vs. public school enrollment:
Students in private schools in grades 1 to 8 (elementary and middle school): 67
Here:
19.3%
Tennessee:
15.0%
Students in private schools in grades 9 to 12 (high school): 51
Here:
13.1%
Tennessee:
16.2%
Students in private undergraduate colleges: 13
Here:
11.0%
Tennessee:
23.5%
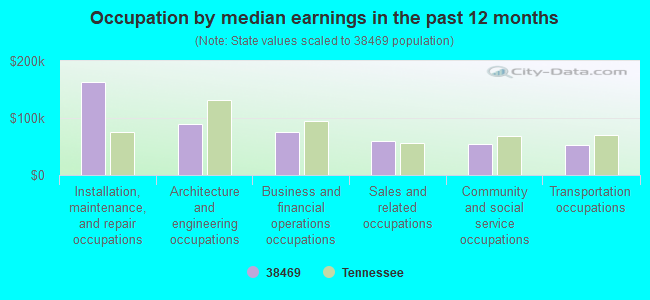
Occupation by median earnings in the past 12 months ($)
163,396Installation, maintenance, and repair occupations
89,867Architecture and engineering occupations
75,998Business and financial operations occupations
60,010Sales and related occupations
53,676Community and social service occupations
53,324Transportation occupations
Top industries in this zip code by the number of employees in 2005:
Finance and Insurance: Commercial Banking (10-19: 1, 5-9: 1)
Fatal accident statistics in 2014:
Fatal accident count: 2
Vehicles involved in fatal accidents: 4
Fatal accidents caused by drunken drivers: 2
Fatalities: 2
Persons involved in fatal accidents: 6
Pedestrians involved in fatal accidents: 0
Fatal accident statistics in 2012:
Fatal accident count: 1
Vehicles involved in fatal accidents: 1
Fatal accidents caused by drunken drivers: 0
Fatalities: 1
Persons involved in fatal accidents: 1
Pedestrians involved in fatal accidents: 0
2002 - 2018 National Fire Incident Reporting System (NFIRS) incidents
According to the data from the years 2002 - 2018 the average number of fire incidents per year is 28. The highest number of reported fire incidents - 53 took place in 2006, and the least - 2 in 2002. The data has a growing trend.
When looking into fire subcategories, the most reports belonged to: Outside Fires (48.3%), and Structure Fires (39.4%).
Fire incident types reported to NFIRS in Zip Code 38469

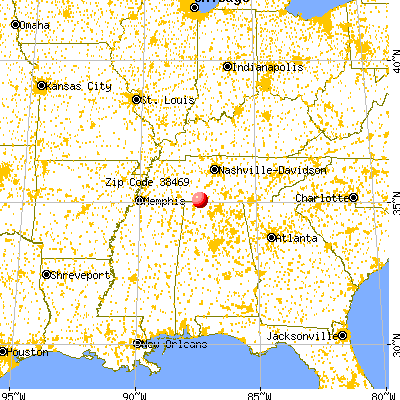


 Nearest zip codes: 38481, 35648, 38468, 38486, 38457, 35645.


 According to the data from the years 2002 - 2018 the average number of fire incidents per year is 28. The highest number of reported fire incidents - 53 took place in 2006, and the least - 2 in 2002. The data has a growing trend.
 When looking into fire subcategories, the most reports belonged to: Outside Fires (48.3%), and Structure Fires (39.4%).