Estimated zip code population in 2022: 6,857 Zip code population in 2010: 5,663 Zip code population in 2000: 4,595
Houses and condos: 2,651 Renter-occupied apartments: 595
% of renters here:
26%
State:
33%
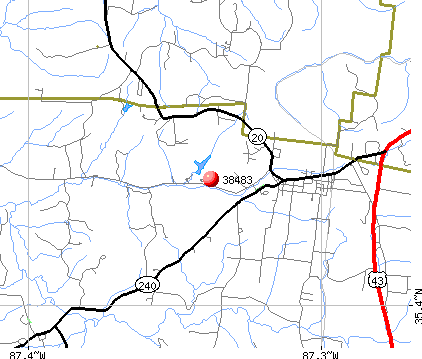
March 2022 cost of living index in zip code 38483: 79.1 (low, U.S. average is 100)
Land area: 97.6 sq. mi. Water area: 0.2 sq. mi.
Population density: 70 people per square mile
(very low).
OSM Map
General Map
Google Map
MSN Map
OSM Map
General Map
Google Map
MSN Map
OSM Map
General Map
Google Map
MSN Map
OSM Map
General Map
Google Map
MSN Map
Please wait while loading the map...
Real estate property taxes paid for housing units in 2022:
This zip code:
0.3% ($719)
Tennessee:
0.5% ($1,376)
Median real estate property taxes paid for housing units with mortgages in 2022: $614 (0.3%) Median real estate property taxes paid for housing units with no mortgage in 2022: $784 (0.3%)
Business Search- 14 Million verified businesses
Males: 3,423
(49.9%)
Females: 3,433
(50.1%)
For population 25 years and over in 38483:
High school or higher: 83.0%
Bachelor's degree or higher: 16.5%
Graduate or professional degree: 4.1%
Unemployed: 6.2%
Mean travel time to work (commute): 31.9 minutes
For population 15 years and over in 38483:
Never married: 24.2%
Now married: 58.1%
Separated: 0.3%
Widowed: 7.9%
Divorced: 9.4%
Zip code 38483 compared to state average:
Unemployed percentage above state average.
Black race population percentage significantly below state average.
Hispanic race population percentage below state average.
Median age below state average.
Foreign-born population percentage significantly below state average.
Length of stay since moving in above state average.
Percentage of population with a bachelor's degree or higher below state average.
Estimated median house/condo value in 2022: $206,268
38483:
$206,268
Tennessee:
$284,800
According to our research of Tennessee and other state lists, there were 11 registered sex offenders living in 38483 zip code as of May 28, 2024. The ratio of all residents to sex offenders in zip code 38483 is 519 to 1. The ratio of registered sex offenders to all residents in this zip code is lower than the state average.
Median resident age:
This zip code:
34.3 years
Tennessee median age:
39.2 years
Average household size:
This zip code:
3.0 people
Tennessee:
2.4 people
Averages for the 2020 tax year for zip code 38483, filed in 2021:
Average Adjusted Gross Income (AGI) in 2020: $49,462 (Individual Income Tax Returns)
Here:
$49,462
State:
$69,014
Salary/wage: $46,433 (reported on 82.5% of returns)
Here:
$46,433
State:
$55,872
(% of AGI for various income ranges: 1021.7% for AGIs below $25k, 3329.8% for AGIs $25k-50k, 6386.9% for AGIs $50k-75k, 9319.5% for AGIs $75k-100k, 14697.5% for AGIs $100k-200k)
Taxable interest for individuals: $562 (reported on 22.1% of returns)
This zip code:
$562
Tennessee:
$1,945
(% of AGI for various income ranges: 13.5% for AGIs below $25k, 17.6% for AGIs $25k-50k, 16.2% for AGIs $50k-75k, 8.6% for AGIs $75k-100k, 30.0% for AGIs $100k-200k)
Ordinary dividends: $1,461 (reported on 8.7% of returns)
Here:
$1,461
State:
$8,105
(% of AGI for various income ranges: 6.4% for AGIs below $25k, 18.6% for AGIs $25k-50k, 20.0% for AGIs $50k-75k, 9.5% for AGIs $75k-100k, 49.5% for AGIs $100k-200k)
Net capital gain/loss in AGI: +$8,857 (reported on 8.7% of returns)
Here:
+$8,857
State:
+$33,664
(% of AGI for various income ranges: 16.7% for AGIs below $25k, 44.1% for AGIs $25k-50k, 26.9% for AGIs $50k-75k, 81.4% for AGIs $75k-100k, 700.5% for AGIs $100k-200k)
Profit/loss from business: +$13,156 (reported on 19.0% of returns)
Here:
+$13,156
State:
+$18,991
(% of AGI for various income ranges: 212.9% for AGIs below $25k, 199.7% for AGIs $25k-50k, 429.1% for AGIs $50k-75k, 383.6% for AGIs $75k-100k, 867.0% for AGIs $100k-200k)
Taxable individual retirement arrangement distribution: $11,593 (reported on 5.7% of returns)
38483:
$11,593
Tennessee:
$20,036
(% of AGI for various income ranges: 33.9% for AGIs below $25k, 58.1% for AGIs $25k-50k, 75.0% for AGIs $50k-75k, 74.5% for AGIs $75k-100k, 382.0% for AGIs $100k-200k)
Total itemized deductions: $27,880 (reported on 1.9% of returns)
Here:
$27,880
State:
$40,136
(% of AGI for various income ranges: 110.0% for AGIs $25k-50k, 378.0% for AGIs $100k-200k)
Charity contributions: $7,325 (reported on 1.5% of returns)
Here:
$7,325
State:
$19,852
(% of AGI for various income ranges: 146.5% for AGIs $100k-200k)
Taxes paid: $4,180 (reported on 1.9% of returns)
38483:
$4,180
State:
$6,038
(% of AGI for various income ranges: 6.2% for AGIs below $25k, 83.0% for AGIs $100k-200k)
Earned income credit: $2,264 (reported on 19.0% of returns)
Here:
$2,264
State:
$2,391
(% of AGI for various income ranges: 98.1% for AGIs below $25k, 78.4% for AGIs $25k-50k)
Percentage of individuals using paid preparers for their 2020 taxes: 95.1%
Here:
95%
State:
93%
(% for various income ranges: 93.5% for AGIs below $25k, 95.7% for AGIs $25k-50k, 95.2% for AGIs $50k-75k, 96.3% for AGIs $75k-100k, 96.4% for AGIs $100k-200k, 100.0% for AGIs over 200k)
Averages for the 2012 tax year for zip code 38483, filed in 2013:
Average Adjusted Gross Income (AGI) in 2012: $38,160 (Individual Income Tax Returns)
Here:
$38,160
State:
$53,767
Salary/wage: $35,550 (reported on 84.8% of returns)
Here:
$35,550
State:
$45,421
(% of AGI for various income ranges: 71.0% for AGIs below $25k, 79.4% for AGIs $25k-50k, 82.1% for AGIs $50k-75k, 83.9% for AGIs $75k-100k, 75.8% for AGIs $100k-200k)
Taxable interest for individuals: $767 (reported on 21.1% of returns)
This zip code:
$767
Tennessee:
$1,732
(% of AGI for various income ranges: 0.7% for AGIs below $25k, 0.3% for AGIs $25k-50k, 0.6% for AGIs $50k-75k, 0.1% for AGIs $75k-100k, 0.3% for AGIs $100k-200k)
Ordinary dividends: $1,221 (reported on 6.9% of returns)
Here:
$1,221
State:
$6,739
(% of AGI for various income ranges: 0.3% for AGIs below $25k, 0.2% for AGIs $25k-50k, 0.2% for AGIs $50k-75k, 0.4% for AGIs $75k-100k)
Net capital gain/loss in AGI: +$5,057 (reported on 6.9% of returns)
Here:
+$5,057
State:
+$19,082
(% of AGI for various income ranges: 0.5% for AGIs $25k-50k, 0.8% for AGIs $50k-75k, 3.5% for AGIs $75k-100k)
Profit/loss from business: +$12,276 (reported on 18.1% of returns)
Here:
+$12,276
State:
+$15,240
(% of AGI for various income ranges: 11.3% for AGIs below $25k, 6.4% for AGIs $25k-50k, 3.8% for AGIs $50k-75k, 4.7% for AGIs $75k-100k, 4.3% for AGIs $100k-200k)
Taxable individual retirement arrangement distribution: $9,823 (reported on 6.4% of returns)
38483:
$9,823
Tennessee:
$15,505
(% of AGI for various income ranges: 1.3% for AGIs below $25k, 1.6% for AGIs $25k-50k, 1.4% for AGIs $50k-75k, 3.9% for AGIs $75k-100k)
Total itemized deductions: $17,956 (27% of AGI, reported on 12.3% of returns)
Here:
$17,956
State:
$21,976
Here:
26.8% of AGI
State:
17.8% of AGI
(% of AGI for various income ranges: 3.3% for AGIs below $25k, 5.7% for AGIs $25k-50k, 7.2% for AGIs $50k-75k, 5.0% for AGIs $75k-100k, 6.7% for AGIs $100k-200k)
Charity contributions: $4,029 (reported on 8.3% of returns)
Here:
$4,029
State:
$6,709
(% of AGI for various income ranges: 0.8% for AGIs $25k-50k, 0.9% for AGIs $50k-75k, 0.8% for AGIs $75k-100k, 1.8% for AGIs $100k-200k)
Taxes paid: $2,900 (reported on 12.3% of returns)
38483:
$2,900
State:
$4,829
(% of AGI for various income ranges: 0.4% for AGIs below $25k, 0.9% for AGIs $25k-50k, 1.0% for AGIs $50k-75k, 1.0% for AGIs $75k-100k, 1.3% for AGIs $100k-200k)
Earned income credit: $2,282 (reported on 27.0% of returns)
Here:
$2,282
State:
$2,404
(% of AGI for various income ranges: 8.1% for AGIs below $25k, 1.6% for AGIs $25k-50k)
Percentage of individuals using paid preparers for their 2012 taxes: 58.3%
Here:
58%
State:
52%
(% for various income ranges: 52.8% for AGIs below $25k, 62.7% for AGIs $25k-50k, 61.3% for AGIs $50k-75k, 60.0% for AGIs $75k-100k, 70.0% for AGIs $100k-200k)
Averages for the 2004 tax year for zip code 38483, filed in 2005:
Average Adjusted Gross Income (AGI) in 2004: $31,345 (Individual Income Tax Returns)
Here:
$31,345
State:
$44,088
Salary/wage: $31,104 (reported on 86.8% of returns)
Here:
$31,104
State:
$38,825
(% of AGI for various income ranges: 102.1% for AGIs below $10k, 80.2% for AGIs $10k-25k, 85.7% for AGIs $25k-50k, 90.2% for AGIs $50k-75k, 88.5% for AGIs $75k-100k, 75.1% for AGIs over 100k)
Taxable interest for individuals: $754 (reported on 28.6% of returns)
This zip code:
$754
Tennessee:
$1,802
(% of AGI for various income ranges: 1.8% for AGIs below $10k, 1.2% for AGIs $10k-25k, 0.6% for AGIs $25k-50k, 0.7% for AGIs $50k-75k, 0.3% for AGIs $75k-100k, 0.1% for AGIs over 100k)
Taxable dividends: $667 (reported on 7.8% of returns)
Here:
$667
State:
$3,727
(% of AGI for various income ranges: 0.8% for AGIs below $10k, 0.4% for AGIs $10k-25k, 0.2% for AGIs $25k-50k, 0.0% for AGIs $50k-75k, 0.1% for AGIs $75k-100k, 0.0% for AGIs over 100k)
Net capital gain/loss: +$6,329 (reported on 7.4% of returns)
Here:
+$6,329
State:
+$15,776
(% of AGI for various income ranges: 4.3% for AGIs below $10k, 0.5% for AGIs $10k-25k, 1.2% for AGIs $25k-50k, 0.5% for AGIs $50k-75k, 5.6% for AGIs $75k-100k)
Profit/loss from business: +$7,516 (reported on 18.9% of returns)
Here:
+$7,516
State:
+$12,882
(% of AGI for various income ranges: 16.3% for AGIs below $10k, 5.0% for AGIs $10k-25k, 4.5% for AGIs $25k-50k, 3.5% for AGIs $50k-75k, 6.1% for AGIs $75k-100k)
IRA payment deduction: $2,405 (reported on 2.2% of returns)
38483:
$2,405
Tennessee:
$2,934
Total itemized deductions: $14,327 (24% of AGI, reported on 13.5% of returns)
Here:
$14,327
State:
$18,035
Here:
24.5% of AGI
State:
19.9% of AGI
(% of AGI for various income ranges: 4.8% for AGIs $10k-25k, 5.0% for AGIs $25k-50k, 7.2% for AGIs $50k-75k, 7.4% for AGIs $75k-100k, 10.6% for AGIs over 100k)
Charity contributions deductions: $3,112 (5% of AGI, reported on 11.1% of returns)
Here:
$3,112
State:
$5,167
Here:
5.1% of AGI
State:
5.3% of AGI
(% of AGI for various income ranges: 0.6% for AGIs $10k-25k, 0.8% for AGIs $25k-50k, 1.1% for AGIs $50k-75k, 1.6% for AGIs $75k-100k, 3.0% for AGIs over 100k)
Total tax: $3,216 (reported on 71.3% of returns)
38483:
$3,216
State:
$7,482
(% of AGI for various income ranges: 4.1% for AGIs below $10k, 3.9% for AGIs $10k-25k, 5.6% for AGIs $25k-50k, 8.1% for AGIs $50k-75k, 10.7% for AGIs $75k-100k, 13.9% for AGIs over 100k)
Earned income credit: $1,651 (reported on 24.9% of returns)
Here:
$1,651
State:
$1,826
Percentage of individuals using paid preparers for their 2004 taxes: 64.8%
Here:
65%
State:
60%
(% for various income ranges: 56.9% for AGIs below $10k, 62.7% for AGIs $10k-25k, 71.3% for AGIs $25k-50k, 63.7% for AGIs $50k-75k, 70.4% for AGIs $75k-100k, 82.4% for AGIs over 100k)
Household received Food Stamps/SNAP in the past 12 months: 266 Household did not receive Food Stamps/SNAP in the past 12 months: 2,027
Women who had a birth in the past 12 months: 34 (28 now married, 6 unmarried) Women who did not have a birth in the past 12 months: 1,399 (791 now married, 608 unmarried)
Housing units in zip code 38483 with a mortgage: 847 (33 second mortgage, 33 both second mortgage and home equity loan) Houses without a mortgage: 22
Median monthly owner costs for units with a mortgage: $1,161 Median monthly owner costs for units without a mortgage: $406
Residents with income below the poverty level in 2022:
This zip code:
8.0%
Whole state:
13.3%
Residents with income below 50% of the poverty level in 2022:
This zip code:
5.6%
Whole state:
7.1%
Median number of rooms in houses and condos:
Here:
6.3
State:
6.5
Median number of rooms in apartments:
Here:
3.9
State:
4.4
Notable locations in this zip code not listed on our city pages
Notable locations in zip code 38483: Henryville Volunteer Fire Department (A), Summertown Volunteer Fire Department (B). Display/hide their locations on the map
Churches in zip code 38483 include: Barnesville Baptist Church (A), Porter Chapel (B), Summertown Baptist Church (C), Pleasant Garden Church (D), Baugus Chapel (E), Hinestown Church (F), Chapel Grove Church (G), Tabernacle Church (H), Summertown Nazarene Church (I). Display/hide their locations on the map
Cemeteries: Summertown Cemetery (1), Workman Cemetery (2), Williams Cemetery (3), Brace Cemetery (4), Shrader Cemetery (5), Pleasant Garden Cemetery (6), Old Henryville Cemetery (7). Display/hide their locations on the map
1,634 married couples with children.
115 single-parent households (47 men, 68 women).
92.2% of residents of 38483 zip code speak English at home.
0.5% of residents speak Spanish at home (81% very well, 19% well).
8.3% of residents speak other Indo-European language at home (60% very well, 6% well, 6% not well, 28% not at all).
0.2% of residents speak other language at home (100% very well).
Foreign born population: 77 (1.1%) (61.8% of them are naturalized citizens)
This zip code:
1.1%
Whole state:
5.6%
32%Haiti
26%Dominica
22%Honduras
21%Algeria
13%Bolivia
6%Croatia
49%American
17%German
14%English
8%Irish
1%European
1%French
0%British
Year of entry for the foreign-born population
182010 or later
412000 to 2009
61990 to 1999
31Before 1990
Facilities with environmental interests located in this zip code:
BOOK PUBLISHING COMPANY, THE (156 DRAKES LANE, in SUMMERTOWN, TN)
(Resource Conservation and Recovery Act (tracking hazardous waste))
FOUNDATION (THE FARM), THE (156 DRAKES LANE in SUMMERTOWN, TN)
(Resource Conservation and Recovery Act (tracking hazardous waste))
Housing units lacking complete plumbing facilities: 9.1% Housing units lacking complete kitchen facilities: 9.5%
66.1%Electricity
13.3%Bottled, tank, or LP gas
11.2%Utility gas
9.1%Wood
Population in 1990: 3,302. Population change in the 1990s: +1,293 (+39.2%).
Place of birth for U.S.-born residents:
This state: 4,881
Northeast: 123
Midwest: 830
South: 753
West: 98
58% of the 38483 zip code residents lived in the same house 5 years ago. Out of people who lived in different houses, 47% lived in this county. Out of people who lived in different counties, 50% lived in Tennessee.
91% of the 38483 zip code residents lived in the same house 1 year ago. Out of people who lived in different houses, 13% moved from this county. Out of people who lived in different houses, 84% moved from different county within same state. Out of people who lived in different houses, 5% moved from different state. Out of people who lived in different houses, 5% moved from abroad.
Private vs. public school enrollment:
Students in private schools in grades 1 to 8 (elementary and middle school): 322
Here:
29.1%
Tennessee:
15.0%
Students in private schools in grades 9 to 12 (high school): 46
Here:
7.1%
Tennessee:
16.2%
Students in private undergraduate colleges: 34
Here:
25.7%
Tennessee:
23.5%
Occupation by median earnings in the past 12 months ($)
88,891Health technologists and technicians
53,771Health diagnosing and treating practitioners and other technical occupations
52,094Production occupations
48,267Management occupations
48,197Business and financial operations occupations
44,281Installation, maintenance, and repair occupations
Top industries in this zip code by the number of employees in 2005:
Other Services (except Public Administration): Religious Organizations (5-9 employees: 2 establishments, 1-4 employees: 2 establishments)
Construction: Painting and Wall Covering Contractors (10-19: 1)
Information: Book Publishers (10-19: 1)
Construction: Plumbing, Heating, and Air-Conditioning Contractors (5-9: 1, 1-4: 1)
Arts, Entertainment, and Recreation: Golf Courses and Country Clubs (5-9: 1)
Health Care and Social Assistance: Emergency and Other Relief Services (5-9: 1)
People in group quarters in 2010:
18 people in group homes intended for adults
Fatal accident statistics in 2014:
Fatal accident count: 1
Vehicles involved in fatal accidents: 1
Fatal accidents caused by drunken drivers: 0
Fatalities: 1
Persons involved in fatal accidents: 1
Pedestrians involved in fatal accidents: 0
Fatal accident statistics in 2012:
Fatal accident count: 4
Vehicles involved in fatal accidents: 4
Fatal accidents caused by drunken drivers: 1
Fatalities: 4
Persons involved in fatal accidents: 11
Pedestrians involved in fatal accidents: 0
2002 - 2018 National Fire Incident Reporting System (NFIRS) incidents
According to the data from the years 2002 - 2018 the average number of fire incidents per year is 38. The highest number of reported fires - 71 took place in 2007, and the least - 10 in 2002. The data has an increasing trend.
When looking into fire subcategories, the most incidents belonged to: Structure Fires (43.9%), and Outside Fires (42.2%).
Fire incident types reported to NFIRS in Zip Code 38483


 Nearest zip codes: 38456, 38474, 38461, 38464, 38462, 38454.


 According to the data from the years 2002 - 2018 the average number of fire incidents per year is 38. The highest number of reported fires - 71 took place in 2007, and the least - 10 in 2002. The data has an increasing trend.
 When looking into fire subcategories, the most incidents belonged to: Structure Fires (43.9%), and Outside Fires (42.2%).