Estimated zip code population in 2022: 600 Zip code population in 2010: 901 Zip code population in 2000: 822
March 2022 cost of living index in zip code 38504: 78.1 (low, U.S. average is 100)
Land area: 47.7 sq. mi. Water area: 0.0 sq. mi.
Population density: 13 people per square mile
(very low).
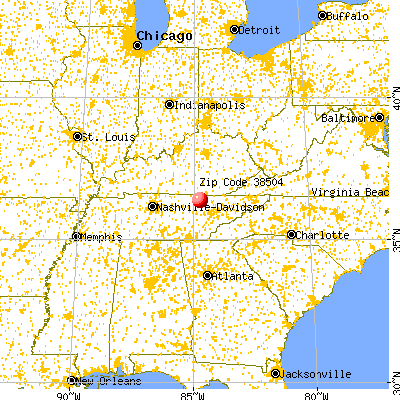
OSM Map
General Map
Google Map
MSN Map
OSM Map
General Map
Google Map
MSN Map
OSM Map
General Map
Google Map
MSN Map
OSM Map
General Map
Google Map
MSN Map
Please wait while loading the map...
Real estate property taxes paid for housing units in 2022:
This zip code:
0.3% ($351)
Tennessee:
0.5% ($1,376)
Median real estate property taxes paid for housing units with mortgages in 2022: $488 (0.3%) Median real estate property taxes paid for housing units with no mortgage in 2022: $201 (0.1%)
Business Search- 14 Million verified businesses
Males: 402
(66.9%)
Females: 198
(33.1%)
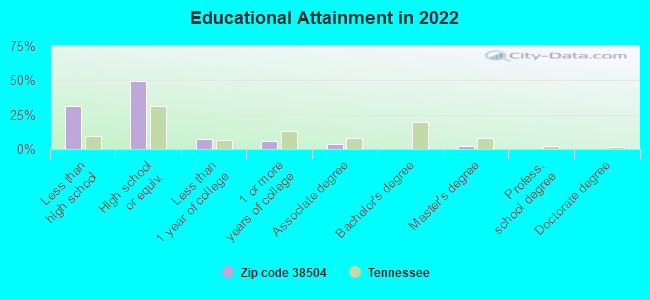
For population 25 years and over in 38504:
High school or higher: 64.7%
Bachelor's degree or higher: 2.1%
Graduate or professional degree: 2.1%
Mean travel time to work (commute): 33.8 minutes
For population 15 years and over in 38504:
Never married: 11.5%
Now married: 60.8%
Separated: 0.0%
Widowed: 0.0%
Divorced: 27.7%
Zip code 38504 compared to state average:
Median house value significantly below state average.
Unemployed percentage significantly below state average.
Black race population percentage significantly below state average.
Hispanic race population percentage significantly below state average.
Median age significantly above state average.
Foreign-born population percentage significantly below state average.
Renting percentage significantly below state average.
Length of stay since moving in significantly above state average.
House age below state average.
Number of college students significantly below state average.
Percentage of population with a bachelor's degree or higher significantly below state average.
Averages for the 2020 tax year for zip code 38504, filed in 2021:
Average Adjusted Gross Income (AGI) in 2020: $49,524 (Individual Income Tax Returns)
Here:
$49,524
State:
$69,014
Salary/wage: $43,721 (reported on 70.9% of returns)
Here:
$43,721
State:
$55,872
(% of AGI for various income ranges: 1100.0% for AGIs below $25k, 3423.1% for AGIs $25k-50k, 5476.0% for AGIs $50k-75k, 9763.3% for AGIs $75k-100k, 13210.0% for AGIs $100k-200k)
Taxable interest for individuals: $863 (reported on 34.5% of returns)
This zip code:
$863
Tennessee:
$1,945
(% of AGI for various income ranges: 30.7% for AGIs below $25k, 33.8% for AGIs $25k-50k, 36.0% for AGIs $50k-75k, 60.0% for AGIs $75k-100k, 95.0% for AGIs $100k-200k)
Ordinary dividends: $2,757 (reported on 12.7% of returns)
Here:
$2,757
State:
$8,105
(% of AGI for various income ranges: 60.7% for AGIs below $25k, 340.0% for AGIs $75k-100k)
Net capital gain/loss in AGI: +$15,357 (reported on 12.7% of returns)
Here:
+$15,357
State:
+$33,664
(% of AGI for various income ranges: 97.7% for AGIs $25k-50k, 2407.5% for AGIs $100k-200k)
Profit/loss from business: +$9,500 (reported on 27.3% of returns)
Here:
+$9,500
State:
+$18,991
(% of AGI for various income ranges: 230.0% for AGIs below $25k, 360.8% for AGIs $25k-50k, 2036.7% for AGIs $75k-100k)
Taxable individual retirement arrangement distribution: $20,050 (reported on 7.3% of returns)
38504:
$20,050
Tennessee:
$20,036
(% of AGI for various income ranges: 139.3% for AGIs below $25k, 1186.0% for AGIs $50k-75k)
Earned income credit: $2,430 (reported on 18.2% of returns)
Here:
$2,430
State:
$2,391
(% of AGI for various income ranges: 110.0% for AGIs below $25k, 60.0% for AGIs $25k-50k)
Percentage of individuals using paid preparers for their 2020 taxes: 94.5%
Here:
95%
State:
93%
(% for various income ranges: 90.0% for AGIs below $25k, 93.8% for AGIs $25k-50k, 100.0% for AGIs $50k-75k, 100.0% for AGIs $75k-100k, 100.0% for AGIs $100k-200k)
Averages for the 2012 tax year for zip code 38504, filed in 2013:
Average Adjusted Gross Income (AGI) in 2012: $37,635 (Individual Income Tax Returns)
Here:
$37,635
State:
$53,767
Salary/wage: $33,281 (reported on 77.8% of returns)
Here:
$33,281
State:
$45,421
(% of AGI for various income ranges: 64.3% for AGIs below $25k, 84.9% for AGIs $25k-50k, 75.6% for AGIs $50k-75k, 65.2% for AGIs $75k-100k, 52.4% for AGIs $100k-200k)
Taxable interest for individuals: $1,195 (reported on 37.0% of returns)
This zip code:
$1,195
Tennessee:
$1,732
(% of AGI for various income ranges: 1.7% for AGIs below $25k, 1.2% for AGIs $25k-50k, 0.5% for AGIs $50k-75k, 1.9% for AGIs $100k-200k)
Ordinary dividends: $1,262 (reported on 14.8% of returns)
Here:
$1,262
State:
$6,739
(% of AGI for various income ranges: 0.7% for AGIs below $25k, 0.7% for AGIs $25k-50k, 1.9% for AGIs $75k-100k)
Net capital gain/loss in AGI: +$280 (reported on 9.3% of returns)
Here:
+$280
State:
+$19,082
Profit/loss from business: +$6,377 (reported on 24.1% of returns)
Here:
+$6,377
State:
+$15,240
(% of AGI for various income ranges: 12.9% for AGIs below $25k, 3.3% for AGIs $25k-50k, 10.0% for AGIs $75k-100k)
Taxable individual retirement arrangement distribution: $16,600 (reported on 11.1% of returns)
38504:
$16,600
Tennessee:
$15,505
Total itemized deductions: $18,600 (26% of AGI, reported on 16.7% of returns)
Here:
$18,600
State:
$21,976
Here:
26.2% of AGI
State:
17.8% of AGI
(% of AGI for various income ranges: 16.8% for AGIs below $25k, 11.9% for AGIs $50k-75k, 11.4% for AGIs $100k-200k)
Charity contributions: $4,233 (reported on 11.1% of returns)
Here:
$4,233
State:
$6,709
Taxes paid: $3,056 (reported on 16.7% of returns)
38504:
$3,056
State:
$4,829
(% of AGI for various income ranges: 1.9% for AGIs below $25k, 2.5% for AGIs $50k-75k, 2.0% for AGIs $100k-200k)
Earned income credit: $2,293 (reported on 25.9% of returns)
Here:
$2,293
State:
$2,404
(% of AGI for various income ranges: 7.0% for AGIs below $25k, 1.7% for AGIs $25k-50k)
Percentage of individuals using paid preparers for their 2012 taxes: 66.7%
Here:
67%
State:
52%
(% for various income ranges: 61.5% for AGIs below $25k, 71.4% for AGIs $25k-50k, 71.4% for AGIs $50k-75k, 66.7% for AGIs $75k-100k, 75.0% for AGIs $100k-200k)
Averages for the 2004 tax year for zip code 38504, filed in 2005:
Average Adjusted Gross Income (AGI) in 2004: $28,118 (Individual Income Tax Returns)
Here:
$28,118
State:
$44,088
Salary/wage: $26,172 (reported on 82.1% of returns)
Here:
$26,172
State:
$38,825
(% of AGI for various income ranges: 74.8% for AGIs below $10k, 72.8% for AGIs $10k-25k, 81.6% for AGIs $25k-50k, 82.5% for AGIs $50k-75k, 76.8% for AGIs $75k-100k, 63.3% for AGIs over 100k)
Taxable interest for individuals: $1,519 (reported on 38.6% of returns)
This zip code:
$1,519
Tennessee:
$1,802
(% of AGI for various income ranges: 7.6% for AGIs below $10k, 2.7% for AGIs $10k-25k, 1.0% for AGIs $25k-50k, 3.6% for AGIs $50k-75k, 1.4% for AGIs $75k-100k, 0.5% for AGIs over 100k)
Taxable dividends: $1,841 (reported on 13.6% of returns)
Here:
$1,841
State:
$3,727
(% of AGI for various income ranges: 2.3% for AGIs below $10k, 0.6% for AGIs $10k-25k, 0.8% for AGIs $25k-50k, 0.4% for AGIs $50k-75k, 3.6% for AGIs $75k-100k)
Net capital gain/loss: +$2,174 (reported on 11.4% of returns)
Here:
+$2,174
State:
+$15,776
(% of AGI for various income ranges: -1.7% for AGIs below $10k, 0.7% for AGIs $10k-25k, 1.9% for AGIs $25k-50k, 2.4% for AGIs $75k-100k)
Profit/loss from business: +$6,353 (reported on 22.6% of returns)
Here:
+$6,353
State:
+$12,882
(% of AGI for various income ranges: 13.9% for AGIs below $10k, 11.8% for AGIs $10k-25k, 4.9% for AGIs $25k-50k, 4.9% for AGIs $75k-100k)
IRA payment deduction: $2,833 (reported on 2.0% of returns)
38504:
$2,833
Tennessee:
$2,934
Total itemized deductions: $16,242 (25% of AGI, reported on 10.9% of returns)
Here:
$16,242
State:
$18,035
Here:
24.7% of AGI
State:
19.9% of AGI
(% of AGI for various income ranges: 16.4% for AGIs below $10k, 5.3% for AGIs $25k-50k, 9.6% for AGIs $50k-75k, 15.6% for AGIs over 100k)
Charity contributions deductions: $3,347 (5% of AGI, reported on 8.1% of returns)
Here:
$3,347
State:
$5,167
Here:
4.8% of AGI
State:
5.3% of AGI
Total tax: $3,063 (reported on 68.7% of returns)
38504:
$3,063
State:
$7,482
(% of AGI for various income ranges: 4.6% for AGIs below $10k, 4.3% for AGIs $10k-25k, 5.3% for AGIs $25k-50k, 8.1% for AGIs $50k-75k, 10.1% for AGIs $75k-100k, 15.1% for AGIs over 100k)
Earned income credit: $1,941 (reported on 31.2% of returns)
Here:
$1,941
State:
$1,826
Percentage of individuals using paid preparers for their 2004 taxes: 76.0%
Here:
76%
State:
60%
(% for various income ranges: 71.8% for AGIs below $10k, 76.3% for AGIs $10k-25k, 77.8% for AGIs $25k-50k, 76.4% for AGIs $50k-75k, 78.9% for AGIs $75k-100k, 84.2% for AGIs over 100k)
Household received Food Stamps/SNAP in the past 12 months: 25 Household did not receive Food Stamps/SNAP in the past 12 months: 239
Women who did not have a birth in the past 12 months: 57 (24 now married, 33 unmarried)
Housing units in zip code 38504 with a mortgage: 96 Median monthly owner costs for units with a mortgage: $940 Median monthly owner costs for units without a mortgage: $245
Residents with income below the poverty level in 2022:
This zip code:
18.0%
Whole state:
13.3%
Median number of rooms in houses and condos:
Here:
6.0
State:
6.5
Notable locations in this zip code not listed on our city pages
Notable locations in zip code 38504: Royal Blue (A), Honey Creek Overlook (B), Fentress County Volunteer Fire Department Station 4 Armathwaite (C), Fentress County Volunteer Fire Department Station 12 Honey Creek / Mount Helen (D). Display/hide their locations on the map
Churches in zip code 38504 include: Fellowship Church (A), Shirley United Baptist Church (B), Honey Creek Church (C), Center Belle Church (D), Mount Helen Church (E). Display/hide their locations on the map
Streams, rivers, and creeks: Bear Branch (A), Joe Branch (B), Indian Creek (C), Honey Creek (D), Skull Cave Creek (E), Cave Branch (F), Caney Branch (G), Campbell Branch (H), Camp Branch (I). Display/hide their locations on the map
Year house built (houses)
02020 or later
812010 to 2019
812000 to 2009
1751990 to 1999
1181980 to 1989
101970 to 1979
431960 to 1969
101950 to 1959
01940 to 1949
01939 or earlier
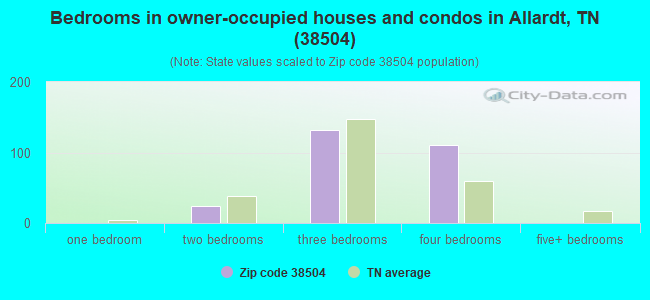
Bedrooms in owner-occupied houses and condos in Allardt, TN (38504)
0no bedroom
01 bedroom
242 bedrooms
1323 bedrooms
1104 bedrooms
05+ bedrooms
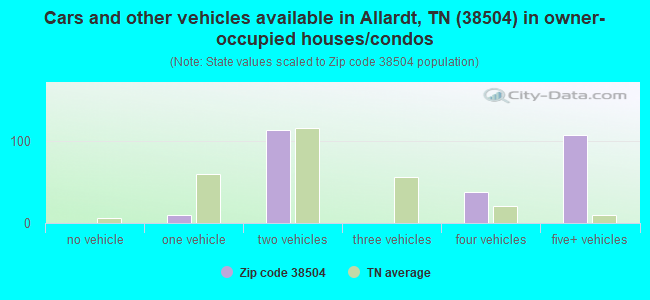
Cars and other vehicles available in Allardt, TN (38504) in owner-occupied houses/condos
0no vehicle
101 vehicle
1132 vehicles
03 vehicles
384 vehicles
1075+ vehicles
Zip code 38504 household income distribution in 2022
39Less than $10,000
22$15,000 to $19,999
8$25,000 to $29,999
14$40,000 to $44,999
18$45,000 to $49,999
38$60,000 to $74,999
89$75,000 to $99,999
9$100,000 to $124,999
23$150,000 to $199,999
Estimate of home value of owner-occupied houses/condos in 2022 in zip code 38504
38$35,000 to $39,999
52$40,000 to $49,999
10$50,000 to $59,999
16$100,000 to $124,999
21$150,000 to $174,999
7$175,000 to $199,999
33$250,000 to $299,999
23$300,000 to $399,999
33$750,000 to $999,999
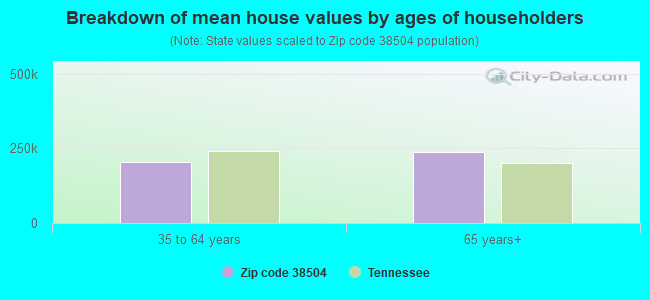
Estimated median house (or condo) value in 2022 for:
White Non-Hispanic householders: $210,546
Mean price in 2022:
Detached houses: $449,015
Here:
$449,015
State:
$374,382
Mobile homes: $65,693
Here:
$65,693
State:
$101,421
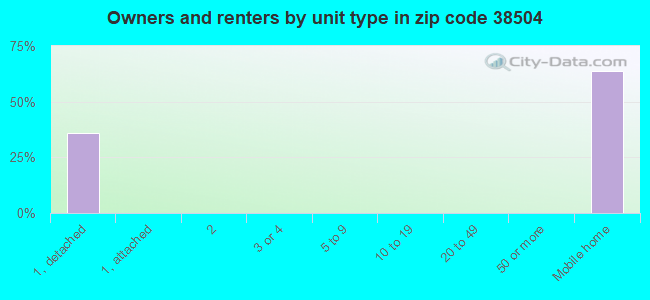
Housing units in structures:
One, detached: 331
Mobile homes: 192
Means of transportation to work in zip code 38504
83.8%263Drove a car alone
11.8%37Carpooled
Travel time to work (commute) in zip code 38504
245 to 9 minutes
3310 to 14 minutes
2120 to 24 minutes
10030 to 34 minutes
1135 to 39 minutes
7345 to 59 minutes
3860 to 89 minutes
Percentage of zip code residents living and working in this county: 69.6%
Household type by relationship:
Households: 600
Male householders: 148 (15 living alone), Female householders: 116 (10 living alone)
Size of family households: 103 2-persons, 45 3-persons, 11 4-persons
Size of nonfamily households: 24 1-person, 82 2-persons
29 married couples with children.
0 single-parent households ().
99.8% of residents of 38504 zip code speak English at home.
Foreign born population: 0 (0.0%)
:
0.0%
Whole state:
5.6%
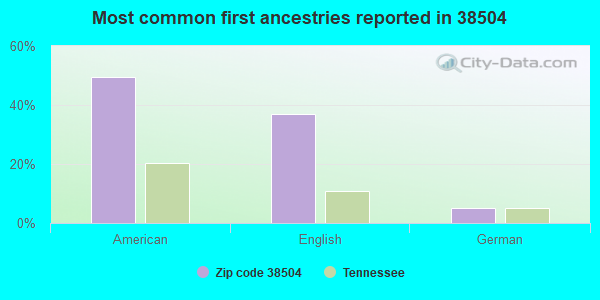
50%American
37%English
5%German
Facilities with environmental interests located in this zip code:
ALLARDT ELEMENTARY SCHOOL (BOX 129 in ALLARDT, TN)
(Geographic Names Information System) (National Center for Education Statistics) - STATE ID-0005 Organizations: FENTRESS COUNTY SCHOOL DISTRCT (SCHOOL DISTRICT)
Housing units lacking complete plumbing facilities: 5.7% Housing units lacking complete kitchen facilities: 5.7%
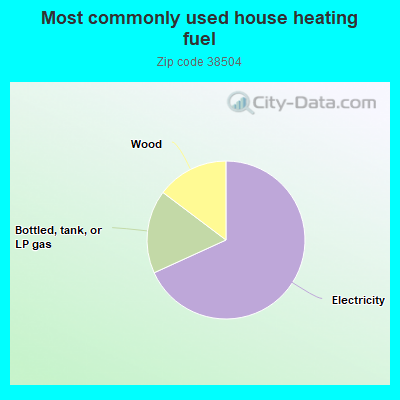
68.6%Electricity
17.2%Bottled, tank, or LP gas
14.8%Wood
Population in 1990: 3,284.
Place of birth for U.S.-born residents:
This state: 487
Northeast: 41
Midwest: 21
South: 35
West: 10
72% of the 38504 zip code residents lived in the same house 5 years ago. Out of people who lived in different houses, 85% lived in this county. Out of people who lived in different counties, 50% lived in Tennessee.
101% of the 38504 zip code residents lived in the same house 1 year ago.
Private vs. public school enrollment:
Students in private schools in grades 1 to 8 (elementary and middle school):
Here:
0.0%
Tennessee:
15.0%
Students in private schools in grades 9 to 12 (high school): 29
Here:
100.0%
Tennessee:
16.2%
Top industries in this zip code by the number of employees in 2005:
Accommodation and Food Services: Hotels (except Casino Hotels) and Motels (10-19 employees: 1 establishment)
Real Estate and Rental and Leasing: Residential Property Managers (10-19: 1)
Construction: Water and Sewer Line and Related Structures Construction (5-9: 1)
Real Estate and Rental and Leasing: Lessors of Other Real Estate Property (1-4: 2)
Other Services (except Public Administration): Religious Organizations (1-4: 2)
Real Estate and Rental and Leasing: Offices of Real Estate Appraisers (1-4: 1)
Administrative and Support and Waste Management and Remediation Services: Exterminating and Pest Control Services (1-4: 1)
Fatal accident statistics in 2013:
Fatal accident count: 1
Vehicles involved in fatal accidents: 1
Fatal accidents caused by drunken drivers: 1
Fatalities: 1
Persons involved in fatal accidents: 3
Pedestrians involved in fatal accidents: 0
Fatal accident statistics in 2011:
Fatal accident count: 1
Vehicles involved in fatal accidents: 1
Fatal accidents caused by drunken drivers: 1
Fatalities: 1
Persons involved in fatal accidents: 1
Pedestrians involved in fatal accidents: 0
2003 - 2018 National Fire Incident Reporting System (NFIRS) incidents
Based on the data from the years 2003 - 2018 the average number of fires per year is 20. The highest number of fires - 48 took place in 2008, and the least - 3 in 2015. The data has an increasing trend.
When looking into fire subcategories, the most incidents belonged to: Structure Fires (34.5%), and Outside Fires (34.2%).
Fire incident types reported to NFIRS in Zip Code 38504


 Nearest zip codes: 37733, 37732, 37872, 37852, 38556, 37841.
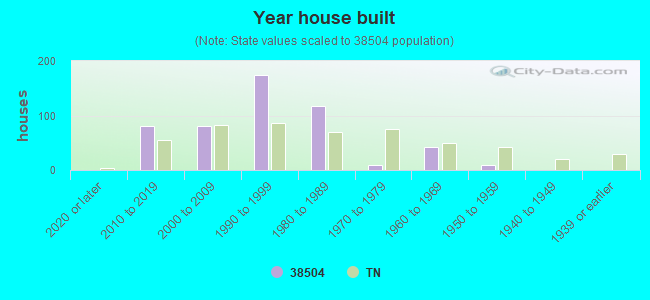


 Based on the data from the years 2003 - 2018 the average number of fires per year is 20. The highest number of fires - 48 took place in 2008, and the least - 3 in 2015. The data has an increasing trend.
 When looking into fire subcategories, the most incidents belonged to: Structure Fires (34.5%), and Outside Fires (34.2%).