Estimated median house/condo value in 2022: $126,879
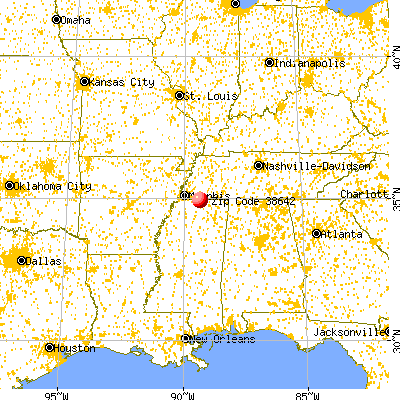
38642:
$126,879
Mississippi:
$162,500
According to our research of Mississippi and other state lists, there were 2 registered sex offenders living in 38642 zip code as of May 28, 2024. The ratio of all residents to sex offenders in zip code 38642 is 1,247 to 1. The ratio of registered sex offenders to all residents in this zip code is much lower than the state average.
Median resident age:
This zip code:
36.9 years
Mississippi median age:
38.9 years
Average household size:
This zip code:
2.6 people
Mississippi:
2.5 people
Averages for the 2020 tax year for zip code 38642, filed in 2021:
Average Adjusted Gross Income (AGI) in 2020: $44,400 (Individual Income Tax Returns)
Here:
$44,400
State:
$54,084
Salary/wage: $39,442 (reported on 86.1% of returns)
Here:
$39,442
State:
$45,187
(% of AGI for various income ranges: 1421.8% for AGIs below $25k, 4322.9% for AGIs $25k-50k, 6567.3% for AGIs $50k-75k, 10007.5% for AGIs $75k-100k, 20344.0% for AGIs $100k-200k)
Taxable interest for individuals: $744 (reported on 15.7% of returns)
This zip code:
$744
Mississippi:
$1,434
(% of AGI for various income ranges: 1.5% for AGIs below $25k, 5.0% for AGIs $25k-50k, 4.5% for AGIs $50k-75k, 218.0% for AGIs $100k-200k)
Ordinary dividends: $917 (reported on 5.2% of returns)
Here:
$917
State:
$6,661
(% of AGI for various income ranges: 0.7% for AGIs $25k-50k, 106.0% for AGIs $100k-200k)
Net capital gain/loss in AGI: +$12,800 (reported on 3.5% of returns)
Here:
+$12,800
State:
+$16,833
(% of AGI for various income ranges: 0.3% for AGIs below $25k, 1022.0% for AGIs $100k-200k)
Profit/loss from business: +$1,248 (reported on 25.2% of returns)
Here:
+$1,248
State:
+$7,724
(% of AGI for various income ranges: 149.2% for AGIs below $25k, 56.4% for AGIs $50k-75k)
Taxable individual retirement arrangement distribution: $15,950 (reported on 3.5% of returns)
38642:
$15,950
Mississippi:
$17,717
(% of AGI for various income ranges: 580.0% for AGIs $50k-75k)
Total itemized deductions: $33,375 (reported on 7.0% of returns)
Here:
$33,375
State:
$34,027
(% of AGI for various income ranges: 282.1% for AGIs $25k-50k, 797.3% for AGIs $50k-75k, 2006.0% for AGIs $100k-200k)
Charity contributions: $13,343 (reported on 6.1% of returns)
Here:
$13,343
State:
$14,997
(% of AGI for various income ranges: 181.4% for AGIs $25k-50k, 1065.0% for AGIs $75k-100k)
Taxes paid: $4,178 (reported on 7.8% of returns)
38642:
$4,178
State:
$6,353
(% of AGI for various income ranges: 30.4% for AGIs $25k-50k, 123.6% for AGIs $50k-75k, 310.0% for AGIs $100k-200k)
Earned income credit: $2,624 (reported on 32.2% of returns)
Here:
$2,624
State:
$2,689
(% of AGI for various income ranges: 172.1% for AGIs below $25k, 107.1% for AGIs $25k-50k)
Percentage of individuals using paid preparers for their 2020 taxes: 93.0%
Here:
93%
State:
94%
(% for various income ranges: 94.0% for AGIs below $25k, 94.3% for AGIs $25k-50k, 92.9% for AGIs $50k-75k, 83.3% for AGIs $75k-100k, 90.0% for AGIs $100k-200k)
Averages for the 2012 tax year for zip code 38642, filed in 2013:
Average Adjusted Gross Income (AGI) in 2012: $32,516 (Individual Income Tax Returns)
Here:
$32,516
State:
$46,197
Salary/wage: $29,509 (reported on 89.5% of returns)
Here:
$29,509
State:
$38,549
(% of AGI for various income ranges: 81.8% for AGIs below $25k, 92.2% for AGIs $25k-50k, 82.3% for AGIs $50k-75k, 78.1% for AGIs $75k-100k, 63.6% for AGIs $100k-200k)
Taxable interest for individuals: $444 (reported on 15.2% of returns)
This zip code:
$444
Mississippi:
$1,482
(% of AGI for various income ranges: 0.2% for AGIs below $25k, 0.2% for AGIs $25k-50k, 0.2% for AGIs $50k-75k, 0.2% for AGIs $75k-100k, 0.2% for AGIs $100k-200k)
Ordinary dividends: $300 (reported on 3.8% of returns)
Here:
$300
State:
$5,401
Net capital gain/loss in AGI: +$2,467 (reported on 2.9% of returns)
Here:
+$2,467
State:
+$12,121
Profit/loss from business: +$4,495 (reported on 20.0% of returns)
Here:
+$4,495
State:
+$10,220
(% of AGI for various income ranges: 9.9% for AGIs below $25k, 6.4% for AGIs $50k-75k)
Taxable individual retirement arrangement distribution: $8,120 (reported on 4.8% of returns)
38642:
$8,120
Mississippi:
$13,665
Total itemized deductions: $19,168 (27% of AGI, reported on 18.1% of returns)
Here:
$19,168
State:
$22,078
Here:
26.7% of AGI
State:
21.8% of AGI
(% of AGI for various income ranges: 3.6% for AGIs below $25k, 10.0% for AGIs $25k-50k, 13.1% for AGIs $50k-75k, 16.7% for AGIs $75k-100k, 13.8% for AGIs $100k-200k)
Charity contributions: $5,067 (reported on 17.1% of returns)
Here:
$5,067
State:
$6,081
(% of AGI for various income ranges: 3.5% for AGIs $25k-50k, 3.5% for AGIs $50k-75k, 3.1% for AGIs $75k-100k, 3.4% for AGIs $100k-200k)
Taxes paid: $4,042 (reported on 18.1% of returns)
38642:
$4,042
State:
$5,794
(% of AGI for various income ranges: 0.4% for AGIs below $25k, 1.7% for AGIs $25k-50k, 2.5% for AGIs $50k-75k, 4.2% for AGIs $75k-100k, 3.8% for AGIs $100k-200k)
Earned income credit: $2,638 (reported on 42.9% of returns)
Here:
$2,638
State:
$2,710
(% of AGI for various income ranges: 13.8% for AGIs below $25k, 1.6% for AGIs $25k-50k)
Percentage of individuals using paid preparers for their 2012 taxes: 69.5%
Here:
70%
State:
60%
(% for various income ranges: 66.7% for AGIs below $25k, 76.7% for AGIs $25k-50k, 77.8% for AGIs $50k-75k, 40.0% for AGIs $75k-100k, 75.0% for AGIs $100k-200k)
Averages for the 2004 tax year for zip code 38642, filed in 2005:
Average Adjusted Gross Income (AGI) in 2004: $27,653 (Individual Income Tax Returns)
Here:
$27,653
State:
$36,110
Salary/wage: $26,627 (reported on 92.3% of returns)
Here:
$26,627
State:
$31,757
(% of AGI for various income ranges: 93.6% for AGIs below $10k, 90.9% for AGIs $10k-25k, 92.0% for AGIs $25k-50k, 88.5% for AGIs $50k-75k, 86.8% for AGIs $75k-100k, 75.7% for AGIs over 100k)
Taxable interest for individuals: $714 (reported on 15.4% of returns)
This zip code:
$714
Mississippi:
$1,649
(% of AGI for various income ranges: 2.0% for AGIs below $10k, 0.4% for AGIs $10k-25k, 0.4% for AGIs $25k-50k, 0.4% for AGIs $50k-75k, 0.2% for AGIs $75k-100k, 0.2% for AGIs over 100k)
Taxable dividends: $350 (reported on 4.2% of returns)
Here:
$350
State:
$3,089
Net capital gain/loss: +$2,032 (reported on 3.3% of returns)
Here:
+$2,032
State:
+$8,427
Profit/loss from business: +$4,038 (reported on 11.0% of returns)
Here:
+$4,038
State:
+$8,818
(% of AGI for various income ranges: 10.3% for AGIs below $10k, 1.9% for AGIs $10k-25k, 2.5% for AGIs $25k-50k, -1.1% for AGIs $75k-100k)
Total itemized deductions: $16,042 (27% of AGI, reported on 17.5% of returns)
Here:
$16,042
State:
$17,896
Here:
27.1% of AGI
State:
22.5% of AGI
(% of AGI for various income ranges: 2.6% for AGIs $10k-25k, 9.5% for AGIs $25k-50k, 18.6% for AGIs $50k-75k, 16.2% for AGIs $75k-100k, 14.2% for AGIs over 100k)
Charity contributions deductions: $4,549 (7% of AGI, reported on 16.1% of returns)
Here:
$4,549
State:
$4,735
Here:
7.5% of AGI
State:
5.7% of AGI
(% of AGI for various income ranges: 0.7% for AGIs $10k-25k, 2.4% for AGIs $25k-50k, 5.0% for AGIs $50k-75k, 4.7% for AGIs $75k-100k, 3.2% for AGIs over 100k)
Total tax: $3,077 (reported on 54.4% of returns)
38642:
$3,077
State:
$5,562
(% of AGI for various income ranges: 2.9% for AGIs below $10k, 2.0% for AGIs $10k-25k, 5.1% for AGIs $25k-50k, 7.6% for AGIs $50k-75k, 10.4% for AGIs $75k-100k, 12.0% for AGIs over 100k)
Earned income credit: $2,029 (reported on 43.3% of returns)
Here:
$2,029
State:
$2,107
Percentage of individuals using paid preparers for their 2004 taxes: 75.3%
Here:
75%
State:
65%
(% for various income ranges: 69.3% for AGIs below $10k, 80.2% for AGIs $10k-25k, 74.7% for AGIs $25k-50k, 70.5% for AGIs $50k-75k, 75.0% for AGIs $75k-100k, 77.8% for AGIs over 100k)
Household received Food Stamps/SNAP in the past 12 months: 158 Household did not receive Food Stamps/SNAP in the past 12 months: 630
Women who had a birth in the past 12 months: 42 (0 now married, 41 unmarried) Women who did not have a birth in the past 12 months: 500 (142 now married, 358 unmarried)
Housing units in zip code 38642 with a mortgage: 221 (11 second mortgage, 11 both second mortgage and home equity loan) Median monthly owner costs for units with a mortgage: $961 Median monthly owner costs for units without a mortgage: $678
Residents with income below the poverty level in 2022:
This zip code:
9.6%
Whole state:
19.1%
Residents with income below 50% of the poverty level in 2022:
This zip code:
7.8%
Whole state:
10.3%
Median number of rooms in houses and condos:
Here:
6.5
State:
6.3
Median number of rooms in apartments:
Here:
5.9
State:
4.8
Notable locations in this zip code not listed on our city pages
Churches in zip code 38642 include: Rice Chapel (A), Roberts Chapel (B), Samuels Chapel (C), Slayden Baptist Church (D), Sandhill Baptist Church (E), Clear Creek Church (F), Concord Church (G), Greenwood Church (H), Hebron Church (I). Display/hide their locations on the map
Cemeteries: Rice Chapel Cemetery (1), Clear Creek Cemetery (2), Samuel Chapel Cemetery (3), Old Lamar Cemetery (4), Robinson Cemetery (5), Early Grove Cemetery (6), Frnklin Cemetery (7). Display/hide their locations on the map
Size of family households: 275 2-persons, 58 3-persons, 144 4-persons, 23 5-persons, 9 6-persons, 35 7-or-more-persons
Size of nonfamily households: 206 1-person, 33 2-persons
259 married couples with children.
54 single-parent households (37 men, 17 women).
99.5% of residents of 38642 zip code speak English at home.
Foreign born population: 8 (0.4%) (100.0% of them are naturalized citizens)
This zip code:
0.4%
Whole state:
2.2%
89%France
29%English
Year of entry for the foreign-born population
02010 or later
02000 to 2009
01990 to 1999
7Before 1990
Facilities with environmental interests located in this zip code:
VIKING HOUSING FUND LLC (1 COYOTE CREEK DRIVE in LAMAR, MS)
STATE MASTER (Mississippi compliance, permits, activity tracking ) - ENSITE-MSU096133, WASTEWATER FACILITY National Pollutant Discharge Elimination System NON-MAJOR (Tracking pollutant discharge elimination systems) - permit Business SIC classification: OPERATORS OF APARTMENT BUILDINGS; LAND SUBDIVIDERS AND DEVELOPERS, EXCEPT CEMETERIES Alternative names: BENTON COUNTY, VIKING HOUSING FUND UNITS
LEHMAN ROBERTS COMPANY, NUMBER 1 (HIGHWAY 72 in SLAYDEN, MS)
AIR SYNTHETIC MINOR (AIRS/AFS) CRITERIA AND HAZARDOUS AIR POLLUTANT INVENTORY (Inventory of air pollution sources) Business SIC classification: ASPHALT PAVING MIXTURES AND BLOCKS Alternative names: LEHMAN ROBERTS INC
Housing units lacking complete kitchen facilities: 2.5%
39.8%Electricity
29.0%Bottled, tank, or LP gas
15.9%Utility gas
15.6%Wood
Population in 1990: 2,761.
Place of birth for U.S.-born residents:
This state: 1,474
Midwest: 88
South: 427
West: 30
68% of the 38642 zip code residents lived in the same house 5 years ago. Out of people who lived in different houses, 63% lived in this county. Out of people who lived in different counties, 50% lived in Mississippi.
91% of the 38642 zip code residents lived in the same house 1 year ago. Out of people who lived in different houses, 70% moved from this county. Out of people who lived in different houses, 19% moved from different county within same state. Out of people who lived in different houses, 4% moved from different state.
Private vs. public school enrollment:
Students in private schools in grades 1 to 8 (elementary and middle school):
Here:
0.0%
Mississippi:
16.1%
Students in private schools in grades 9 to 12 (high school):
Here:
0.0%
Mississippi:
14.6%
Students in private undergraduate colleges: 47
Here:
60.1%
Mississippi:
12.8%
Occupation by median earnings in the past 12 months ($)
59,586Production occupations
52,997Education, training, and library occupations
42,616Transportation occupations
32,039Office and administrative support occupations
12,767Food preparation and serving related occupations
Top industries in this zip code by the number of employees in 2005:
Construction: Water and Sewer Line and Related Structures Construction (50-99 employees: 1 establishment)
Construction: Site Preparation Contractors (5-9: 1, 1-4: 1)
Finance and Insurance: Commercial Banking (5-9: 1)
Other Services (except Public Administration): Automotive Body, Paint, and Interior Repair and Maintenance (1-4: 1)
Other Services (except Public Administration): Religious Organizations (1-4: 1)
Finance and Insurance: Investment Advice (1-4: 1)
Fatal accident statistics in 2014:
Fatal accident count: 3
Vehicles involved in fatal accidents: 4
Fatal accidents caused by drunken drivers: 0
Fatalities: 3
Persons involved in fatal accidents: 5
Pedestrians involved in fatal accidents: 0
Fatal accident statistics in 2013:
Fatal accident count: 1
Vehicles involved in fatal accidents: 1
Fatal accidents caused by drunken drivers: 0
Fatalities: 1
Persons involved in fatal accidents: 1
Pedestrians involved in fatal accidents: 0
Home Mortgage Disclosure Act Aggregated Statistics For Year 2009 (Based on 2 partial tracts)
A) FHA, FSA/RHS & VA Home Purchase Loans
B) Conventional Home Purchase Loans
C) Refinancings
D) Home Improvement Loans
F) Non-occupant Loans on < 5 Family Dwellings (A B C & D)
G) Loans On Manufactured Home Dwelling (A B C & D)
Number
Average Value
Number
Average Value
Number
Average Value
Number
Average Value
Number
Average Value
Number
Average Value
LOANS ORIGINATED
23
$124,427
17
$76,675
66
$107,811
8
$31,148
15
$66,181
17
$44,543
APPLICATIONS APPROVED, NOT ACCEPTED
0
$0
0
$0
2
$103,775
0
$0
0
$0
0
$0
APPLICATIONS DENIED
2
$145,115
3
$34,403
18
$120,122
2
$22,525
0
$0
4
$46,472
APPLICATIONS WITHDRAWN
2
$178,760
1
$160,230
14
$176,844
1
$42,190
0
$0
0
$0
FILES CLOSED FOR INCOMPLETENESS
1
$131,150
0
$0
1
$45,050
0
$0
0
$0
0
$0
Aggregated Statistics For Year 2008 (Based on 2 partial tracts)
A) FHA, FSA/RHS & VA Home Purchase Loans
B) Conventional Home Purchase Loans
C) Refinancings
D) Home Improvement Loans
F) Non-occupant Loans on < 5 Family Dwellings (A B C & D)
G) Loans On Manufactured Home Dwelling (A B C & D)
Number
Average Value
Number
Average Value
Number
Average Value
Number
Average Value
Number
Average Value
Number
Average Value
LOANS ORIGINATED
11
$125,081
17
$106,124
51
$110,373
14
$24,274
14
$99,541
18
$41,086
APPLICATIONS APPROVED, NOT ACCEPTED
1
$29,650
2
$59,015
5
$115,408
0
$0
0
$0
3
$59,680
APPLICATIONS DENIED
2
$64,435
7
$88,056
29
$150,710
12
$59,253
3
$116,320
6
$71,180
APPLICATIONS WITHDRAWN
0
$0
1
$85,530
9
$126,268
0
$0
0
$0
2
$51,890
FILES CLOSED FOR INCOMPLETENESS
0
$0
0
$0
2
$116,605
0
$0
0
$0
0
$0
Aggregated Statistics For Year 2007 (Based on 2 partial tracts)
A) FHA, FSA/RHS & VA Home Purchase Loans
B) Conventional Home Purchase Loans
C) Refinancings
D) Home Improvement Loans
F) Non-occupant Loans on < 5 Family Dwellings (A B C & D)
G) Loans On Manufactured Home Dwelling (A B C & D)
Number
Average Value
Number
Average Value
Number
Average Value
Number
Average Value
Number
Average Value
Number
Average Value
LOANS ORIGINATED
7
$134,079
29
$98,173
50
$121,179
18
$25,311
10
$80,113
16
$49,394
APPLICATIONS APPROVED, NOT ACCEPTED
1
$103,210
3
$94,083
6
$103,207
2
$52,175
0
$0
5
$57,704
APPLICATIONS DENIED
1
$83,250
15
$98,607
41
$109,214
10
$46,300
5
$66,828
14
$57,183
APPLICATIONS WITHDRAWN
1
$34,780
2
$130,005
18
$135,549
1
$3,990
1
$66,710
2
$78,975
FILES CLOSED FOR INCOMPLETENESS
0
$0
2
$74,125
5
$105,258
1
$13,680
0
$0
1
$43,340
Aggregated Statistics For Year 2006 (Based on 2 partial tracts)
A) FHA, FSA/RHS & VA Home Purchase Loans
B) Conventional Home Purchase Loans
C) Refinancings
D) Home Improvement Loans
F) Non-occupant Loans on < 5 Family Dwellings (A B C & D)
G) Loans On Manufactured Home Dwelling (A B C & D)
Number
Average Value
Number
Average Value
Number
Average Value
Number
Average Value
Number
Average Value
Number
Average Value
LOANS ORIGINATED
3
$139,320
51
$95,995
48
$89,486
14
$20,568
10
$41,796
22
$49,737
APPLICATIONS APPROVED, NOT ACCEPTED
1
$55,310
5
$121,794
9
$126,774
1
$19,960
0
$0
1
$75,840
APPLICATIONS DENIED
2
$82,110
25
$80,079
40
$94,867
11
$54,117
2
$39,915
22
$62,515
APPLICATIONS WITHDRAWN
0
$0
4
$90,235
13
$102,066
1
$157,950
1
$29,650
0
$0
FILES CLOSED FOR INCOMPLETENESS
0
$0
2
$113,755
15
$128,143
0
$0
1
$75,270
1
$52,460
Aggregated Statistics For Year 2005 (Based on 2 partial tracts)
A) FHA, FSA/RHS & VA Home Purchase Loans
B) Conventional Home Purchase Loans
C) Refinancings
D) Home Improvement Loans
F) Non-occupant Loans on < 5 Family Dwellings (A B C & D)
G) Loans On Manufactured Home Dwelling (A B C & D)
Number
Average Value
Number
Average Value
Number
Average Value
Number
Average Value
Number
Average Value
Number
Average Value
LOANS ORIGINATED
4
$84,675
40
$100,398
70
$90,564
11
$29,598
11
$44,890
17
$52,056
APPLICATIONS APPROVED, NOT ACCEPTED
1
$86,100
9
$69,374
13
$77,152
1
$10,260
1
$30,220
6
$51,318
APPLICATIONS DENIED
2
$70,420
24
$85,269
47
$97,189
10
$24,348
2
$43,620
18
$54,803
APPLICATIONS WITHDRAWN
1
$47,900
6
$91,802
11
$116,891
4
$139,985
1
$134,570
1
$51,890
FILES CLOSED FOR INCOMPLETENESS
0
$0
1
$120,310
8
$93,655
1
$5,700
0
$0
2
$77,830
Aggregated Statistics For Year 2004 (Based on 2 partial tracts)
A) FHA, FSA/RHS & VA Home Purchase Loans
B) Conventional Home Purchase Loans
C) Refinancings
D) Home Improvement Loans
F) Non-occupant Loans on < 5 Family Dwellings (A B C & D)
G) Loans On Manufactured Home Dwelling (A B C & D)
Detailed PMIC statistics for the following Tracts:9501.00
2003 - 2018 National Fire Incident Reporting System (NFIRS) incidents
According to the data from the years 2003 - 2018 the average number of fires per year is 29. The highest number of fires - 61 took place in 2010, and the least - 14 in 2008. The data has a growing trend.
When looking into fire subcategories, the most reports belonged to: Outside Fires (60.1%), and Structure Fires (24.1%).
Fire incident types reported to NFIRS in Zip Code 38642


 Nearest zip codes: 38647, 38057, 38046, 38603, 38635, 38066.


 According to the data from the years 2003 - 2018 the average number of fires per year is 29. The highest number of fires - 61 took place in 2010, and the least - 14 in 2008. The data has a growing trend.
 When looking into fire subcategories, the most reports belonged to: Outside Fires (60.1%), and Structure Fires (24.1%).