Estimated zip code population in 2022: 3,728 Zip code population in 2010: 3,956 Zip code population in 2000: 3,502
Houses and condos: 2,021 Renter-occupied apartments: 242
% of renters here:
15%
State:
30%
March 2022 cost of living index in zip code 39094: 77.8 (low, U.S. average is 100)
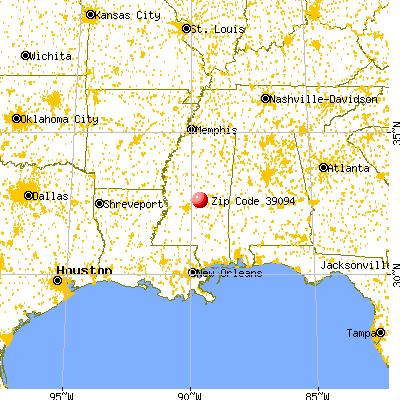
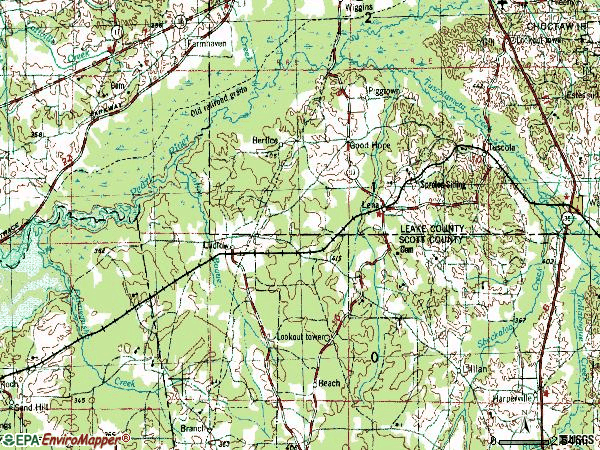
Land area: 163.8 sq. mi. Water area: 1.1 sq. mi.
Population density: 23 people per square mile
(very low).
OSM Map
General Map
Google Map
MSN Map
OSM Map
General Map
Google Map
MSN Map
OSM Map
General Map
Google Map
MSN Map
OSM Map
General Map
Google Map
MSN Map
Please wait while loading the map...
Real estate property taxes paid for housing units in 2022:
This zip code:
0.6% ($636)
Mississippi:
0.7% ($1,161)
Median real estate property taxes paid for housing units with mortgages in 2022: $754 (0.6%) Median real estate property taxes paid for housing units with no mortgage in 2022: $514 (0.5%)
Business Search- 14 Million verified businesses
Males: 1,786
(47.9%)
Females: 1,941
(52.1%)
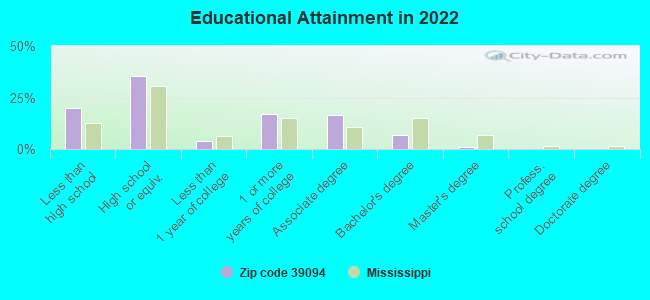
For population 25 years and over in 39094:
High school or higher: 77.4%
Bachelor's degree or higher: 7.6%
Graduate or professional degree: 1.0%
Unemployed: 2.2%
Mean travel time to work (commute): 36.1 minutes
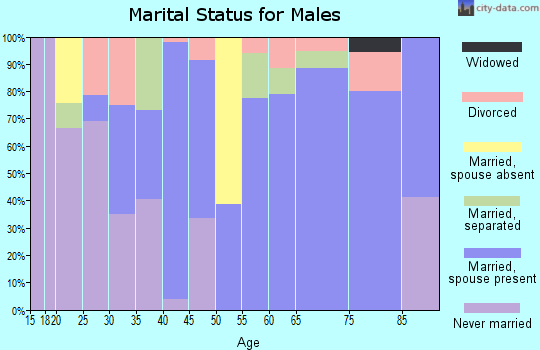
For population 15 years and over in 39094:
Never married: 28.7%
Now married: 48.1%
Separated: 2.3%
Widowed: 9.7%
Divorced: 11.2%
Zip code 39094 compared to state average:
Median house value below state average.
Unemployed percentage below state average.
Hispanic race population percentage significantly below state average.
Median age above state average.
Foreign-born population percentage significantly below state average.
Renting percentage below state average.
Length of stay since moving in significantly above state average.
Number of college students below state average.
Percentage of population with a bachelor's degree or higher significantly below state average.
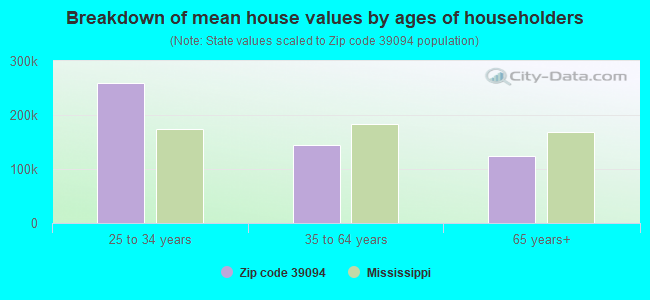
Estimated median house/condo value in 2022: $103,526
39094:
$103,526
Mississippi:
$162,500
According to our research of Mississippi and other state lists, there were 6 registered sex offenders living in 39094 zip code as of May 28, 2024. The ratio of all residents to sex offenders in zip code 39094 is 555 to 1. The ratio of registered sex offenders to all residents in this zip code is lower than the state average.
Median resident age:
This zip code:
45.9 years
Mississippi median age:
38.9 years
Average household size:
This zip code:
2.3 people
Mississippi:
2.5 people
Averages for the 2020 tax year for zip code 39094, filed in 2021:
Average Adjusted Gross Income (AGI) in 2020: $45,920 (Individual Income Tax Returns)
Here:
$45,920
State:
$54,084
Salary/wage: $42,138 (reported on 84.7% of returns)
Here:
$42,138
State:
$45,187
(% of AGI for various income ranges: 1286.4% for AGIs below $25k, 3785.6% for AGIs $25k-50k, 6682.5% for AGIs $50k-75k, 10797.1% for AGIs $75k-100k, 15641.1% for AGIs $100k-200k)
Taxable interest for individuals: $807 (reported on 17.8% of returns)
This zip code:
$807
Mississippi:
$1,434
(% of AGI for various income ranges: 7.2% for AGIs below $25k, 10.3% for AGIs $25k-50k, 15.6% for AGIs $50k-75k, 82.9% for AGIs $75k-100k, 80.0% for AGIs $100k-200k)
Ordinary dividends: $1,414 (reported on 4.5% of returns)
Here:
$1,414
State:
$6,661
(% of AGI for various income ranges: 18.8% for AGIs $50k-75k, 76.7% for AGIs $100k-200k)
Net capital gain/loss in AGI: +$7,200 (reported on 4.5% of returns)
Here:
+$7,200
State:
+$16,833
(% of AGI for various income ranges: 61.9% for AGIs $50k-75k, 452.2% for AGIs $100k-200k)
Profit/loss from business: +$5,922 (reported on 14.6% of returns)
Here:
+$5,922
State:
+$7,724
(% of AGI for various income ranges: 67.7% for AGIs below $25k, 4.2% for AGIs $25k-50k, 361.2% for AGIs $50k-75k, 501.1% for AGIs $100k-200k)
Taxable individual retirement arrangement distribution: $11,150 (reported on 3.8% of returns)
39094:
$11,150
Mississippi:
$17,717
(% of AGI for various income ranges: 61.3% for AGIs below $25k, 238.1% for AGIs $50k-75k)
Total itemized deductions: $26,650 (reported on 3.8% of returns)
Here:
$26,650
State:
$34,027
(% of AGI for various income ranges: 206.7% for AGIs $25k-50k, 1221.4% for AGIs $75k-100k)
Charity contributions: $12,775 (reported on 2.5% of returns)
Here:
$12,775
State:
$14,997
(% of AGI for various income ranges: 56.4% for AGIs $25k-50k, 440.0% for AGIs $75k-100k)
Taxes paid: $4,083 (reported on 3.8% of returns)
39094:
$4,083
State:
$6,353
(% of AGI for various income ranges: 21.7% for AGIs $25k-50k, 238.6% for AGIs $75k-100k)
Earned income credit: $2,689 (reported on 29.3% of returns)
Here:
$2,689
State:
$2,689
(% of AGI for various income ranges: 168.7% for AGIs below $25k, 123.3% for AGIs $25k-50k)
Percentage of individuals using paid preparers for their 2020 taxes: 91.7%
Here:
92%
State:
94%
(% for various income ranges: 91.9% for AGIs below $25k, 93.2% for AGIs $25k-50k, 90.9% for AGIs $50k-75k, 91.7% for AGIs $75k-100k, 92.9% for AGIs $100k-200k, 66.7% for AGIs over 200k)
Averages for the 2012 tax year for zip code 39094, filed in 2013:
Average Adjusted Gross Income (AGI) in 2012: $38,298 (Individual Income Tax Returns)
Here:
$38,298
State:
$46,197
Salary/wage: $36,105 (reported on 87.1% of returns)
Here:
$36,105
State:
$38,549
(% of AGI for various income ranges: 83.6% for AGIs below $25k, 84.4% for AGIs $25k-50k, 88.4% for AGIs $50k-75k, 84.4% for AGIs $75k-100k, 73.1% for AGIs $100k-200k)
Taxable interest for individuals: $812 (reported on 17.9% of returns)
This zip code:
$812
Mississippi:
$1,482
(% of AGI for various income ranges: 0.4% for AGIs below $25k, 0.6% for AGIs $25k-50k, 0.2% for AGIs $50k-75k, 0.2% for AGIs $75k-100k, 0.4% for AGIs $100k-200k)
Ordinary dividends: $1,333 (reported on 4.3% of returns)
Here:
$1,333
State:
$5,401
Net capital gain/loss in AGI: +$4,760 (reported on 3.6% of returns)
Here:
+$4,760
State:
+$12,121
Profit/loss from business: +$5,461 (reported on 16.4% of returns)
Here:
+$5,461
State:
+$10,220
(% of AGI for various income ranges: 9.5% for AGIs below $25k, 2.0% for AGIs $25k-50k, 1.2% for AGIs $50k-75k)
Taxable individual retirement arrangement distribution: $5,483 (reported on 4.3% of returns)
39094:
$5,483
Mississippi:
$13,665
Total itemized deductions: $19,389 (26% of AGI, reported on 19.3% of returns)
Here:
$19,389
State:
$22,078
Here:
26.3% of AGI
State:
21.8% of AGI
(% of AGI for various income ranges: 5.9% for AGIs below $25k, 9.4% for AGIs $25k-50k, 9.4% for AGIs $50k-75k, 14.5% for AGIs $75k-100k, 10.5% for AGIs $100k-200k)
Charity contributions: $5,520 (reported on 14.3% of returns)
Here:
$5,520
State:
$6,081
(% of AGI for various income ranges: 2.6% for AGIs $25k-50k, 2.1% for AGIs $50k-75k, 2.9% for AGIs $75k-100k, 2.4% for AGIs $100k-200k)
Taxes paid: $4,185 (reported on 19.3% of returns)
39094:
$4,185
State:
$5,794
(% of AGI for various income ranges: 0.7% for AGIs below $25k, 1.3% for AGIs $25k-50k, 1.6% for AGIs $50k-75k, 3.1% for AGIs $75k-100k, 3.7% for AGIs $100k-200k)
Earned income credit: $2,675 (reported on 37.9% of returns)
Here:
$2,675
State:
$2,710
(% of AGI for various income ranges: 12.5% for AGIs below $25k, 2.0% for AGIs $25k-50k)
Percentage of individuals using paid preparers for their 2012 taxes: 66.4%
Here:
66%
State:
60%
(% for various income ranges: 66.2% for AGIs below $25k, 64.9% for AGIs $25k-50k, 64.7% for AGIs $50k-75k, 75.0% for AGIs $75k-100k, 70.0% for AGIs $100k-200k)
Averages for the 2004 tax year for zip code 39094, filed in 2005:
Average Adjusted Gross Income (AGI) in 2004: $29,237 (Individual Income Tax Returns)
Here:
$29,237
State:
$36,110
Salary/wage: $27,042 (reported on 89.9% of returns)
Here:
$27,042
State:
$31,757
(% of AGI for various income ranges: 98.7% for AGIs below $10k, 87.9% for AGIs $10k-25k, 90.7% for AGIs $25k-50k, 85.0% for AGIs $50k-75k, 83.8% for AGIs $75k-100k, 48.5% for AGIs over 100k)
Taxable interest for individuals: $1,599 (reported on 21.1% of returns)
This zip code:
$1,599
Mississippi:
$1,649
(% of AGI for various income ranges: 2.0% for AGIs below $10k, 1.0% for AGIs $10k-25k, 0.6% for AGIs $25k-50k, 2.0% for AGIs $50k-75k, 0.3% for AGIs $75k-100k, 2.1% for AGIs over 100k)
Taxable dividends: $600 (reported on 5.9% of returns)
Here:
$600
State:
$3,089
(% of AGI for various income ranges: 0.3% for AGIs below $10k, 0.0% for AGIs $10k-25k, 0.1% for AGIs $25k-50k, 0.1% for AGIs $50k-75k, 0.3% for AGIs over 100k)
Net capital gain/loss: +$4,889 (reported on 5.0% of returns)
Here:
+$4,889
State:
+$8,427
(% of AGI for various income ranges: -0.0% for AGIs $10k-25k, -0.1% for AGIs $25k-50k, 1.9% for AGIs $50k-75k, 3.8% for AGIs over 100k)
Profit/loss from business: +$4,846 (reported on 9.9% of returns)
Here:
+$4,846
State:
+$8,818
(% of AGI for various income ranges: 13.3% for AGIs below $10k, 2.8% for AGIs $10k-25k, 0.5% for AGIs $25k-50k, 1.0% for AGIs $50k-75k, 1.8% for AGIs $75k-100k)
Total itemized deductions: $15,006 (23% of AGI, reported on 11.5% of returns)
Here:
$15,006
State:
$17,896
Here:
23.3% of AGI
State:
22.5% of AGI
(% of AGI for various income ranges: 2.2% for AGIs $10k-25k, 4.5% for AGIs $25k-50k, 7.8% for AGIs $50k-75k, 9.9% for AGIs $75k-100k, 9.9% for AGIs over 100k)
Charity contributions deductions: $3,951 (6% of AGI, reported on 9.9% of returns)
Here:
$3,951
State:
$4,735
Here:
6.0% of AGI
State:
5.7% of AGI
(% of AGI for various income ranges: 0.5% for AGIs $10k-25k, 0.8% for AGIs $25k-50k, 2.0% for AGIs $50k-75k, 2.7% for AGIs $75k-100k, 2.1% for AGIs over 100k)
Total tax: $3,563 (reported on 60.7% of returns)
39094:
$3,563
State:
$5,562
(% of AGI for various income ranges: 3.3% for AGIs below $10k, 2.5% for AGIs $10k-25k, 6.2% for AGIs $25k-50k, 8.5% for AGIs $50k-75k, 11.1% for AGIs $75k-100k, 13.9% for AGIs over 100k)
Earned income credit: $2,130 (reported on 39.0% of returns)
Here:
$2,130
State:
$2,107
Percentage of individuals using paid preparers for their 2004 taxes: 68.4%
Here:
68%
State:
65%
(% for various income ranges: 69.0% for AGIs below $10k, 69.9% for AGIs $10k-25k, 66.1% for AGIs $25k-50k, 63.4% for AGIs $50k-75k, 70.1% for AGIs $75k-100k, 82.4% for AGIs over 100k)
Household received Food Stamps/SNAP in the past 12 months: 99 Household did not receive Food Stamps/SNAP in the past 12 months: 1,517
Women who had a birth in the past 12 months: 43 (23 now married, 20 unmarried) Women who did not have a birth in the past 12 months: 635 (228 now married, 407 unmarried)
Housing units in zip code 39094 with a mortgage: 330 Houses without a mortgage: 1
Median monthly owner costs for units with a mortgage: $968 Median monthly owner costs for units without a mortgage: $402
Residents with income below the poverty level in 2022:
This zip code:
9.7%
Whole state:
19.1%
Residents with income below 50% of the poverty level in 2022:
This zip code:
6.7%
Whole state:
10.3%
Median number of rooms in houses and condos:
Here:
6.3
State:
6.3
Median number of rooms in apartments:
Here:
5.5
State:
4.8
Notable locations in this zip code not listed on our city pages
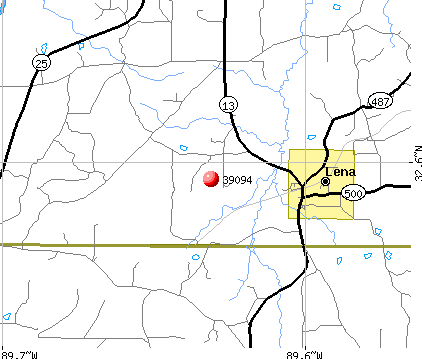
Notable locations in zip code 39094: Sproles Siding (A), Ludlow Volunteer Fire Department (B), Lena Volunteer Fire Department (C). Display/hide their locations on the map
Churches in zip code 39094 include: Rising Chapel (A), Allen Chapel (B), Tuscola Missionary Baptist Church (C), Lena Methodist Church (D), Lena Baptist Church (E), Good Hope Methodist Church (F), Good Hope Baptist Church (G), Faith Baptist Church (H), Cedar Grove Baptist Church (I). Display/hide their locations on the map
Cemeteries: Robinson Cemetery (1), Pilgrim Rest Cemetery (2), Pearson Cemetery (3), Coward Cemetery (4), Cash Cemetery (5), Mount Zion Cemetery (6), Eureka Cemetery (7). Display/hide their locations on the map
Streams, rivers, and creeks: Balucta Creek (A), Watson Branch (B), Sycamore Creek (C), Babb Branch (D), Rollison Creek (E), Beach Creek (F), Browns Old River (G), Red Cane Creek (H), Purnell Creek (I). Display/hide their locations on the map
Size of family households: 541 2-persons, 257 3-persons, 147 4-persons, 45 5-persons, 9 6-persons, 18 7-or-more-persons
Size of nonfamily households: 573 1-person, 29 2-persons
333 married couples with children.
207 single-parent households (20 men, 187 women).
99.3% of residents of 39094 zip code speak English at home.
0.4% of residents speak Spanish at home (100% very well).
0.4% of residents speak Asian or Pacific Island language at home (100% very well).
Foreign born population: 16 (0.4%) (0.0% of them are naturalized citizens)
:
0.4%
Whole state:
2.2%
100%Cambodia
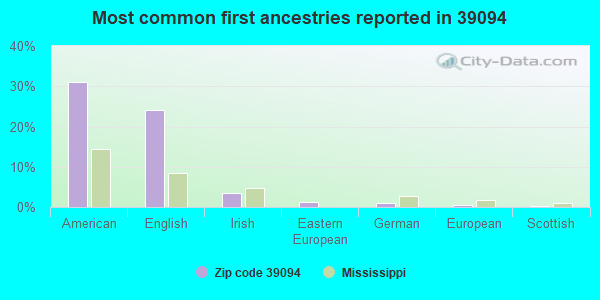
31%American
24%English
4%Irish
1%Eastern European
1%German
0%European
0%Scottish
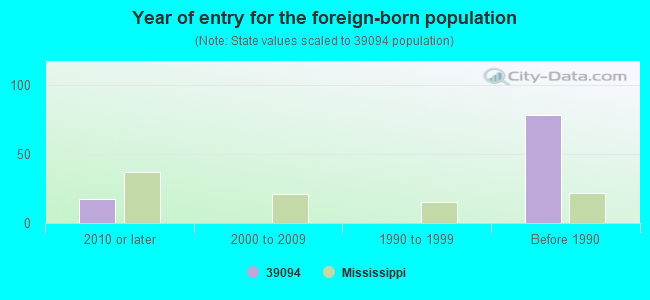
Year of entry for the foreign-born population
172010 or later
02000 to 2009
01990 to 1999
78Before 1990
Facilities with environmental interests located in this zip code:
BILLY RAY GUNN, POULTRY (2405 CASH ROAD in LENA, MS)
STATE MASTER (Mississippi compliance, permits, activity tracking ) - ENSITE-MSU094027, WASTEWATER FACILITY National Pollutant Discharge Elimination System NON-MAJOR (Tracking pollutant discharge elimination systems) - permit Business SIC classification: BROILER, FRYER, AND ROASTER CHICKENS Alternative names: SCOTT, SCOTT COUNTY
CHARLES J SESSUMS, POULTRY (680 PIGGTOWN ROAD in LENA, MS)
STATE MASTER (Mississippi compliance, permits, activity tracking ) - ENSITE-MSU040073, WASTEWATER FACILITY National Pollutant Discharge Elimination System NON-MAJOR (Tracking pollutant discharge elimination systems) - permit Business SIC classification: BROILER, FRYER, AND ROASTER CHICKENS Alternative names: LEAKE
CLARENCE A MOSS JR, POULTRY (OLD HIGHWAY 13 in LENA, MS)
STATE MASTER (Mississippi compliance, permits, activity tracking ) - ENSITE-MSU040083, WASTEWATER FACILITY National Pollutant Discharge Elimination System NON-MAJOR (Tracking pollutant discharge elimination systems) - permit Business SIC classification: BROILER, FRYER, AND ROASTER CHICKENS Alternative names: LEAKE
CORNELIA PUCKETT, POULTRY (1544 NEW HOME ROAD in LENA, MS)
STATE MASTER (Mississippi compliance, permits, activity tracking ) - ENSITE-MSU096020, WASTEWATER FACILITY National Pollutant Discharge Elimination System NON-MAJOR (Tracking pollutant discharge elimination systems) - permit Business SIC classification: CHICKEN EGGS Alternative names: GARY PHILLIPSON POULTRY, SCOTT COUNTY
DONALD BARRETT, POULTRY (543 NORTH SMITH LANE in LENA, MS)
STATE MASTER (Mississippi compliance, permits, activity tracking ) - ENSITE-MSU040059, WASTEWATER FACILITY National Pollutant Discharge Elimination System NON-MAJOR (Tracking pollutant discharge elimination systems) - permit Business SIC classification: BROILER, FRYER, AND ROASTER CHICKENS Alternative names: SCOTT
DONALD RAY GUNN, POULTRY FARM 2 (WEST RHINEWALT ROAD in LENA, MS)
STATE MASTER (Mississippi compliance, permits, activity tracking ) - ENSITE-MSG150238, LIVE STOCK WASTE CONTROL National Pollutant Discharge Elimination System NON-MAJOR (Tracking pollutant discharge elimination systems) - permit Business SIC classification: BROILER, FRYER, AND ROASTER CHICKENS Alternative names: DONALD RAY GUNN POULTRY FARM, LEAKE, SCOTT
MITCHEL JOHNSTON, POULTRY (129 JERICO ROAD in LENA, MS)
STATE MASTER (Mississippi compliance, permits, activity tracking ) - ENSITE-MSU030067, WASTEWATER FACILITY National Pollutant Discharge Elimination System NON-MAJOR (Tracking pollutant discharge elimination systems) - permit Business SIC classification: BROILER, FRYER, AND ROASTER CHICKENS Alternative names: LEAKE
DICKERSON AND BOWEN INC, CARTHAGE (UTAH ROAD in LENA, MS)
AIR SYNTHETIC MINOR (AIRS/AFS) STATE MASTER (Mississippi compliance, permits, activity tracking ) - ENSITE-152000021, AIR PROGRAM, ENSITE-07900021, Business SIC classification: ASPHALT PAVING MIXTURES AND BLOCKS
BELL FARMS POULTRY (17392 HIGHWAY 13 NORTH in LENA, MS)
National Pollutant Discharge Elimination System NON-MAJOR (Tracking pollutant discharge elimination systems) - permit Business SIC classification: POULTRY AND EGGS Alternative names: SCOTT COUNTY
DONALD RAY GUNN POULTRY FARM (MAZE ROAD in LENA, MS)
National Pollutant Discharge Elimination System NON-MAJOR (Tracking pollutant discharge elimination systems) - permit Business SIC classification: POULTRY AND EGGS
Housing units lacking complete plumbing facilities: 4.5% Housing units lacking complete kitchen facilities: 7.2%
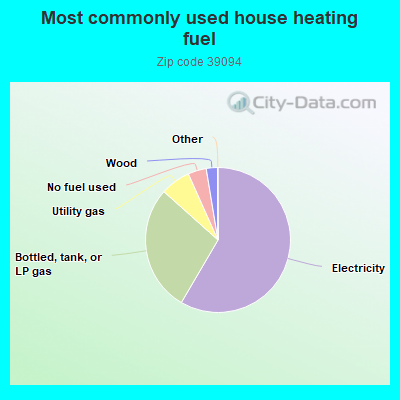
58.5%Electricity
28.2%Bottled, tank, or LP gas
6.7%Utility gas
4.1%No fuel used
2.5%Wood
Population in 1990: 3,622.
Place of birth for U.S.-born residents:
This state: 3,129
Northeast: 12
Midwest: 27
South: 341
West: 87
72% of the 39094 zip code residents lived in the same house 5 years ago. Out of people who lived in different houses, 62% lived in this county. Out of people who lived in different counties, 50% lived in Mississippi.
99% of the 39094 zip code residents lived in the same house 1 year ago. Out of people who lived in different houses, 103% moved from different county within same state. Out of people who lived in different houses, 6% moved from different state.
Private vs. public school enrollment:
Students in private schools in grades 1 to 8 (elementary and middle school): 87
Here:
24.4%
Mississippi:
16.1%
Students in private schools in grades 9 to 12 (high school): 14
Here:
13.3%
Mississippi:
14.6%
Students in private undergraduate colleges:
Here:
0.0%
Mississippi:
12.8%
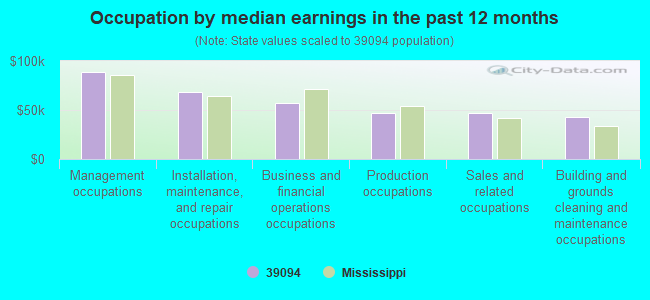
Occupation by median earnings in the past 12 months ($)
88,736Management occupations
68,639Installation, maintenance, and repair occupations
57,055Business and financial operations occupations
47,027Production occupations
46,879Sales and related occupations
42,764Building and grounds cleaning and maintenance occupations
Companies with federal contracts located in this zip code:
JAMES N BROWN (3323 DOC WEBB RD in LENA, MS; small business) : $44,010 in 7 contractsfrom 2004 to 2006
Contracts for Recreation Site Maintenance Services (non-construction) by Army, U.S. Army Corps of Engineers - civil program financing only Signed by year:2000: $0; 2001: $0; 2002: $0; 2003: $0; 2004: $14,250; 2005: $15,200; 2006: $14,560.
Biggest contracts:
$14,560 with Army for Recreation Site Maintenance Services (non-construction). Signed on 2006-02-22. Completion date: 2006-10-30.
$7,125, same as above.Signed on 2005-03-01. Completion date: 2004-09-12.
$7,125 with U.S. Army Corps of Engineers - civil program financing only for Recreation Site Maintenance Services (non-construction). Signed on 2005-03-01. Completion date: 2004-09-12.
$7,125, same as above.Signed on 2004-03-02. Completion date: 2004-09-12.
Top industries in this zip code by the number of employees in 2005:
Administrative and Support and Waste Management and Remediation Services: Landscaping Services (50-99 employees: 1 establishment, 1-4 employees: 1 establishment)
Accommodation and Food Services: Full-Service Restaurants (10-19: 1)
Professional, Scientific, and Technical Services: Veterinary Services (10-19: 1)
Construction: Glass and Glazing Contractors (5-9: 1)
Administrative and Support and Waste Management and Remediation Services: Exterminating and Pest Control Services (1-4: 1)
Fatal accident statistics in 2014:
Fatal accident count: 2
Vehicles involved in fatal accidents: 2
Fatal accidents caused by drunken drivers: 1
Fatalities: 2
Persons involved in fatal accidents: 2
Pedestrians involved in fatal accidents: 1
Fatal accident statistics in 2013:
Fatal accident count: 2
Vehicles involved in fatal accidents: 2
Fatal accidents caused by drunken drivers: 0
Fatalities: 2
Persons involved in fatal accidents: 2
Pedestrians involved in fatal accidents: 0
Home Mortgage Disclosure Act Aggregated Statistics For Year 2009 (Based on 2 partial tracts)
A) FHA, FSA/RHS & VA Home Purchase Loans
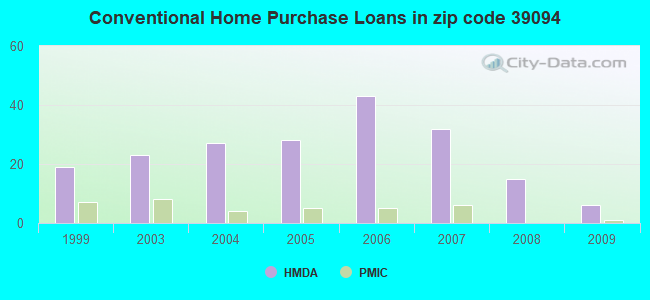
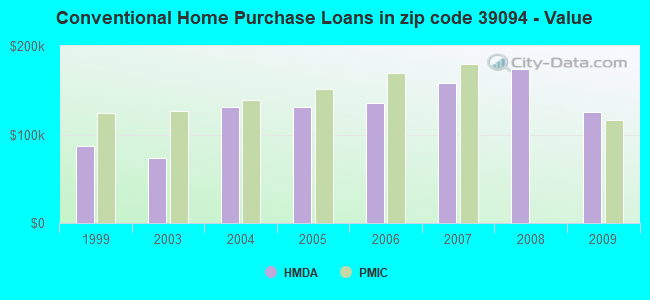
B) Conventional Home Purchase Loans
C) Refinancings
D) Home Improvement Loans
F) Non-occupant Loans on < 5 Family Dwellings (A B C & D)
G) Loans On Manufactured Home Dwelling (A B C & D)
Number
Average Value
Number
Average Value
Number
Average Value
Number
Average Value
Number
Average Value
Number
Average Value
LOANS ORIGINATED
8
$148,224
6
$125,873
37
$178,263
4
$12,852
6
$157,627
5
$33,642
APPLICATIONS APPROVED, NOT ACCEPTED
0
$0
0
$0
2
$112,455
0
$0
0
$0
1
$25,700
APPLICATIONS DENIED
0
$0
2
$102,625
5
$157,778
2
$19,845
0
$0
3
$39,817
APPLICATIONS WITHDRAWN
2
$116,425
1
$100,170
7
$163,189
0
$0
0
$0
0
$0
FILES CLOSED FOR INCOMPLETENESS
0
$0
0
$0
2
$123,415
0
$0
0
$0
0
$0
Aggregated Statistics For Year 2008 (Based on 2 partial tracts)
A) FHA, FSA/RHS & VA Home Purchase Loans
B) Conventional Home Purchase Loans
C) Refinancings
D) Home Improvement Loans
F) Non-occupant Loans on < 5 Family Dwellings (A B C & D)
G) Loans On Manufactured Home Dwelling (A B C & D)
Number
Average Value
Number
Average Value
Number
Average Value
Number
Average Value
Number
Average Value
Number
Average Value
LOANS ORIGINATED
5
$146,438
15
$174,561
22
$156,131
5
$19,656
7
$120,906
5
$41,050
APPLICATIONS APPROVED, NOT ACCEPTED
0
$0
3
$79,757
3
$167,580
0
$0
0
$0
2
$46,115
APPLICATIONS DENIED
2
$138,725
4
$144,395
12
$149,814
2
$36,855
0
$0
4
$63,220
APPLICATIONS WITHDRAWN
1
$113,780
1
$109,620
3
$171,990
1
$39,310
0
$0
0
$0
FILES CLOSED FOR INCOMPLETENESS
0
$0
0
$0
2
$122,095
0
$0
0
$0
0
$0
Aggregated Statistics For Year 2007 (Based on 2 partial tracts)
A) FHA, FSA/RHS & VA Home Purchase Loans
B) Conventional Home Purchase Loans
C) Refinancings
D) Home Improvement Loans
F) Non-occupant Loans on < 5 Family Dwellings (A B C & D)
G) Loans On Manufactured Home Dwelling (A B C & D)
Number
Average Value
Number
Average Value
Number
Average Value
Number
Average Value
Number
Average Value
Number
Average Value
LOANS ORIGINATED
5
$148,932
32
$157,709
20
$134,417
6
$44,415
8
$126,725
9
$46,704
APPLICATIONS APPROVED, NOT ACCEPTED
0
$0
5
$85,276
3
$111,637
0
$0
0
$0
3
$31,247
APPLICATIONS DENIED
1
$52,920
7
$85,374
9
$175,644
5
$40,068
1
$89,960
6
$61,173
APPLICATIONS WITHDRAWN
0
$0
2
$168,210
5
$188,698
0
$0
2
$100,735
1
$48,010
FILES CLOSED FOR INCOMPLETENESS
0
$0
1
$242,300
2
$139,480
0
$0
0
$0
0
$0
Aggregated Statistics For Year 2006 (Based on 2 partial tracts)
A) FHA, FSA/RHS & VA Home Purchase Loans
B) Conventional Home Purchase Loans
C) Refinancings
D) Home Improvement Loans
F) Non-occupant Loans on < 5 Family Dwellings (A B C & D)
G) Loans On Manufactured Home Dwelling (A B C & D)
Number
Average Value
Number
Average Value
Number
Average Value
Number
Average Value
Number
Average Value
Number
Average Value
LOANS ORIGINATED
9
$138,726
43
$135,632
22
$120,840
5
$37,724
6
$101,618
5
$51,560
APPLICATIONS APPROVED, NOT ACCEPTED
0
$0
7
$80,891
5
$111,586
0
$0
1
$71,820
6
$48,698
APPLICATIONS DENIED
0
$0
10
$92,723
8
$106,832
2
$9,260
1
$92,990
6
$51,533
APPLICATIONS WITHDRAWN
0
$0
1
$188,240
5
$137,970
0
$0
0
$0
0
$0
FILES CLOSED FOR INCOMPLETENESS
0
$0
1
$115,670
1
$134,570
0
$0
0
$0
0
$0
Aggregated Statistics For Year 2005 (Based on 2 partial tracts)
A) FHA, FSA/RHS & VA Home Purchase Loans
B) Conventional Home Purchase Loans
C) Refinancings
D) Home Improvement Loans
F) Non-occupant Loans on < 5 Family Dwellings (A B C & D)
G) Loans On Manufactured Home Dwelling (A B C & D)
Number
Average Value
Number
Average Value
Number
Average Value
Number
Average Value
Number
Average Value
Number
Average Value
LOANS ORIGINATED
5
$111,358
28
$130,923
28
$135,770
5
$18,748
5
$80,740
9
$52,038
APPLICATIONS APPROVED, NOT ACCEPTED
0
$0
3
$63,757
5
$95,030
0
$0
0
$0
3
$34,523
APPLICATIONS DENIED
0
$0
8
$98,185
11
$101,510
3
$15,623
0
$0
7
$46,386
APPLICATIONS WITHDRAWN
0
$0
6
$95,067
8
$227,036
1
$147,040
1
$76,360
1
$71,440
FILES CLOSED FOR INCOMPLETENESS
0
$0
1
$116,420
3
$112,517
0
$0
0
$0
0
$0
Aggregated Statistics For Year 2004 (Based on 2 partial tracts)
A) FHA, FSA/RHS & VA Home Purchase Loans
B) Conventional Home Purchase Loans
C) Refinancings
D) Home Improvement Loans
F) Non-occupant Loans on < 5 Family Dwellings (A B C & D)
G) Loans On Manufactured Home Dwelling (A B C & D)
Number
Average Value
Number
Average Value
Number
Average Value
Number
Average Value
Number
Average Value
Number
Average Value
LOANS ORIGINATED
8
$122,661
27
$131,614
30
$114,660
4
$33,265
7
$70,901
8
$47,345
APPLICATIONS APPROVED, NOT ACCEPTED
0
$0
6
$81,963
6
$117,053
0
$0
0
$0
4
$52,638
APPLICATIONS DENIED
1
$106,970
10
$76,583
15
$101,052
4
$12,948
2
$68,985
8
$60,432
APPLICATIONS WITHDRAWN
0
$0
3
$154,350
11
$126,149
0
$0
0
$0
2
$56,135
FILES CLOSED FOR INCOMPLETENESS
0
$0
1
$48,760
3
$115,417
0
$0
1
$97,520
0
$0
Aggregated Statistics For Year 2003 (Based on 2 partial tracts)
A) FHA, FSA/RHS & VA Home Purchase Loans
B) Conventional Home Purchase Loans
C) Refinancings
D) Home Improvement Loans
F) Non-occupant Loans on < 5 Family Dwellings (A B C & D)
Number
Average Value
Number
Average Value
Number
Average Value
Number
Average Value
Number
Average Value
LOANS ORIGINATED
4
$97,525
23
$73,447
39
$107,478
5
$10,432
6
$47,880
APPLICATIONS APPROVED, NOT ACCEPTED
0
$0
6
$40,320
6
$82,342
1
$17,390
0
$0
APPLICATIONS DENIED
3
$42,210
17
$47,050
11
$92,988
3
$18,397
1
$54,050
APPLICATIONS WITHDRAWN
0
$0
2
$89,020
6
$84,987
0
$0
1
$55,940
FILES CLOSED FOR INCOMPLETENESS
0
$0
0
$0
2
$165,185
0
$0
0
$0
Aggregated Statistics For Year 1999 (Based on 1 partial tract)
A) FHA, FSA/RHS & VA Home Purchase Loans
B) Conventional Home Purchase Loans
C) Refinancings
D) Home Improvement Loans
F) Non-occupant Loans on < 5 Family Dwellings (A B C & D)
Detailed PMIC statistics for the following Tracts:0201.01
2003 - 2018 National Fire Incident Reporting System (NFIRS) incidents
Based on the data from the years 2003 - 2018 the average number of fires per year is 36. The highest number of fire incidents - 64 took place in 2006, and the least - 14 in 2013. The data has a dropping trend.
When looking into fire subcategories, the most incidents belonged to: Outside Fires (43.8%), and Structure Fires (36.0%).
Fire incident types reported to NFIRS in Zip Code 39094


 Nearest zip codes: 39051, 39045, 39189, 39074, 39145, 39117.


 Based on the data from the years 2003 - 2018 the average number of fires per year is 36. The highest number of fire incidents - 64 took place in 2006, and the least - 14 in 2013. The data has a dropping trend.
 When looking into fire subcategories, the most incidents belonged to: Outside Fires (43.8%), and Structure Fires (36.0%).