According to our research of Mississippi and other state lists, there were 3 registered sex offenders living in 39320 zip code as of May 28, 2024. The ratio of all residents to sex offenders in zip code 39320 is 635 to 1. The ratio of registered sex offenders to all residents in this zip code is lower than the state average.
Median resident age:
This zip code:
51.8 years
Mississippi median age:
38.9 years
Average household size:
This zip code:
2.5 people
Mississippi:
2.5 people
Averages for the 2020 tax year for zip code 39320, filed in 2021:
Average Adjusted Gross Income (AGI) in 2020: $69,062 (Individual Income Tax Returns)
Here:
$69,062
State:
$54,084
Salary/wage: $63,032 (reported on 79.7% of returns)
Here:
$63,032
State:
$45,187
(% of AGI for various income ranges: 1158.1% for AGIs below $25k, 3571.7% for AGIs $25k-50k, 6177.1% for AGIs $50k-75k, 9810.0% for AGIs $75k-100k, 15671.1% for AGIs $100k-200k)
Taxable interest for individuals: $663 (reported on 25.7% of returns)
This zip code:
$663
Mississippi:
$1,434
(% of AGI for various income ranges: 14.4% for AGIs below $25k, 6.7% for AGIs $25k-50k, 25.7% for AGIs $50k-75k, 67.8% for AGIs $100k-200k)
Ordinary dividends: $3,731 (reported on 17.6% of returns)
Here:
$3,731
State:
$6,661
(% of AGI for various income ranges: 30.0% for AGIs below $25k, 37.1% for AGIs $50k-75k, 357.8% for AGIs $100k-200k)
Net capital gain/loss in AGI: +$4,755 (reported on 14.9% of returns)
Here:
+$4,755
State:
+$16,833
(% of AGI for various income ranges: 14.4% for AGIs below $25k, 32.9% for AGIs $50k-75k, 530.0% for AGIs $100k-200k)
Profit/loss from business: +$9,200 (reported on 17.6% of returns)
Here:
+$9,200
State:
+$7,724
(% of AGI for various income ranges: 239.4% for AGIs below $25k, 307.1% for AGIs $50k-75k, 664.4% for AGIs $100k-200k)
Taxable individual retirement arrangement distribution: $19,400 (reported on 5.4% of returns)
39320:
$19,400
Mississippi:
$17,717
(% of AGI for various income ranges: 128.8% for AGIs below $25k, 1425.0% for AGIs $75k-100k)
Total itemized deductions: $33,600 (reported on 6.8% of returns)
Here:
$33,600
State:
$34,027
(% of AGI for various income ranges: 1866.7% for AGIs $100k-200k)
Charity contributions: $17,300 (reported on 5.4% of returns)
Here:
$17,300
State:
$14,997
(% of AGI for various income ranges: 768.9% for AGIs $100k-200k)
Taxes paid: $7,560 (reported on 6.8% of returns)
39320:
$7,560
State:
$6,353
(% of AGI for various income ranges: 420.0% for AGIs $100k-200k)
Earned income credit: $2,627 (reported on 14.9% of returns)
Here:
$2,627
State:
$2,689
(% of AGI for various income ranges: 114.4% for AGIs below $25k, 88.3% for AGIs $25k-50k)
Percentage of individuals using paid preparers for their 2020 taxes: 93.2%
Here:
93%
State:
94%
(% for various income ranges: 95.8% for AGIs below $25k, 87.5% for AGIs $25k-50k, 90.0% for AGIs $50k-75k, 100.0% for AGIs $75k-100k, 92.9% for AGIs $100k-200k, 100.0% for AGIs over 200k)
Averages for the 2012 tax year for zip code 39320, filed in 2013:
Average Adjusted Gross Income (AGI) in 2012: $55,905 (Individual Income Tax Returns)
Here:
$55,905
State:
$46,197
Salary/wage: $48,606 (reported on 84.2% of returns)
Here:
$48,606
State:
$38,549
(% of AGI for various income ranges: 74.6% for AGIs below $25k, 78.1% for AGIs $25k-50k, 80.4% for AGIs $50k-75k, 74.7% for AGIs $75k-100k, 68.2% for AGIs $100k-200k)
Taxable interest for individuals: $783 (reported on 23.7% of returns)
This zip code:
$783
Mississippi:
$1,482
(% of AGI for various income ranges: 1.1% for AGIs below $25k, 0.3% for AGIs $25k-50k, 0.5% for AGIs $50k-75k, 0.3% for AGIs $75k-100k, 0.1% for AGIs $100k-200k)
Ordinary dividends: $1,650 (reported on 15.8% of returns)
Here:
$1,650
State:
$5,401
(% of AGI for various income ranges: 1.0% for AGIs below $25k, 1.4% for AGIs $50k-75k, 0.3% for AGIs $75k-100k, 0.3% for AGIs $100k-200k)
Net capital gain/loss in AGI: +$7,522 (reported on 11.8% of returns)
Here:
+$7,522
State:
+$12,121
(% of AGI for various income ranges: 0.5% for AGIs below $25k, 0.8% for AGIs $50k-75k, 3.2% for AGIs $100k-200k)
Profit/loss from business: +$8,215 (reported on 17.1% of returns)
Here:
+$8,215
State:
+$10,220
(% of AGI for various income ranges: 7.0% for AGIs below $25k, 3.3% for AGIs $25k-50k, 0.9% for AGIs $50k-75k, 2.9% for AGIs $100k-200k)
Taxable individual retirement arrangement distribution: $12,500 (reported on 6.6% of returns)
39320:
$12,500
Mississippi:
$13,665
Total itemized deductions: $23,262 (21% of AGI, reported on 27.6% of returns)
Here:
$23,262
State:
$22,078
Here:
20.8% of AGI
State:
21.8% of AGI
(% of AGI for various income ranges: 10.5% for AGIs $25k-50k, 13.3% for AGIs $50k-75k, 9.2% for AGIs $75k-100k, 14.2% for AGIs $100k-200k)
Charity contributions: $6,238 (reported on 21.1% of returns)
Here:
$6,238
State:
$6,081
(% of AGI for various income ranges: 1.4% for AGIs $25k-50k, 2.7% for AGIs $50k-75k, 1.9% for AGIs $75k-100k, 3.1% for AGIs $100k-200k)
Taxes paid: $7,090 (reported on 27.6% of returns)
39320:
$7,090
State:
$5,794
(% of AGI for various income ranges: 1.8% for AGIs $25k-50k, 2.4% for AGIs $50k-75k, 2.4% for AGIs $75k-100k, 5.6% for AGIs $100k-200k)
Earned income credit: $2,193 (reported on 18.4% of returns)
Here:
$2,193
State:
$2,710
(% of AGI for various income ranges: 6.2% for AGIs below $25k, 1.4% for AGIs $25k-50k)
Percentage of individuals using paid preparers for their 2012 taxes: 64.5%
Here:
64%
State:
60%
(% for various income ranges: 55.2% for AGIs below $25k, 64.7% for AGIs $25k-50k, 72.7% for AGIs $50k-75k, 75.0% for AGIs $75k-100k, 72.7% for AGIs $100k-200k)
Averages for the 2004 tax year for zip code 39320, filed in 2005:
Average Adjusted Gross Income (AGI) in 2004: $40,486 (Individual Income Tax Returns)
Here:
$40,486
State:
$36,110
Salary/wage: $36,782 (reported on 86.1% of returns)
Here:
$36,782
State:
$31,757
(% of AGI for various income ranges: 84.1% for AGIs below $10k, 81.8% for AGIs $10k-25k, 81.4% for AGIs $25k-50k, 78.1% for AGIs $50k-75k, 83.5% for AGIs $75k-100k, 68.8% for AGIs over 100k)
Taxable interest for individuals: $891 (reported on 33.5% of returns)
This zip code:
$891
Mississippi:
$1,649
(% of AGI for various income ranges: 1.7% for AGIs below $10k, 1.8% for AGIs $10k-25k, 0.5% for AGIs $25k-50k, 1.1% for AGIs $50k-75k, 0.1% for AGIs $75k-100k, 0.3% for AGIs over 100k)
Taxable dividends: $530 (reported on 18.5% of returns)
Here:
$530
State:
$3,089
(% of AGI for various income ranges: 0.4% for AGIs below $10k, 0.4% for AGIs $10k-25k, 0.4% for AGIs $25k-50k, 0.2% for AGIs $50k-75k, 0.1% for AGIs $75k-100k, 0.1% for AGIs over 100k)
Net capital gain/loss: +$5,464 (reported on 13.6% of returns)
Here:
+$5,464
State:
+$8,427
(% of AGI for various income ranges: 1.5% for AGIs $10k-25k, -0.0% for AGIs $25k-50k, 0.4% for AGIs $50k-75k, -0.2% for AGIs $75k-100k, 7.4% for AGIs over 100k)
Profit/loss from business: +$6,670 (reported on 15.3% of returns)
Here:
+$6,670
State:
+$8,818
(% of AGI for various income ranges: 10.2% for AGIs below $10k, 5.4% for AGIs $10k-25k, 2.8% for AGIs $25k-50k, 2.1% for AGIs $50k-75k, 3.3% for AGIs $75k-100k)
Total itemized deductions: $17,000 (23% of AGI, reported on 26.5% of returns)
Here:
$17,000
State:
$17,896
Here:
22.6% of AGI
State:
22.5% of AGI
(% of AGI for various income ranges: 5.9% for AGIs $10k-25k, 11.4% for AGIs $25k-50k, 10.7% for AGIs $50k-75k, 11.5% for AGIs $75k-100k, 14.8% for AGIs over 100k)
Charity contributions deductions: $4,491 (6% of AGI, reported on 23.1% of returns)
Here:
$4,491
State:
$4,735
Here:
6.3% of AGI
State:
5.7% of AGI
(% of AGI for various income ranges: 1.6% for AGIs $10k-25k, 2.8% for AGIs $25k-50k, 2.5% for AGIs $50k-75k, 2.5% for AGIs $75k-100k, 3.2% for AGIs over 100k)
Total tax: $5,320 (reported on 72.5% of returns)
39320:
$5,320
State:
$5,562
(% of AGI for various income ranges: 2.7% for AGIs below $10k, 3.5% for AGIs $10k-25k, 5.1% for AGIs $25k-50k, 9.0% for AGIs $50k-75k, 10.5% for AGIs $75k-100k, 18.3% for AGIs over 100k)
Earned income credit: $1,832 (reported on 20.0% of returns)
Here:
$1,832
State:
$2,107
Percentage of individuals using paid preparers for their 2004 taxes: 66.4%
Here:
66%
State:
65%
(% for various income ranges: 60.0% for AGIs below $10k, 68.6% for AGIs $10k-25k, 64.1% for AGIs $25k-50k, 68.5% for AGIs $50k-75k, 72.0% for AGIs $75k-100k, 73.5% for AGIs over 100k)
Household received Food Stamps/SNAP in the past 12 months: 0 Household did not receive Food Stamps/SNAP in the past 12 months: 604
Women who did not have a birth in the past 12 months: 216 (92 now married, 123 unmarried)
Housing units in zip code 39320 with a mortgage: 218 (38 second mortgage, 39 both second mortgage and home equity loan) Median monthly owner costs for units with a mortgage: $1,535 Median monthly owner costs for units without a mortgage: $327
Residents with income below the poverty level in 2022:
This zip code:
5.2%
Whole state:
19.1%
Residents with income below 50% of the poverty level in 2022:
This zip code:
5.2%
Whole state:
10.3%
Median number of rooms in houses and condos:
Here:
7.2
State:
6.3
Median number of rooms in apartments:
Here:
5.7
State:
4.8
Notable locations in this zip code not listed on our city pages
Churches in zip code 39320 include: Pleasant Grove Church (A), Arkadelphia Church (B), Bailey Church (C), Bethel Church (D), Union Baptist Church (E), Ebenezer Church (F), Frazier Grove Church (G), Gum Log Baptist Church (H), Hopewell Church (I). Display/hide their locations on the map
Cemeteries: Union Cemetery (1), Klondike Cemetery (2), Mount Carmel Cemetery (3), Gum Log Cemetery (4), Arkadelphia Cemetery (5). Display/hide their locations on the map
Tourist attractions (not listed on the city page) : Okatibbee Lake - Wildlife Management Area (Recreation Areas; Centerhill Martin Road) (1), Meridian Coach and Travel Inc (Tours & Charters; 9720 Robinson Thomas Road) (2). Display/hide their approximate locations on the map
Size of family households: 200 2-persons, 132 3-persons, 65 4-persons, 17 7-or-more-persons
Size of nonfamily households: 188 1-person
125 married couples with children.
145 single-parent households (145 women).
97.7% of residents of 39320 zip code speak English at home.
2.2% of residents speak Spanish at home (100% very well).
Foreign born population: 0 (0.0%)
:
0.0%
Whole state:
2.2%
26%American
26%English
12%Welsh
5%Irish
5%British
5%African
3%European
Year of entry for the foreign-born population
02010 or later
02000 to 2009
01990 to 1999
10Before 1990
Facilities with environmental interests located in this zip code:
CHARLES LEAGER MOBILE HOME PARK (GRISSOM ROAD in BAILEY, MS)
STATE MASTER (Mississippi compliance, permits, activity tracking ) - ENSITE-MS0057843, National Pollutant Discharge Elimination System Permit National Pollutant Discharge Elimination System NON-MAJOR (Tracking pollutant discharge elimination systems) - permit Business SIC classification: SEWERAGE SYSTEMS Alternative names: CHARLES LEAGER MOBILE HOME PK, LAUDERDALE COUNTY
Housing units lacking complete plumbing facilities: 11.8% Housing units lacking complete kitchen facilities: 4.5%
80.7%Electricity
18.0%Bottled, tank, or LP gas
1.5%Wood
Population in 1990: 2,495.
Place of birth for U.S.-born residents:
This state: 1,076
Northeast: 111
Midwest: 25
South: 296
West: 12
75% of the 39320 zip code residents lived in the same house 5 years ago. Out of people who lived in different houses, 88% lived in this county. Out of people who lived in different counties, 50% lived in Mississippi.
95% of the 39320 zip code residents lived in the same house 1 year ago. Out of people who lived in different houses, 111% moved from different state.
Private vs. public school enrollment:
Students in private schools in grades 1 to 8 (elementary and middle school):
Here:
0.0%
Mississippi:
16.1%
Students in private schools in grades 9 to 12 (high school):
Here:
0.0%
Mississippi:
14.6%
Students in private undergraduate colleges:
Here:
0.0%
Mississippi:
12.8%
Occupation by median earnings in the past 12 months ($)
138,029Health diagnosing and treating practitioners and other technical occupations
73,761Management occupations
28,633Installation, maintenance, and repair occupations
21,382Office and administrative support occupations
Top industries in this zip code by the number of employees in 2005:
Utilities: Water Supply and Irrigation Systems (10-19 employees: 1 establishment)
Other Services (except Public Administration): Religious Organizations (1-4: 4)
Construction: Poured Concrete Foundation and Structure Contractors (5-9: 1)
Construction: Plumbing, Heating, and Air-Conditioning Contractors (1-4: 3)
Real Estate and Rental and Leasing: Lessors of Residential Buildings and Dwellings (1-4: 1)
Administrative and Support and Waste Management and Remediation Services: Landscaping Services (1-4: 1)
Professional, Scientific, and Technical Services: Tax Preparation Services (1-4: 1)
Wholesale Trade: Poultry and Poultry Product Merchant Wholesalers (1-4: 1)
Construction: Commercial and Institutional Building Construction (1-4: 1)
Fatal accident statistics in 2014:
Fatal accident count: 1
Vehicles involved in fatal accidents: 2
Fatal accidents caused by drunken drivers: 0
Fatalities: 1
Persons involved in fatal accidents: 6
Pedestrians involved in fatal accidents: 0
Fatal accident statistics in 2013:
Fatal accident count: 1
Vehicles involved in fatal accidents: 1
Fatal accidents caused by drunken drivers: 0
Fatalities: 1
Persons involved in fatal accidents: 1
Pedestrians involved in fatal accidents: 0
2003 - 2018 National Fire Incident Reporting System (NFIRS) incidents
According to the data from the years 2003 - 2018 the average number of fire incidents per year is 9. The highest number of fire incidents - 19 took place in 2014, and the least - 4 in 2003. The data has a constant trend.
When looking into fire subcategories, the most reports belonged to: Structure Fires (47.6%), and Outside Fires (44.8%).
Fire incident types reported to NFIRS in Zip Code 39320

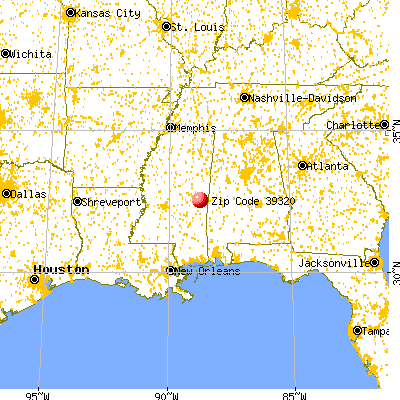


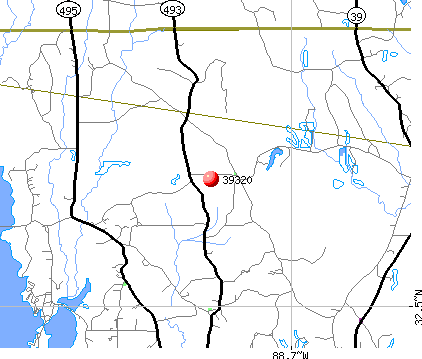 Nearest zip codes: 39326, 39305, 39309, 39325, 39342, 39328.


 According to the data from the years 2003 - 2018 the average number of fire incidents per year is 9. The highest number of fire incidents - 19 took place in 2014, and the least - 4 in 2003. The data has a constant trend.
 When looking into fire subcategories, the most reports belonged to: Structure Fires (47.6%), and Outside Fires (44.8%).