Estimated zip code population in 2022: 9,137 Zip code population in 2010: 8,828 Zip code population in 2000: 6,791
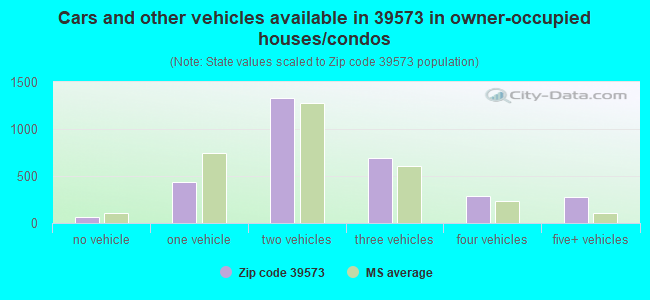
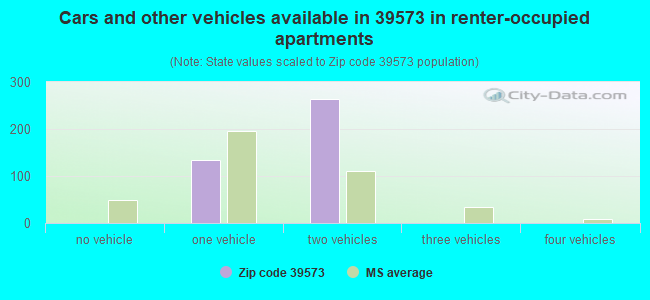
Houses and condos: 3,760 Renter-occupied apartments: 401
% of renters here:
12%
State:
30%
March 2022 cost of living index in zip code 39573: 78.0 (low, U.S. average is 100)
Land area: 397.0 sq. mi. Water area: 3.1 sq. mi.
Population density: 23 people per square mile
(very low).
OSM Map
General Map
Google Map
MSN Map
OSM Map
General Map
Google Map
MSN Map
OSM Map
General Map
Google Map
MSN Map
OSM Map
General Map
Google Map
MSN Map
Please wait while loading the map...
Real estate property taxes paid for housing units in 2022:
This zip code:
0.5% ($1,068)
Mississippi:
0.7% ($1,161)
Median real estate property taxes paid for housing units with mortgages in 2022: $1,206 (0.5%) Median real estate property taxes paid for housing units with no mortgage in 2022: $794 (0.6%)
Business Search- 14 Million verified businesses
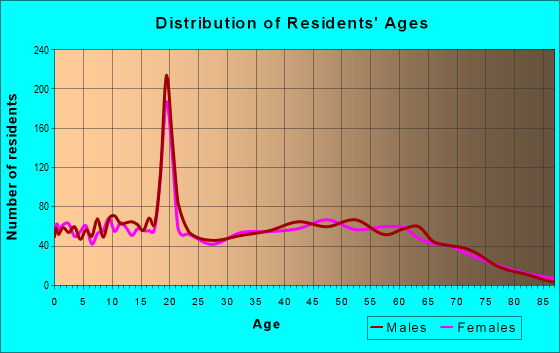
Males: 4,561
(49.9%)
Females: 4,575
(50.1%)
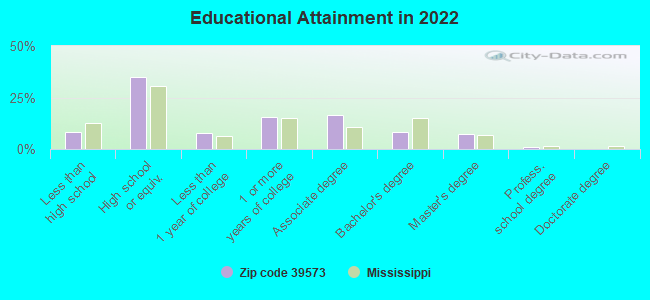
For population 25 years and over in 39573:
High school or higher: 92.3%
Bachelor's degree or higher: 16.6%
Graduate or professional degree: 8.4%
Unemployed: 10.8%
Mean travel time to work (commute): 34.5 minutes
For population 15 years and over in 39573:
Never married: 21.7%
Now married: 61.1%
Separated: 0.6%
Widowed: 3.1%
Divorced: 13.5%
Zip code 39573 compared to state average:
Unemployed percentage above state average.
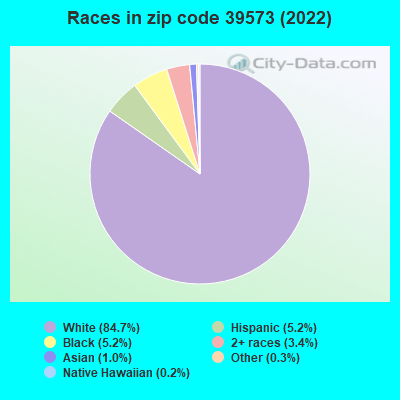
Black race population percentage significantly below state average.
Median age above state average.
Foreign-born population percentage significantly below state average.
Renting percentage significantly below state average.
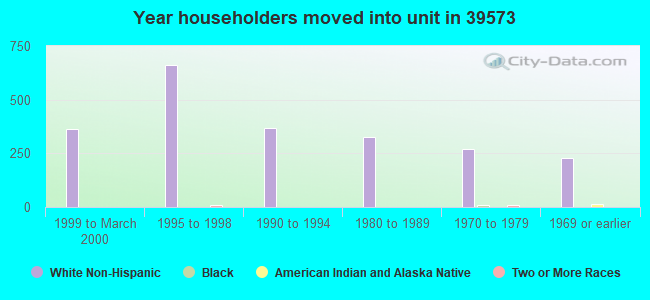
Length of stay since moving in above state average.
House age below state average.
Percentage of population with a bachelor's degree or higher below state average.
Estimated median house/condo value in 2022: $204,793
39573:
$204,793
Mississippi:
$162,500
According to our research of Mississippi and other state lists, there were 22 registered sex offenders living in 39573 zip code as of May 28, 2024. The ratio of all residents to sex offenders in zip code 39573 is 373 to 1. The ratio of registered sex offenders to all residents in this zip code is near the state average.
Median resident age:
This zip code:
43.8 years
Mississippi median age:
38.9 years
Average household size:
This zip code:
2.6 people
Mississippi:
2.5 people
Averages for the 2020 tax year for zip code 39573, filed in 2021:
Average Adjusted Gross Income (AGI) in 2020: $54,767 (Individual Income Tax Returns)
Here:
$54,767
State:
$54,084
Salary/wage: $50,193 (reported on 80.4% of returns)
Here:
$50,193
State:
$45,187
(% of AGI for various income ranges: 1085.7% for AGIs below $25k, 3691.1% for AGIs $25k-50k, 6662.2% for AGIs $50k-75k, 10311.2% for AGIs $75k-100k, 15285.0% for AGIs $100k-200k)
Taxable interest for individuals: $992 (reported on 25.6% of returns)
This zip code:
$992
Mississippi:
$1,434
(% of AGI for various income ranges: 15.9% for AGIs below $25k, 18.8% for AGIs $25k-50k, 31.2% for AGIs $50k-75k, 55.0% for AGIs $75k-100k, 78.7% for AGIs $100k-200k)
Ordinary dividends: $3,526 (reported on 8.8% of returns)
Here:
$3,526
State:
$6,661
(% of AGI for various income ranges: 7.9% for AGIs below $25k, 15.1% for AGIs $25k-50k, 36.0% for AGIs $50k-75k, 32.5% for AGIs $75k-100k, 145.0% for AGIs $100k-200k)
Net capital gain/loss in AGI: +$7,277 (reported on 8.5% of returns)
Here:
+$7,277
State:
+$16,833
(% of AGI for various income ranges: 8.0% for AGIs below $25k, 14.2% for AGIs $25k-50k, 42.5% for AGIs $50k-75k, 109.2% for AGIs $75k-100k, 183.0% for AGIs $100k-200k)
Profit/loss from business: +$7,708 (reported on 18.2% of returns)
Here:
+$7,708
State:
+$7,724
(% of AGI for various income ranges: 163.3% for AGIs below $25k, 166.8% for AGIs $25k-50k, 89.0% for AGIs $50k-75k, 225.8% for AGIs $75k-100k, 461.0% for AGIs $100k-200k)
Taxable individual retirement arrangement distribution: $19,059 (reported on 6.2% of returns)
39573:
$19,059
Mississippi:
$17,717
(% of AGI for various income ranges: 35.6% for AGIs below $25k, 65.7% for AGIs $25k-50k, 98.0% for AGIs $50k-75k, 278.8% for AGIs $75k-100k, 787.7% for AGIs $100k-200k)
Total itemized deductions: $32,236 (reported on 4.0% of returns)
Here:
$32,236
State:
$34,027
(% of AGI for various income ranges: 173.8% for AGIs $25k-50k, 350.4% for AGIs $75k-100k, 847.3% for AGIs $100k-200k)
Charity contributions: $9,878 (reported on 2.6% of returns)
Here:
$9,878
State:
$14,997
(% of AGI for various income ranges: 47.2% for AGIs $50k-75k, 233.3% for AGIs $100k-200k)
Taxes paid: $5,773 (reported on 3.1% of returns)
39573:
$5,773
State:
$6,353
(% of AGI for various income ranges: 45.0% for AGIs $50k-75k, 151.7% for AGIs $100k-200k)
Earned income credit: $2,513 (reported on 21.6% of returns)
Here:
$2,513
State:
$2,689
(% of AGI for various income ranges: 129.7% for AGIs below $25k, 100.3% for AGIs $25k-50k, 3.2% for AGIs $50k-75k)
Percentage of individuals using paid preparers for their 2020 taxes: 92.9%
Here:
93%
State:
94%
(% for various income ranges: 93.6% for AGIs below $25k, 92.9% for AGIs $25k-50k, 92.6% for AGIs $50k-75k, 89.2% for AGIs $75k-100k, 93.3% for AGIs $100k-200k, 100.0% for AGIs over 200k)
Averages for the 2012 tax year for zip code 39573, filed in 2013:
Average Adjusted Gross Income (AGI) in 2012: $45,281 (Individual Income Tax Returns)
Here:
$45,281
State:
$46,197
Salary/wage: $42,370 (reported on 81.7% of returns)
Here:
$42,370
State:
$38,549
(% of AGI for various income ranges: 71.3% for AGIs below $25k, 80.8% for AGIs $25k-50k, 82.1% for AGIs $50k-75k, 81.2% for AGIs $75k-100k, 77.2% for AGIs $100k-200k, 43.7% for AGIs over 200k)
Taxable interest for individuals: $1,080 (reported on 26.6% of returns)
This zip code:
$1,080
Mississippi:
$1,482
(% of AGI for various income ranges: 1.3% for AGIs below $25k, 0.6% for AGIs $25k-50k, 0.6% for AGIs $50k-75k, 0.2% for AGIs $75k-100k, 0.8% for AGIs $100k-200k)
Ordinary dividends: $2,353 (reported on 9.3% of returns)
Here:
$2,353
State:
$5,401
(% of AGI for various income ranges: 0.5% for AGIs below $25k, 0.4% for AGIs $25k-50k, 0.2% for AGIs $50k-75k, 0.1% for AGIs $75k-100k, 1.1% for AGIs $100k-200k)
Net capital gain/loss in AGI: +$5,152 (reported on 6.5% of returns)
Here:
+$5,152
State:
+$12,121
(% of AGI for various income ranges: 0.2% for AGIs $50k-75k, 1.0% for AGIs $75k-100k, 2.2% for AGIs $100k-200k)
Profit/loss from business: +$7,455 (reported on 20.1% of returns)
Here:
+$7,455
State:
+$10,220
(% of AGI for various income ranges: 12.6% for AGIs below $25k, 3.0% for AGIs $25k-50k, 1.1% for AGIs $50k-75k, 1.8% for AGIs $75k-100k, 2.9% for AGIs $100k-200k)
Taxable individual retirement arrangement distribution: $16,300 (reported on 5.6% of returns)
39573:
$16,300
Mississippi:
$13,665
(% of AGI for various income ranges: 1.3% for AGIs below $25k, 1.4% for AGIs $25k-50k, 1.6% for AGIs $50k-75k, 2.3% for AGIs $75k-100k, 3.5% for AGIs $100k-200k)
Total itemized deductions: $19,633 (23% of AGI, reported on 23.2% of returns)
Here:
$19,633
State:
$22,078
Here:
22.9% of AGI
State:
21.8% of AGI
(% of AGI for various income ranges: 6.7% for AGIs below $25k, 8.2% for AGIs $25k-50k, 9.5% for AGIs $50k-75k, 12.1% for AGIs $75k-100k, 12.8% for AGIs $100k-200k, 8.1% for AGIs over 200k)
Charity contributions: $3,985 (reported on 18.6% of returns)
Here:
$3,985
State:
$6,081
(% of AGI for various income ranges: 0.6% for AGIs below $25k, 1.1% for AGIs $25k-50k, 1.7% for AGIs $50k-75k, 2.1% for AGIs $75k-100k, 2.4% for AGIs $100k-200k, 0.9% for AGIs over 200k)
Taxes paid: $4,883 (reported on 23.2% of returns)
39573:
$4,883
State:
$5,794
(% of AGI for various income ranges: 1.0% for AGIs below $25k, 1.2% for AGIs $25k-50k, 1.9% for AGIs $50k-75k, 2.8% for AGIs $75k-100k, 3.9% for AGIs $100k-200k, 5.0% for AGIs over 200k)
Earned income credit: $2,391 (reported on 24.8% of returns)
Here:
$2,391
State:
$2,710
(% of AGI for various income ranges: 8.6% for AGIs below $25k, 1.4% for AGIs $25k-50k)
Percentage of individuals using paid preparers for their 2012 taxes: 61.9%
Here:
62%
State:
60%
(% for various income ranges: 59.9% for AGIs below $25k, 62.8% for AGIs $25k-50k, 61.7% for AGIs $50k-75k, 63.3% for AGIs $75k-100k, 64.3% for AGIs $100k-200k, 100.0% for AGIs over 200k)
Averages for the 2004 tax year for zip code 39573, filed in 2005:
Average Adjusted Gross Income (AGI) in 2004: $33,179 (Individual Income Tax Returns)
Here:
$33,179
State:
$36,110
Salary/wage: $31,948 (reported on 83.9% of returns)
Here:
$31,948
State:
$31,757
(% of AGI for various income ranges: 139.9% for AGIs below $10k, 73.7% for AGIs $10k-25k, 84.8% for AGIs $25k-50k, 83.0% for AGIs $50k-75k, 83.4% for AGIs $75k-100k, 66.1% for AGIs over 100k)
Taxable interest for individuals: $1,331 (reported on 35.1% of returns)
This zip code:
$1,331
Mississippi:
$1,649
(% of AGI for various income ranges: 4.4% for AGIs below $10k, 2.4% for AGIs $10k-25k, 1.0% for AGIs $25k-50k, 1.2% for AGIs $50k-75k, 0.9% for AGIs $75k-100k, 1.8% for AGIs over 100k)
Taxable dividends: $1,508 (reported on 10.6% of returns)
Here:
$1,508
State:
$3,089
(% of AGI for various income ranges: 0.8% for AGIs below $10k, 0.4% for AGIs $10k-25k, 0.3% for AGIs $25k-50k, 0.3% for AGIs $50k-75k, 0.3% for AGIs $75k-100k, 1.4% for AGIs over 100k)
Net capital gain/loss: +$2,363 (reported on 8.5% of returns)
Here:
+$2,363
State:
+$8,427
(% of AGI for various income ranges: 4.4% for AGIs below $10k, 0.5% for AGIs $10k-25k, 0.0% for AGIs $25k-50k, 0.8% for AGIs $50k-75k, 0.1% for AGIs $75k-100k, 1.7% for AGIs over 100k)
Profit/loss from business: +$7,184 (reported on 19.4% of returns)
Here:
+$7,184
State:
+$8,818
(% of AGI for various income ranges: 6.0% for AGIs below $10k, 10.4% for AGIs $10k-25k, 2.6% for AGIs $25k-50k, 3.5% for AGIs $50k-75k, 2.6% for AGIs $75k-100k, 3.6% for AGIs over 100k)
IRA payment deduction: $2,604 (reported on 1.9% of returns)
39573:
$2,604
Mississippi:
$3,024
Total itemized deductions: $15,656 (26% of AGI, reported on 21.8% of returns)
Here:
$15,656
State:
$17,896
Here:
25.9% of AGI
State:
22.5% of AGI
(% of AGI for various income ranges: 7.8% for AGIs $10k-25k, 10.4% for AGIs $25k-50k, 10.8% for AGIs $50k-75k, 11.7% for AGIs $75k-100k, 11.7% for AGIs over 100k)
Charity contributions deductions: $3,077 (5% of AGI, reported on 18.9% of returns)
Here:
$3,077
State:
$4,735
Here:
5.1% of AGI
State:
5.7% of AGI
(% of AGI for various income ranges: 1.0% for AGIs $10k-25k, 1.8% for AGIs $25k-50k, 1.9% for AGIs $50k-75k, 2.3% for AGIs $75k-100k, 1.9% for AGIs over 100k)
Total tax: $3,909 (reported on 70.0% of returns)
39573:
$3,909
State:
$5,562
(% of AGI for various income ranges: 6.5% for AGIs below $10k, 4.0% for AGIs $10k-25k, 5.5% for AGIs $25k-50k, 7.9% for AGIs $50k-75k, 10.7% for AGIs $75k-100k, 17.3% for AGIs over 100k)
Earned income credit: $1,834 (reported on 25.0% of returns)
Here:
$1,834
State:
$2,107
Percentage of individuals using paid preparers for their 2004 taxes: 65.5%
Here:
66%
State:
65%
(% for various income ranges: 55.6% for AGIs below $10k, 66.8% for AGIs $10k-25k, 70.6% for AGIs $25k-50k, 66.7% for AGIs $50k-75k, 63.8% for AGIs $75k-100k, 68.8% for AGIs over 100k)
Likely homosexual households (counted as self-reported same-sex unmarried-partner households)
Lesbian couples: 0.3% of all households
Gay men: 0.0% of all households
Household received Food Stamps/SNAP in the past 12 months: 118 Household did not receive Food Stamps/SNAP in the past 12 months: 3,323
Women who had a birth in the past 12 months: 121 (87 now married, 34 unmarried) Women who did not have a birth in the past 12 months: 1,994 (910 now married, 1,082 unmarried)
Housing units in zip code 39573 with a mortgage: 1,815 (116 second mortgage, 29 both second mortgage and home equity loan) Houses without a mortgage: 43
Median monthly owner costs for units with a mortgage: $1,464 Median monthly owner costs for units without a mortgage: $378
Residents with income below the poverty level in 2022:
This zip code:
11.9%
Whole state:
19.1%
Residents with income below 50% of the poverty level in 2022:
This zip code:
7.5%
Whole state:
10.3%
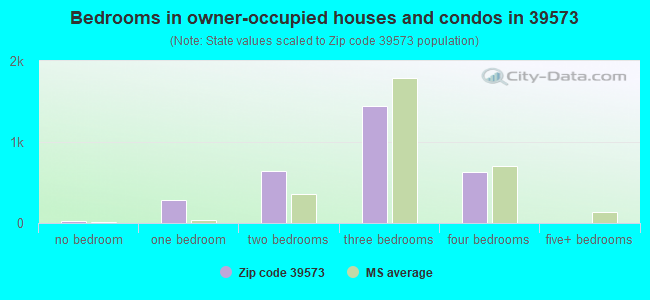
Median number of rooms in houses and condos:
Here:
6.2
State:
6.3
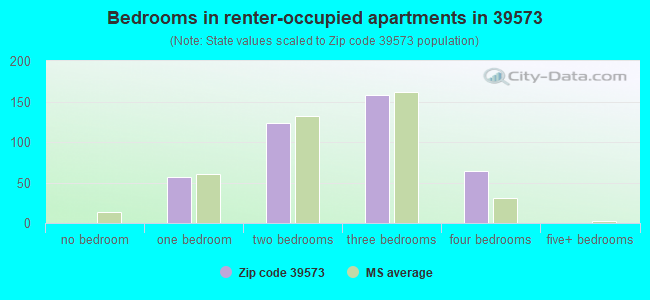
Median number of rooms in apartments:
Here:
4.6
State:
4.8
Notable locations in this zip code not listed on our city pages
Notable locations in zip code 39573: Scenic Trails Campground (A), Salmen Scout Reservation (B), Bigfork Trail Riders Campground (C), Airey Work Center (D), Black Creek Landing Boat Ramp (E), Salmon Boy Scout Camp (F), Ramsey Springs Boat Ramp (G), Red Creek Landing Boat Ramp (H), Red Creek Boat Ramp (I), Mississippi Gulf Coast Community College Perkinston Campus A L May Memorial Stadium (J), Broome Community Center (K), Post 58 Volunteer Fire Department Station 2 (L), Broome Volunteer Fire Department (M), Magnolia Volunteer Fire Department (N), Perkinston Volunteer Fire Department (O), Big Level Volunteer Fire Department (P), Silver Run Volunteer Fire Department (Q), Ramsey Springs Volunteer Fire Department (R), McHenry Volunteer Fire Department Sunflower Substation (S). Display/hide their locations on the map
Churches in zip code 39573 include: Pine Grove Church (A), Shiloh Church (B), Sweet Beulah Church (C), White Cypress Church (D), Pine Bluff Church (E), Crane Creek Church (F), Tuxechena Church (G), Liberty Hill Church (H), Calvary Faithway Missionary Church (I). Display/hide their locations on the map
Cemeteries: Hester Cemetery (1), Sumrall Cemetery (2), Flurry Cemetery (3), Cain Cemetery (4), Flurry Cemetery (5), Davis Cemetery (6), Ramsey Cemetery (7). Display/hide their locations on the map
Lakes, reservoirs, and swamps: Ferrell Dead River (A), Bilbo Dead River (B), Sand Ridge Lake (C), Beaver Pond (D), Lingum Lake (E), Blue Lake (F), Goff Dead River (G), Woodard Dead River (H). Display/hide their locations on the map
Streams, rivers, and creeks: Ball Hill Reed Brake (A), Coppermill Creek (B), Walker Branch (C), Sweetwater Creek (D), Tenmile Creek (E), Abbot Branch (F), Andrew Branch (G), Beaver Dam Branch (H), Beetree Branch (I). Display/hide their locations on the map
Parks in zip code 39573 include: Red Creek State Wildlife Management Area (1), Bigfoot Trail Camp Recreation Area (2), Airey Lake Recreation Area (3), Pascagoula River State Wildlife Management Area (4). Display/hide their locations on the map
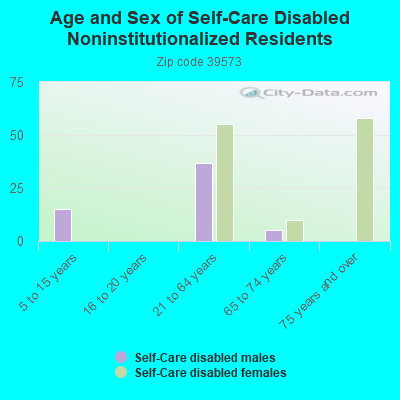
In group quarters: 170 (-1 institutionalized population)
Size of family households: 1,072 2-persons, 707 3-persons, 295 4-persons, 407 5-persons, 59 6-persons, 88 7-or-more-persons
Size of nonfamily households: 612 1-person, 191 2-persons
1,618 married couples with children.
124 single-parent households (73 men, 51 women).
96.8% of residents of 39573 zip code speak English at home.
2.3% of residents speak Spanish at home (95% very well, 5% well).
0.2% of residents speak other Indo-European language at home (100% well).
0.7% of residents speak Asian or Pacific Island language at home (25% very well, 25% well, 50% not well).
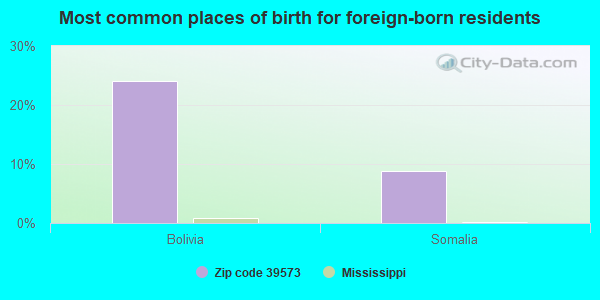
Foreign born population: 70 (0.8%) (91.5% of them are naturalized citizens)
This zip code:
0.8%
Whole state:
2.2%
24%Bolivia
9%Somalia
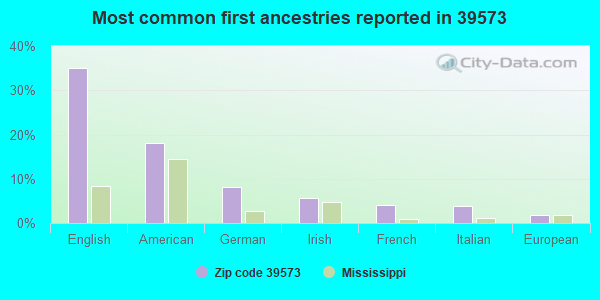
35%English
18%American
8%German
6%Irish
4%French
4%Italian
2%European
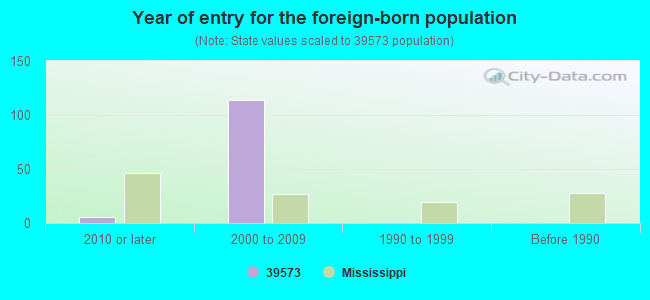
Year of entry for the foreign-born population
62010 or later
1142000 to 2009
01990 to 1999
0Before 1990
Facilities with environmental interests located in this zip code:
MISSISSIPPI GULF COAST COMMUNITY COLLEGE (51 MAIN STREET in PERKINSTON, MS)
STATE MASTER (Mississippi compliance, permits, activity tracking ) - ENSITE-MS0022764, National Pollutant Discharge Elimination System Permit National Pollutant Discharge Elimination System NON-MAJOR (Tracking pollutant discharge elimination systems) - permit COMMUNITY WATER SYSTEM (SDWIS) - SDWIS-MS0660003 10102, WATER TREATMENT PLANT Business SIC classification: COLLEGES, UNIVERSITIES, AND PROFESSIONAL SCHOOLS; JUNIOR COLLEGES AND TECHNICAL INSTITUTES Alternative names: MS GULF COAST JR COLLEGE, MS GULF COAST JUNIOR COLLEGE, MISSISSIPPI GULF COAST JUNIOR COLLEGE PERKINSTON CAMPUS, STONE COUNTY
CAR WASH, THE (5021 NECAISE CEASAR ROAD in PERKINSTON, MS)
STATE MASTER (Mississippi compliance, permits, activity tracking ) - ENSITE-MSU099160, WASTEWATER FACILITY National Pollutant Discharge Elimination System NON-MAJOR (Tracking pollutant discharge elimination systems) - permit Business SIC classification: CARWASHES Alternative names: HANCOCK COUNTY, WASHTOWN CAR WASH (3-BAY)
COVENANT CHILD DEVELOPMENT CENTER (450 SUNFLOWER ROAD in PERKINSTON, MS)
STATE MASTER (Mississippi compliance, permits, activity tracking ) - ENSITE-MSU097081, WASTEWATER FACILITY National Pollutant Discharge Elimination System NON-MAJOR (Tracking pollutant discharge elimination systems) - permit Business SIC classification: CHILD DAY CARE SERVICES Alternative names: COVENANT CHILD CARE INC, DOVENANT CHILD CARE INC
GAIL VARNADO, PERK BEACH RV PARK (1616 HIGHWAY 49 in PERKINSTON, MS)
STATE MASTER (Mississippi compliance, permits, activity tracking ) - ENSITE-MSU090042, WASTEWATER FACILITY National Pollutant Discharge Elimination System NON-MAJOR (Tracking pollutant discharge elimination systems) - permit Business SIC classification: RECREATIONAL VEHICLE PARKS AND CAMPSITES Alternative names: GAIL VERNADO PERK BEACH RV PARK, WASHINGTON COUNTY
HOLLIS AND AUDIE SPIERS, DAIRY (1102 ROAD 330 in SELLERS, MS)
STATE MASTER (Mississippi compliance, permits, activity tracking ) - ENSITE-MSU020123, WASTEWATER FACILITY National Pollutant Discharge Elimination System NON-MAJOR (Tracking pollutant discharge elimination systems) - permit Business SIC classification: DAIRY FARMS Alternative names: HANCOCK
HOWARD PARKER, SWINE WASTE DISPOSAL SYSTEM (HIGHWAY 49 in PERKINSTON, MS)
STATE MASTER (Mississippi compliance, permits, activity tracking ) - ENSITE-MSU003322, WASTEWATER FACILITY National Pollutant Discharge Elimination System NON-MAJOR (Tracking pollutant discharge elimination systems) - permit Business SIC classification: HOGS Alternative names: HOWARD PARKER SWINE
JASON SHAW, DAIRY (31271 CRANE CREEK ROAD in PERKINSTON, MS)
STATE MASTER (Mississippi compliance, permits, activity tracking ) - ENSITE-MSU040025, WASTEWATER FACILITY National Pollutant Discharge Elimination System NON-MAJOR (Tracking pollutant discharge elimination systems) - permit Business SIC classification: DAIRY FARMS Alternative names: HANCOCK
Housing units lacking complete plumbing facilities: 4.3% Housing units lacking complete kitchen facilities: 1.2%
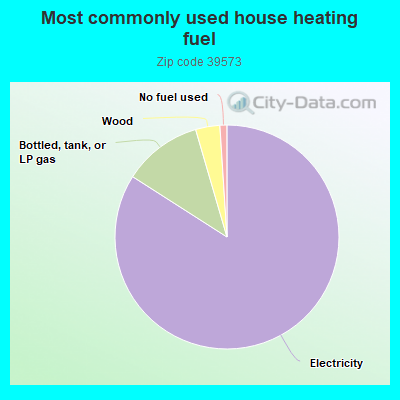
83.9%Electricity
11.4%Bottled, tank, or LP gas
3.5%Wood
1.0%No fuel used
Population in 1990: 3,743. Population change in the 1990s: +3,048 (+81.4%).
Place of birth for U.S.-born residents:
This state: 6,674
Northeast: 373
Midwest: 215
South: 1,417
West: 364
63% of the 39573 zip code residents lived in the same house 5 years ago. Out of people who lived in different houses, 36% lived in this county. Out of people who lived in different counties, 50% lived in Mississippi.
94% of the 39573 zip code residents lived in the same house 1 year ago. Out of people who lived in different houses, 1% moved from this county. Out of people who lived in different houses, 98% moved from different county within same state. Out of people who lived in different houses, 0% moved from different state.
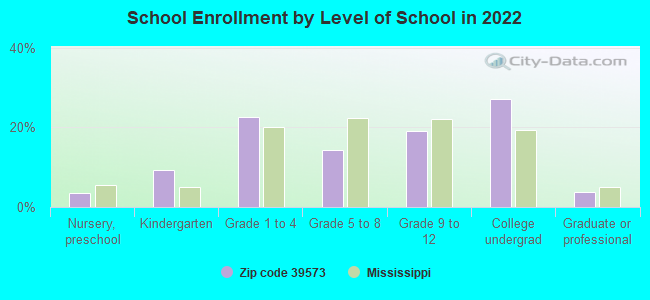
Private vs. public school enrollment:
Students in private schools in grades 1 to 8 (elementary and middle school): 142
Here:
17.3%
Mississippi:
16.1%
Students in private schools in grades 9 to 12 (high school): 6
Here:
1.5%
Mississippi:
14.6%
Students in private undergraduate colleges: 65
Here:
10.7%
Mississippi:
12.8%
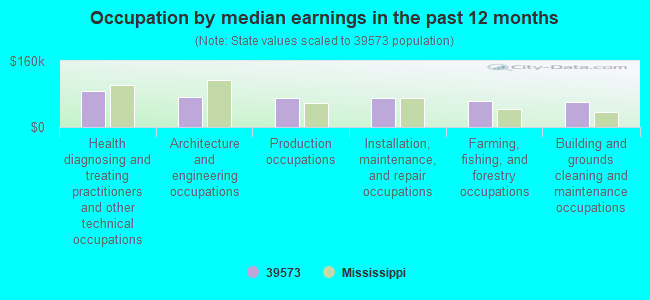
Occupation by median earnings in the past 12 months ($)
88,226Health diagnosing and treating practitioners and other technical occupations
73,757Architecture and engineering occupations
71,049Production occupations
70,690Installation, maintenance, and repair occupations
62,248Farming, fishing, and forestry occupations
61,741Building and grounds cleaning and maintenance occupations
Companies with federal contracts located in this zip code:
REDMOND CONSTRUCTION CO (1869 E MCKINLEY RD in PERKINSTON, MS; small business) : $243,500 in 11 contractsfrom 2000 to 2002
Contracts for Forest Tree Planting Services, Site Preparation, Other Wildlife Management Services by Forest Service (disused code: now 12C2), Forest Service Signed by year:2000: $157,514; 2001: $82,986; 2002: $3,000; 2003: $0; 2004: $0; 2005: $0; 2006: $0.
Biggest contracts:
$81,000 with Forest Service (disused code: now 12C2) for Forest Tree Planting Services. Signed on 2000-04-15. Completion date: 2000-07-15.
$64,969 with Forest Service for Forest Tree Planting Services. Signed on 2000-08-15. Completion date: 2000-09-15.
$21,489, same as above.Signed on 2001-08-15. Completion date: 2001-09-15.
$21,000 with Forest Service (disused code: now 12C2) for Forest Tree Planting Services. Signed on 2001-08-15. Completion date: 2001-09-15.
CLEARWATER POOL COMPANY INC (19425 BELL CREEK RD in PERKINSTON, MS; small business) : $11,000 in 2 contractsfrom 2005 to 2006
$6,000 with Army for Maintenance, Repair and Rebuilding of Equipment -- Recreational and Athletic Equipment. Signed on 2005-10-01. Completion date: 2006-09-30.
$5,000, same as above.Signed on 2006-02-15. Completion date: 2006-09-30.
Top industries in this zip code by the number of employees in 2005:
Construction: Other Foundation, Structure, and Building Exterior Contractors (50-99 employees: 1 establishment)
Accommodation and Food Services: Food Service Contractors (20-49: 1)
Construction: All Other Specialty Trade Contractors (10-19: 1, 1-4: 1)
Construction: Highway, Street, and Bridge Construction (5-9: 1, 1-4: 2)
Other Services (except Public Administration): Religious Organizations (5-9: 1, 1-4: 1)
Finance and Insurance: Credit Unions (5-9: 1)
Accommodation and Food Services: Full-Service Restaurants (5-9: 1)
People in group quarters in 2010:
712 people in college/university student housing
15 people in workers' group living quarters and job corps centers
People in group quarters in 2000:
502 people in college dormitories (includes college quarters off campus)
9 people in agriculture workers' dormitories on farms
Fatal accident statistics in 2014:
Fatal accident count: 1
Vehicles involved in fatal accidents: 1
Fatal accidents caused by drunken drivers: 1
Fatalities: 1
Persons involved in fatal accidents: 1
Pedestrians involved in fatal accidents: 0
Fatal accident statistics in 2013:
Fatal accident count: 2
Vehicles involved in fatal accidents: 2
Fatal accidents caused by drunken drivers: 1
Fatalities: 2
Persons involved in fatal accidents: 2
Pedestrians involved in fatal accidents: 1
Home Mortgage Disclosure Act Aggregated Statistics For Year 2009 (Based on 6 partial tracts)
A) FHA, FSA/RHS & VA Home Purchase Loans
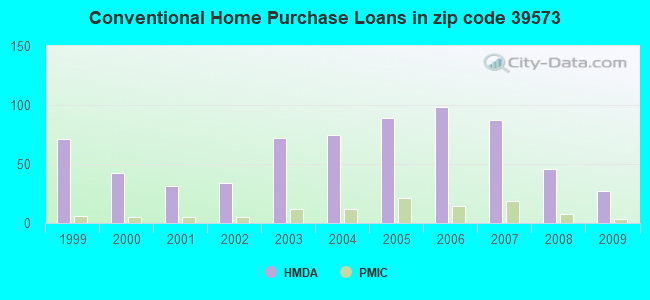
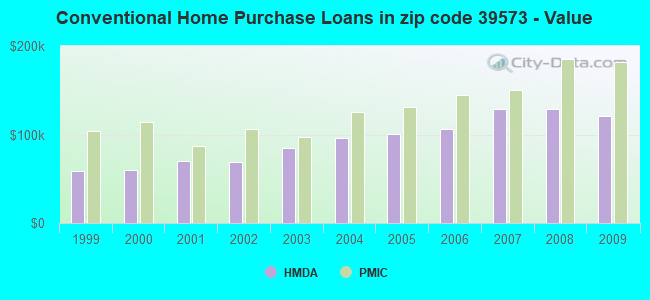
B) Conventional Home Purchase Loans
C) Refinancings
D) Home Improvement Loans
F) Non-occupant Loans on < 5 Family Dwellings (A B C & D)
G) Loans On Manufactured Home Dwelling (A B C & D)
Number
Average Value
Number
Average Value
Number
Average Value
Number
Average Value
Number
Average Value
Number
Average Value
LOANS ORIGINATED
20
$155,798
27
$120,842
100
$153,706
27
$29,189
13
$196,942
21
$42,510
APPLICATIONS APPROVED, NOT ACCEPTED
2
$179,085
4
$95,185
9
$138,204
1
$59,300
0
$0
2
$42,625
APPLICATIONS DENIED
5
$103,628
20
$69,396
57
$141,236
15
$32,122
2
$77,255
24
$49,807
APPLICATIONS WITHDRAWN
1
$184,430
6
$113,412
27
$150,479
3
$52,263
2
$84,625
3
$76,023
FILES CLOSED FOR INCOMPLETENESS
1
$238,440
1
$140,670
11
$146,964
1
$123,010
0
$0
0
$0
Aggregated Statistics For Year 2008 (Based on 6 partial tracts)
A) FHA, FSA/RHS & VA Home Purchase Loans
B) Conventional Home Purchase Loans
C) Refinancings
D) Home Improvement Loans
F) Non-occupant Loans on < 5 Family Dwellings (A B C & D)
G) Loans On Manufactured Home Dwelling (A B C & D)
Number
Average Value
Number
Average Value
Number
Average Value
Number
Average Value
Number
Average Value
Number
Average Value
LOANS ORIGINATED
9
$132,890
46
$129,077
83
$146,534
46
$38,338
17
$178,116
30
$47,715
APPLICATIONS APPROVED, NOT ACCEPTED
3
$107,433
13
$87,516
15
$141,848
4
$48,790
3
$103,213
12
$53,122
APPLICATIONS DENIED
7
$130,149
24
$81,138
49
$130,575
23
$34,168
6
$82,077
26
$55,999
APPLICATIONS WITHDRAWN
1
$112,560
11
$128,256
23
$143,915
4
$74,735
4
$104,310
5
$63,256
FILES CLOSED FOR INCOMPLETENESS
0
$0
3
$156,723
6
$144,347
0
$0
1
$157,070
1
$93,250
Aggregated Statistics For Year 2007 (Based on 6 partial tracts)
A) FHA, FSA/RHS & VA Home Purchase Loans
B) Conventional Home Purchase Loans
C) Refinancings
D) Home Improvement Loans
F) Non-occupant Loans on < 5 Family Dwellings (A B C & D)
G) Loans On Manufactured Home Dwelling (A B C & D)
Number
Average Value
Number
Average Value
Number
Average Value
Number
Average Value
Number
Average Value
Number
Average Value
LOANS ORIGINATED
10
$169,988
87
$128,997
104
$135,837
48
$37,275
18
$192,764
32
$52,557
APPLICATIONS APPROVED, NOT ACCEPTED
2
$49,955
15
$82,481
19
$133,759
6
$55,923
1
$95,770
12
$51,898
APPLICATIONS DENIED
2
$81,785
45
$85,695
59
$144,308
27
$33,488
13
$89,737
32
$54,270
APPLICATIONS WITHDRAWN
0
$0
17
$141,378
22
$136,281
7
$70,166
5
$111,138
5
$62,082
FILES CLOSED FOR INCOMPLETENESS
0
$0
7
$128,419
12
$143,487
1
$144,960
1
$59,300
0
$0
Aggregated Statistics For Year 2006 (Based on 6 partial tracts)
A) FHA, FSA/RHS & VA Home Purchase Loans
B) Conventional Home Purchase Loans
C) Refinancings
D) Home Improvement Loans
F) Non-occupant Loans on < 5 Family Dwellings (A B C & D)
G) Loans On Manufactured Home Dwelling (A B C & D)
Number
Average Value
Number
Average Value
Number
Average Value
Number
Average Value
Number
Average Value
Number
Average Value
LOANS ORIGINATED
12
$137,903
98
$106,525
76
$120,401
36
$35,896
15
$99,352
37
$45,154
APPLICATIONS APPROVED, NOT ACCEPTED
2
$99,385
22
$72,626
14
$102,464
2
$47,805
0
$0
16
$43,748
APPLICATIONS DENIED
5
$104,538
56
$71,651
44
$109,472
26
$17,610
7
$50,481
41
$48,150
APPLICATIONS WITHDRAWN
2
$78,685
19
$121,622
23
$119,679
4
$111,008
2
$146,490
3
$36,640
FILES CLOSED FOR INCOMPLETENESS
0
$0
7
$102,353
7
$161,724
2
$127,260
0
$0
0
$0
Aggregated Statistics For Year 2005 (Based on 6 partial tracts)
A) FHA, FSA/RHS & VA Home Purchase Loans
B) Conventional Home Purchase Loans
C) Refinancings
D) Home Improvement Loans
F) Non-occupant Loans on < 5 Family Dwellings (A B C & D)
G) Loans On Manufactured Home Dwelling (A B C & D)
Number
Average Value
Number
Average Value
Number
Average Value
Number
Average Value
Number
Average Value
Number
Average Value
LOANS ORIGINATED
16
$130,511
89
$100,614
69
$100,960
34
$25,011
15
$76,609
34
$40,049
APPLICATIONS APPROVED, NOT ACCEPTED
1
$66,490
19
$65,422
21
$85,897
3
$59,437
2
$74,385
14
$42,924
APPLICATIONS DENIED
7
$74,200
45
$69,749
55
$96,430
21
$20,446
5
$80,084
40
$47,019
APPLICATIONS WITHDRAWN
3
$153,757
26
$112,075
37
$109,308
4
$87,600
1
$125,730
11
$71,167
FILES CLOSED FOR INCOMPLETENESS
0
$0
3
$73,617
7
$107,746
0
$0
1
$55,950
0
$0
Aggregated Statistics For Year 2004 (Based on 6 partial tracts)
A) FHA, FSA/RHS & VA Home Purchase Loans
B) Conventional Home Purchase Loans
C) Refinancings
D) Home Improvement Loans
F) Non-occupant Loans on < 5 Family Dwellings (A B C & D)
G) Loans On Manufactured Home Dwelling (A B C & D)
Number
Average Value
Number
Average Value
Number
Average Value
Number
Average Value
Number
Average Value
Number
Average Value
LOANS ORIGINATED
24
$120,850
75
$95,531
106
$95,918
40
$19,421
13
$88,678
29
$37,294
APPLICATIONS APPROVED, NOT ACCEPTED
0
$0
8
$80,525
29
$93,321
2
$51,275
2
$65,845
6
$41,793
APPLICATIONS DENIED
3
$90,560
30
$65,360
66
$95,347
23
$25,450
4
$68,430
29
$34,892
APPLICATIONS WITHDRAWN
1
$95,460
10
$95,860
46
$106,459
4
$50,962
2
$58,545
4
$53,288
FILES CLOSED FOR INCOMPLETENESS
0
$0
6
$100,362
10
$91,564
0
$0
0
$0
1
$28,670
Aggregated Statistics For Year 2003 (Based on 6 partial tracts)
A) FHA, FSA/RHS & VA Home Purchase Loans
B) Conventional Home Purchase Loans
C) Refinancings
D) Home Improvement Loans
F) Non-occupant Loans on < 5 Family Dwellings (A B C & D)
Number
Average Value
Number
Average Value
Number
Average Value
Number
Average Value
Number
Average Value
LOANS ORIGINATED
12
$95,422
72
$85,092
183
$98,463
36
$11,547
16
$85,066
APPLICATIONS APPROVED, NOT ACCEPTED
1
$72,860
10
$72,515
25
$72,443
2
$22,920
1
$22,410
APPLICATIONS DENIED
3
$89,013
29
$48,508
71
$85,874
18
$17,918
3
$52,177
APPLICATIONS WITHDRAWN
2
$80,305
8
$107,158
62
$109,423
4
$44,630
2
$88,785
FILES CLOSED FOR INCOMPLETENESS
1
$147,920
1
$162,230
17
$92,069
1
$23,650
0
$0
Aggregated Statistics For Year 2002 (Based on 4 partial tracts)
A) FHA, FSA/RHS & VA Home Purchase Loans
B) Conventional Home Purchase Loans
C) Refinancings
D) Home Improvement Loans
E) Loans on Dwellings For 5+ Families
F) Non-occupant Loans on < 5 Family Dwellings (A B C & D)
Number
Average Value
Number
Average Value
Number
Average Value
Number
Average Value
Number
Average Value
Number
Average Value
LOANS ORIGINATED
6
$114,175
34
$68,934
64
$88,366
20
$8,042
1
$49,200
5
$60,746
APPLICATIONS APPROVED, NOT ACCEPTED
0
$0
9
$49,623
11
$69,474
2
$5,045
0
$0
1
$57,400
APPLICATIONS DENIED
1
$91,150
27
$38,105
44
$73,811
10
$16,338
0
$0
1
$85,470
APPLICATIONS WITHDRAWN
0
$0
4
$76,405
19
$95,699
3
$11,987
0
$0
0
$0
FILES CLOSED FOR INCOMPLETENESS
1
$37,850
2
$71,755
10
$92,475
0
$0
0
$0
0
$0
Aggregated Statistics For Year 2001 (Based on 4 partial tracts)
A) FHA, FSA/RHS & VA Home Purchase Loans
B) Conventional Home Purchase Loans
C) Refinancings
D) Home Improvement Loans
F) Non-occupant Loans on < 5 Family Dwellings (A B C & D)
Number
Average Value
Number
Average Value
Number
Average Value
Number
Average Value
Number
Average Value
LOANS ORIGINATED
4
$88,390
31
$69,815
67
$84,584
28
$7,941
6
$41,633
APPLICATIONS APPROVED, NOT ACCEPTED
0
$0
10
$48,477
9
$80,462
1
$9,460
1
$52,990
APPLICATIONS DENIED
0
$0
35
$37,055
39
$59,206
10
$7,065
1
$54,560
APPLICATIONS WITHDRAWN
2
$79,010
7
$83,310
23
$83,979
1
$19,870
1
$62,450
FILES CLOSED FOR INCOMPLETENESS
0
$0
1
$63,080
4
$64,420
0
$0
0
$0
Aggregated Statistics For Year 2000 (Based on 4 partial tracts)
A) FHA, FSA/RHS & VA Home Purchase Loans
B) Conventional Home Purchase Loans
C) Refinancings
D) Home Improvement Loans
F) Non-occupant Loans on < 5 Family Dwellings (A B C & D)
Number
Average Value
Number
Average Value
Number
Average Value
Number
Average Value
Number
Average Value
LOANS ORIGINATED
2
$62,605
42
$60,121
35
$69,145
30
$7,948
9
$43,560
APPLICATIONS APPROVED, NOT ACCEPTED
1
$45,730
11
$49,919
7
$75,200
1
$6,310
3
$53,093
APPLICATIONS DENIED
2
$35,640
36
$36,981
25
$76,062
13
$6,526
1
$11,350
APPLICATIONS WITHDRAWN
0
$0
5
$70,334
14
$75,561
1
$31,860
1
$33,120
FILES CLOSED FOR INCOMPLETENESS
0
$0
1
$82,630
3
$89,257
0
$0
0
$0
Aggregated Statistics For Year 1999 (Based on 3 partial tracts)
A) FHA, FSA/RHS & VA Home Purchase Loans
B) Conventional Home Purchase Loans
C) Refinancings
D) Home Improvement Loans
F) Non-occupant Loans on < 5 Family Dwellings (A B C & D)
Detailed PMIC statistics for the following Tracts:0306.00
, 0402.01
2002 - 2018 National Fire Incident Reporting System (NFIRS) incidents
According to the data from the years 2002 - 2018 the average number of fires per year is 89. The highest number of fire incidents - 172 took place in 2011, and the least - 31 in 2002. The data has a rising trend.
When looking into fire subcategories, the most reports belonged to: Outside Fires (57.5%), and Structure Fires (26.9%).
Fire incident types reported to NFIRS in Zip Code 39573


 Nearest zip codes: 39561, 39574, 39577, 39503, 39532, 39425.
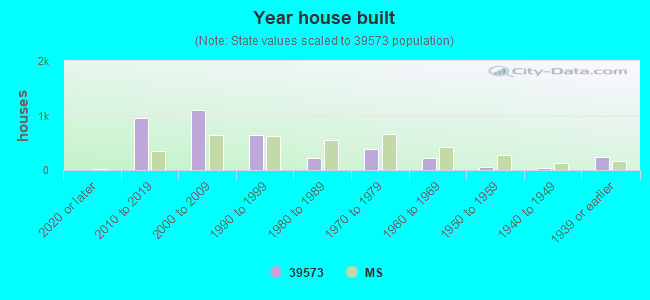


 According to the data from the years 2002 - 2018 the average number of fires per year is 89. The highest number of fire incidents - 172 took place in 2011, and the least - 31 in 2002. The data has a rising trend.
 When looking into fire subcategories, the most reports belonged to: Outside Fires (57.5%), and Structure Fires (26.9%).