Estimated zip code population in 2022: 2,424 Zip code population in 2010: 2,473 Zip code population in 2000: 1,738
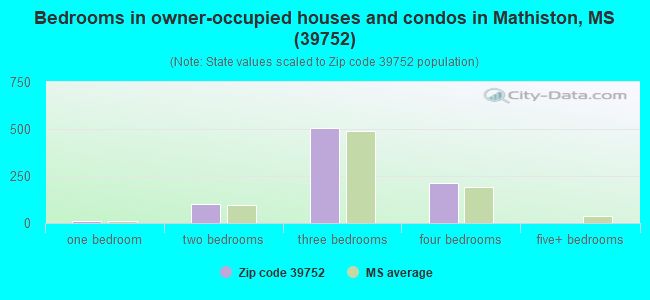
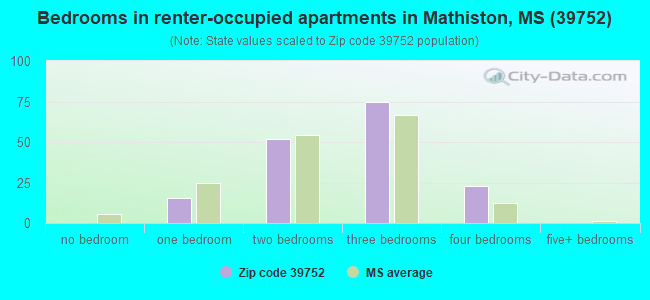
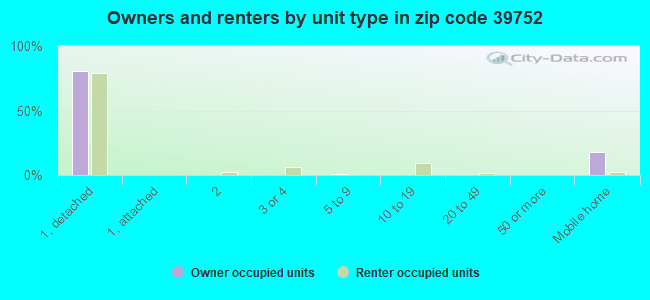
Houses and condos: 1,253 Renter-occupied apartments: 164
% of renters here:
17%
State:
30%
March 2022 cost of living index in zip code 39752: 76.6 (low, U.S. average is 100)
Land area: 69.0 sq. mi. Water area: 0.5 sq. mi.
Population density: 35 people per square mile
(very low).
OSM Map
General Map
Google Map
MSN Map
OSM Map
General Map
Google Map
MSN Map
OSM Map
General Map
Google Map
MSN Map
OSM Map
General Map
Google Map
MSN Map
Please wait while loading the map...
Real estate property taxes paid for housing units in 2022:
This zip code:
0.5% ($661)
Mississippi:
0.7% ($1,161)
Median real estate property taxes paid for housing units with mortgages in 2022: $1,022 (0.6%) Median real estate property taxes paid for housing units with no mortgage in 2022: $542 (0.5%)
Business Search- 14 Million verified businesses
Males: 1,179
(48.7%)
Females: 1,244
(51.3%)
For population 25 years and over in 39752:
High school or higher: 89.4%
Bachelor's degree or higher: 23.9%
Graduate or professional degree: 10.6%
Unemployed: 2.1%
Mean travel time to work (commute): 30.3 minutes
For population 15 years and over in 39752:
Never married: 16.9%
Now married: 66.2%
Separated: 1.1%
Widowed: 9.6%
Divorced: 6.1%
Zip code 39752 compared to state average:
Unemployed percentage below state average.
Black race population percentage significantly below state average.
Foreign-born population percentage below state average.
Renting percentage below state average.
Length of stay since moving in above state average.
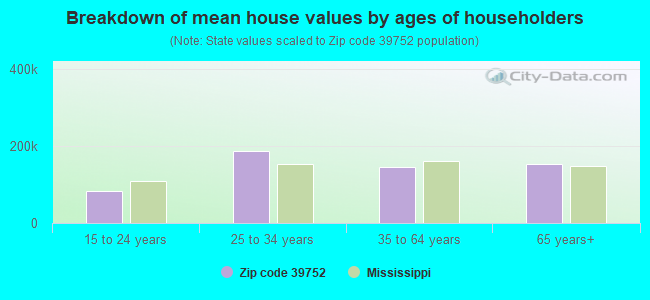
Estimated median house/condo value in 2022: $121,283
39752:
$121,283
Mississippi:
$162,500
According to our research of Mississippi and other state lists, there was 1 registered sex offender living in 39752 zip code as of June 08, 2024. The ratio of all residents to sex offenders in zip code 39752 is 2,954 to 1. The ratio of registered sex offenders to all residents in this zip code is much lower than the state average.
Median resident age:
This zip code:
40.9 years
Mississippi median age:
38.9 years
Average household size:
This zip code:
2.4 people
Mississippi:
2.5 people
Averages for the 2020 tax year for zip code 39752, filed in 2021:
Average Adjusted Gross Income (AGI) in 2020: $52,645 (Individual Income Tax Returns)
Here:
$52,645
State:
$54,084
Salary/wage: $49,241 (reported on 81.7% of returns)
Here:
$49,241
State:
$45,187
(% of AGI for various income ranges: 1155.8% for AGIs below $25k, 3848.6% for AGIs $25k-50k, 6911.8% for AGIs $50k-75k, 9602.9% for AGIs $75k-100k, 18270.0% for AGIs $100k-200k)
Taxable interest for individuals: $617 (reported on 27.9% of returns)
This zip code:
$617
Mississippi:
$1,434
(% of AGI for various income ranges: 8.1% for AGIs below $25k, 11.9% for AGIs $25k-50k, 40.0% for AGIs $50k-75k, 85.7% for AGIs $75k-100k, 32.2% for AGIs $100k-200k)
Ordinary dividends: $1,722 (reported on 8.7% of returns)
Here:
$1,722
State:
$6,661
(% of AGI for various income ranges: 8.8% for AGIs below $25k, 47.3% for AGIs $50k-75k, 88.9% for AGIs $100k-200k)
Net capital gain/loss in AGI: +$4,689 (reported on 8.7% of returns)
Here:
+$4,689
State:
+$16,833
(% of AGI for various income ranges: 29.6% for AGIs below $25k, 133.6% for AGIs $50k-75k, 220.0% for AGIs $100k-200k)
Profit/loss from business: +$7,141 (reported on 21.2% of returns)
Here:
+$7,141
State:
+$7,724
(% of AGI for various income ranges: 143.1% for AGIs below $25k, 183.3% for AGIs $25k-50k, 119.1% for AGIs $50k-75k, 495.7% for AGIs $75k-100k, 373.3% for AGIs $100k-200k)
Taxable individual retirement arrangement distribution: $8,814 (reported on 6.7% of returns)
39752:
$8,814
Mississippi:
$17,717
(% of AGI for various income ranges: 100.8% for AGIs below $25k, 322.7% for AGIs $50k-75k)
Total itemized deductions: $28,900 (reported on 2.9% of returns)
Here:
$28,900
State:
$34,027
(% of AGI for various income ranges: 788.2% for AGIs $50k-75k)
Charity contributions: $10,050 (reported on 1.9% of returns)
Here:
$10,050
State:
$14,997
(% of AGI for various income ranges: 182.7% for AGIs $50k-75k)
Taxes paid: $5,033 (reported on 2.9% of returns)
39752:
$5,033
State:
$6,353
(% of AGI for various income ranges: 137.3% for AGIs $50k-75k)
Earned income credit: $2,273 (reported on 21.2% of returns)
Here:
$2,273
State:
$2,689
(% of AGI for various income ranges: 120.0% for AGIs below $25k, 89.5% for AGIs $25k-50k)
Percentage of individuals using paid preparers for their 2020 taxes: 95.2%
Here:
95%
State:
94%
(% for various income ranges: 91.7% for AGIs below $25k, 96.3% for AGIs $25k-50k, 100.0% for AGIs $50k-75k, 100.0% for AGIs $75k-100k, 93.3% for AGIs $100k-200k)
Averages for the 2012 tax year for zip code 39752, filed in 2013:
Average Adjusted Gross Income (AGI) in 2012: $40,141 (Individual Income Tax Returns)
Here:
$40,141
State:
$46,197
Salary/wage: $37,982 (reported on 83.2% of returns)
Here:
$37,982
State:
$38,549
(% of AGI for various income ranges: 73.3% for AGIs below $25k, 80.6% for AGIs $25k-50k, 86.8% for AGIs $50k-75k, 83.8% for AGIs $75k-100k, 65.0% for AGIs $100k-200k)
Taxable interest for individuals: $560 (reported on 26.3% of returns)
This zip code:
$560
Mississippi:
$1,482
(% of AGI for various income ranges: 0.6% for AGIs below $25k, 0.3% for AGIs $25k-50k, 0.2% for AGIs $50k-75k, 0.5% for AGIs $75k-100k, 0.4% for AGIs $100k-200k)
Ordinary dividends: $1,212 (reported on 8.4% of returns)
Here:
$1,212
State:
$5,401
(% of AGI for various income ranges: 0.3% for AGIs below $25k, 0.5% for AGIs $25k-50k, 0.5% for AGIs $75k-100k)
Net capital gain/loss in AGI: +$3,583 (reported on 6.3% of returns)
Here:
+$3,583
State:
+$12,121
Profit/loss from business: +$6,241 (reported on 23.2% of returns)
Here:
+$6,241
State:
+$10,220
(% of AGI for various income ranges: 13.3% for AGIs below $25k, 4.9% for AGIs $25k-50k, 0.3% for AGIs $50k-75k, 2.6% for AGIs $75k-100k)
Taxable individual retirement arrangement distribution: $9,850 (reported on 6.3% of returns)
39752:
$9,850
Mississippi:
$13,665
Total itemized deductions: $18,281 (25% of AGI, reported on 16.8% of returns)
Here:
$18,281
State:
$22,078
Here:
25.5% of AGI
State:
21.8% of AGI
(% of AGI for various income ranges: 6.3% for AGIs below $25k, 7.9% for AGIs $25k-50k, 5.7% for AGIs $50k-75k, 8.5% for AGIs $75k-100k, 10.1% for AGIs $100k-200k)
Charity contributions: $5,008 (reported on 12.6% of returns)
Here:
$5,008
State:
$6,081
(% of AGI for various income ranges: 2.0% for AGIs $25k-50k, 0.8% for AGIs $50k-75k, 2.1% for AGIs $75k-100k, 2.6% for AGIs $100k-200k)
Taxes paid: $3,838 (reported on 16.8% of returns)
39752:
$3,838
State:
$5,794
(% of AGI for various income ranges: 1.6% for AGIs $25k-50k, 0.9% for AGIs $50k-75k, 2.1% for AGIs $75k-100k, 3.2% for AGIs $100k-200k)
Earned income credit: $2,469 (reported on 30.5% of returns)
Here:
$2,469
State:
$2,710
(% of AGI for various income ranges: 10.3% for AGIs below $25k, 1.9% for AGIs $25k-50k)
Percentage of individuals using paid preparers for their 2012 taxes: 70.5%
Here:
71%
State:
60%
(% for various income ranges: 70.7% for AGIs below $25k, 65.4% for AGIs $25k-50k, 73.3% for AGIs $50k-75k, 75.0% for AGIs $75k-100k, 80.0% for AGIs $100k-200k)
Averages for the 2004 tax year for zip code 39752, filed in 2005:
Average Adjusted Gross Income (AGI) in 2004: $30,357 (Individual Income Tax Returns)
Here:
$30,357
State:
$36,110
Salary/wage: $29,906 (reported on 82.9% of returns)
Here:
$29,906
State:
$31,757
(% of AGI for various income ranges: 100.0% for AGIs below $10k, 76.2% for AGIs $10k-25k, 85.5% for AGIs $25k-50k, 85.6% for AGIs $50k-75k, 86.1% for AGIs $75k-100k, 53.4% for AGIs over 100k)
Taxable interest for individuals: $1,112 (reported on 30.3% of returns)
This zip code:
$1,112
Mississippi:
$1,649
(% of AGI for various income ranges: 4.9% for AGIs below $10k, 2.2% for AGIs $10k-25k, 0.7% for AGIs $25k-50k, 0.5% for AGIs $50k-75k, 0.4% for AGIs $75k-100k, 2.0% for AGIs over 100k)
Taxable dividends: $1,051 (reported on 10.8% of returns)
Here:
$1,051
State:
$3,089
(% of AGI for various income ranges: 0.9% for AGIs $10k-25k, 0.1% for AGIs $25k-50k, 0.4% for AGIs $50k-75k, 0.7% for AGIs $75k-100k)
Net capital gain/loss: +$696 (reported on 8.7% of returns)
Here:
+$696
State:
+$8,427
(% of AGI for various income ranges: 1.0% for AGIs below $10k, 0.0% for AGIs $10k-25k, 0.0% for AGIs $25k-50k, 0.3% for AGIs $50k-75k, 0.7% for AGIs $75k-100k)
Profit/loss from business: +$5,862 (reported on 23.0% of returns)
Here:
+$5,862
State:
+$8,818
(% of AGI for various income ranges: 28.7% for AGIs below $10k, 5.3% for AGIs $10k-25k, 4.3% for AGIs $25k-50k, 5.2% for AGIs $50k-75k)
IRA payment deduction: $3,053 (reported on 2.1% of returns)
39752:
$3,053
Mississippi:
$3,024
Total itemized deductions: $14,507 (26% of AGI, reported on 15.1% of returns)
Here:
$14,507
State:
$17,896
Here:
26.1% of AGI
State:
22.5% of AGI
(% of AGI for various income ranges: 6.8% for AGIs $10k-25k, 5.6% for AGIs $25k-50k, 8.2% for AGIs $50k-75k, 15.7% for AGIs $75k-100k)
Charity contributions deductions: $3,791 (6% of AGI, reported on 12.6% of returns)
Here:
$3,791
State:
$4,735
Here:
6.3% of AGI
State:
5.7% of AGI
(% of AGI for various income ranges: 0.9% for AGIs $10k-25k, 1.0% for AGIs $25k-50k, 1.9% for AGIs $50k-75k, 4.5% for AGIs $75k-100k)
Total tax: $3,353 (reported on 70.1% of returns)
39752:
$3,353
State:
$5,562
(% of AGI for various income ranges: 6.4% for AGIs below $10k, 3.6% for AGIs $10k-25k, 6.1% for AGIs $25k-50k, 8.5% for AGIs $50k-75k, 9.9% for AGIs $75k-100k, 18.4% for AGIs over 100k)
Earned income credit: $2,004 (reported on 26.9% of returns)
Here:
$2,004
State:
$2,107
Percentage of individuals using paid preparers for their 2004 taxes: 76.7%
Here:
77%
State:
65%
(% for various income ranges: 70.1% for AGIs below $10k, 78.6% for AGIs $10k-25k, 77.0% for AGIs $25k-50k, 77.3% for AGIs $50k-75k, 83.7% for AGIs $75k-100k, 85.7% for AGIs over 100k)
Household received Food Stamps/SNAP in the past 12 months: 66 Household did not receive Food Stamps/SNAP in the past 12 months: 921
Women who had a birth in the past 12 months: 25 (24 now married, 1 unmarried) Women who did not have a birth in the past 12 months: 468 (320 now married, 145 unmarried)
Housing units in zip code 39752 with a mortgage: 352 (11 second mortgage, 9 both second mortgage and home equity loan) Houses without a mortgage: 17
Median monthly owner costs for units with a mortgage: $1,048 Median monthly owner costs for units without a mortgage: $354
Residents with income below the poverty level in 2022:
This zip code:
6.8%
Whole state:
19.1%
Residents with income below 50% of the poverty level in 2022:
This zip code:
4.5%
Whole state:
10.3%
Median number of rooms in houses and condos:
Here:
6.0
State:
6.3
Median number of rooms in apartments:
Here:
5.7
State:
4.8
Notable locations in this zip code not listed on our city pages
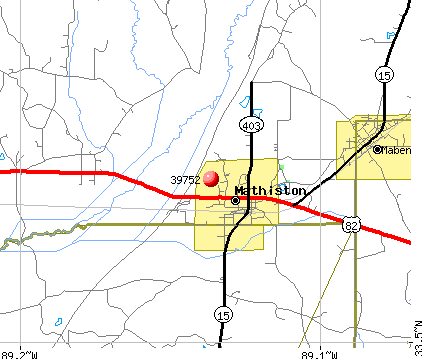
Notable locations in zip code 39752: Mathiston Volunteer Fire Department (A), Clarkson - Fame Volunteer Fire Department (B). Display/hide their locations on the map
Churches in zip code 39752 include: New Hope Church (A), Old Mount Pisgah Church (B), Spring Valley Church (C), Blytha Creek Church (D), Travelers Rest Church (E), Mathison United Methodist Church (F), Mathison Baptist Church (G), Clarkson Methodist Church (H), Clarkson Baptist Church (I). Display/hide their locations on the map
Cemeteries: Spring Valley Cemetery (1), New Hope Cemetery (2), Clarkson Cemetery (3), Old Mount Pisgah Cemetery (4), Spring Valley Cemetery (5), La Grange Cemetery (6), Fellowship Cemetery (7). Display/hide their locations on the map
Streams, rivers, and creeks: Boatner Branch (A), Boatman Branch (B), Blytha Creek (C), Bywy Creek (D), Savannah Creek (E), Irvin Branch (F), Pigeon Roost Creek (G), Furcher Branch (H), Phillips Creek (I). Display/hide their locations on the map
In group quarters: 18 (-1 institutionalized population)
Size of family households: 376 2-persons, 139 3-persons, 171 4-persons, 48 5-persons, 16 6-persons
Size of nonfamily households: 217 1-person, 15 2-persons
483 married couples with children.
69 single-parent households (40 men, 29 women).
98.7% of residents of 39752 zip code speak English at home.
0.7% of residents speak Spanish at home (100% very well).
0.7% of residents speak other Indo-European language at home (53% very well, 47% well).
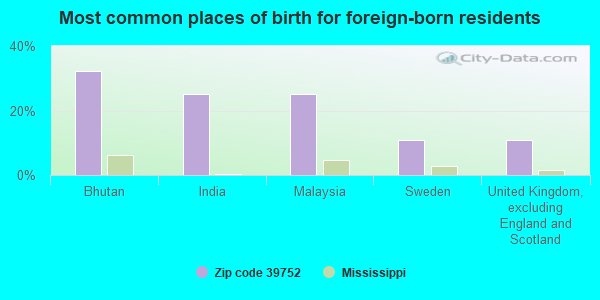
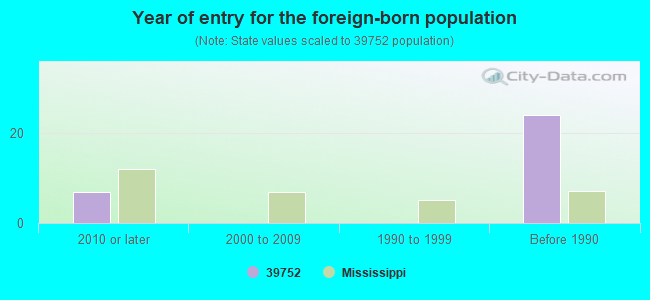
Foreign born population: 25 (1.1%) (72.9% of them are naturalized citizens)
This zip code:
1.1%
Whole state:
2.2%
32%Bhutan
25%India
25%Malaysia
11%Sweden
11%United Kingdom, excluding England and Scotland
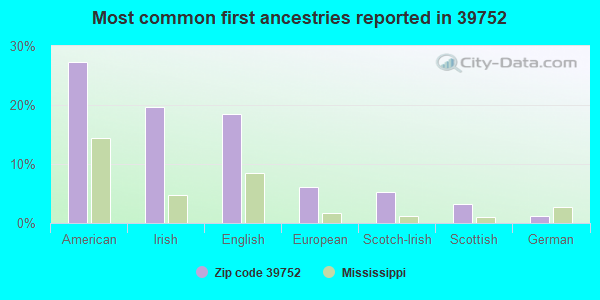
27%American
20%Irish
18%English
6%European
5%Scotch-Irish
3%Scottish
1%German
Year of entry for the foreign-born population
72010 or later
02000 to 2009
01990 to 1999
24Before 1990
Facilities with environmental interests located in this zip code:
BROWN WOOD PRESERVING COMPANY INC (CROSS ROAD in MATHISTON, MS)
STATE MASTER (Mississippi compliance, permits, activity tracking ) - ENSITE-MS0058874, National Pollutant Discharge Elimination System Permit National Pollutant Discharge Elimination System NON-MAJOR (Tracking pollutant discharge elimination systems) - permit Business SIC classification: WOOD PRODUCTS Alternative names: BROWN WOOD PERSERVING COMPANY, WEBSTER COUNTY
EAST WEBSTER ELEMENTARY SCHOOL (1ST STREET in MATHISTON, MS)
(Geographic Names Information System) (National Center for Education Statistics) - STATE ID-7800016 Organizations: WEBSTER CO SCHOOL DIST (SCHOOL DISTRICT)
MALLOY.(CASE NAME) (HARTFORD LEASE/MCLEAN COUNTY in UNKNOWN, KY)
(Integrated Compliance Information System) - ICIS-04-1988-0087, FORMAL ENFORCEMENT ACTION
Housing units lacking complete plumbing facilities: 7.0% Housing units lacking complete kitchen facilities: 5.9%
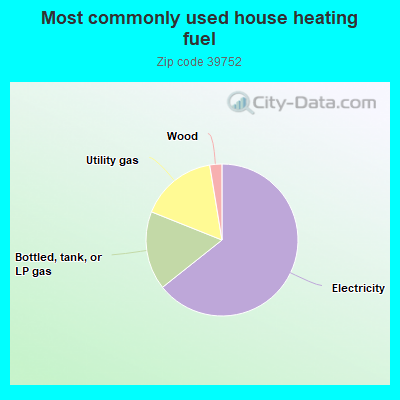
64.5%Electricity
16.8%Bottled, tank, or LP gas
16.4%Utility gas
2.6%Wood
Population in 1990: 3,213.
Place of birth for U.S.-born residents:
This state: 1,973
Northeast: 17
Midwest: 34
South: 322
West: 29
67% of the 39752 zip code residents lived in the same house 5 years ago. Out of people who lived in different houses, 52% lived in this county. Out of people who lived in different counties, 50% lived in Mississippi.
96% of the 39752 zip code residents lived in the same house 1 year ago. Out of people who lived in different houses, 49% moved from this county. Out of people who lived in different houses, 42% moved from different county within same state. Out of people who lived in different houses, 6% moved from different state.
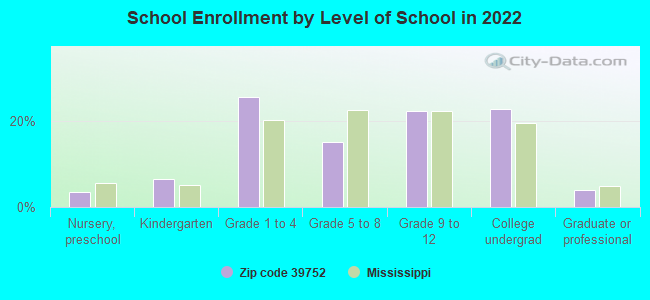
Private vs. public school enrollment:
Students in private schools in grades 1 to 8 (elementary and middle school): 16
Here:
8.7%
Mississippi:
16.1%
Students in private schools in grades 9 to 12 (high school): 32
Here:
29.5%
Mississippi:
14.6%
Students in private undergraduate colleges: 30
Here:
28.7%
Mississippi:
12.8%
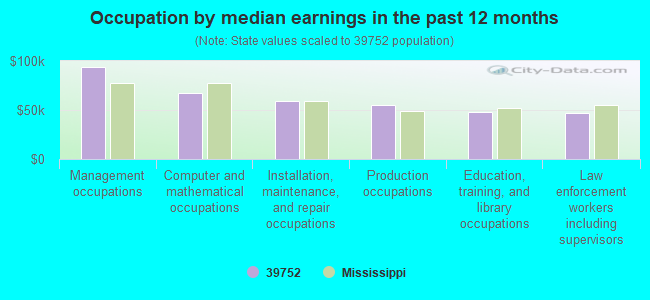
Occupation by median earnings in the past 12 months ($)
93,556Management occupations
67,838Computer and mathematical occupations
59,601Installation, maintenance, and repair occupations
55,057Production occupations
48,234Education, training, and library occupations
47,388Law enforcement workers including supervisors
Companies with federal contracts located in this zip code:
PARKER ROBERSON PAINTING & DEC (CUMBERLAND RD in MATHISTON, MS; small business) 40 employees, $2000000 revenue.
$17,500 with Agricultural Research Service for Maintenance, Repair or Alteration of Real Property -- Government-Owned Government-Operated (GOGO) R&D Facilities. Signed on 2003-05-15. Completion date: 2003-08-15.
Top industries in this zip code by the number of employees in 2005:
Construction: Painting and Wall Covering Contractors (20-49 employees: 1 establishment)
Health Care and Social Assistance: Nursing Care Facilities (20-49: 1)
Construction: Commercial and Institutional Building Construction (10-19: 1, 5-9: 1)
Other Services (except Public Administration): Religious Organizations (5-9: 1, 1-4: 3)
Health Care and Social Assistance: Child Day Care Services (5-9: 1)
People in group quarters in 2010:
14 people in group homes intended for adults
8 people in nursing facilities/skilled-nursing facilities
People in group quarters in 2000:
24 people in college dormitories (includes college quarters off campus)
10 people in other noninstitutional group quarters
Fatal accident statistics in 2010:
Fatal accident count: 2
Vehicles involved in fatal accidents: 3
Fatal accidents caused by drunken drivers: 0
Fatalities: 2
Persons involved in fatal accidents: 8
Pedestrians involved in fatal accidents: 0
2003 - 2018 National Fire Incident Reporting System (NFIRS) incidents
Based on the data from the years 2003 - 2018 the average number of fires per year is 22. The highest number of fire incidents - 39 took place in 2006, and the least - 8 in 2003. The data has a growing trend.
When looking into fire subcategories, the most incidents belonged to: Outside Fires (52.5%), and Structure Fires (31.4%).
Fire incident types reported to NFIRS in Zip Code 39752

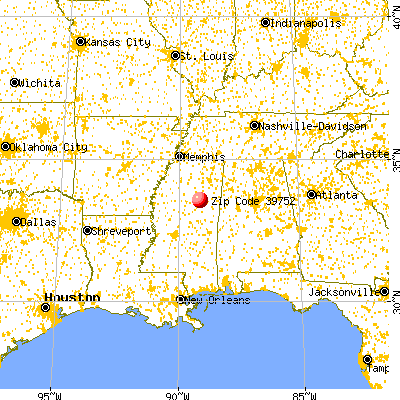


 Nearest zip codes: 39750, 39771, 39744, 39735, 39751, 39755.


 Based on the data from the years 2003 - 2018 the average number of fires per year is 22. The highest number of fire incidents - 39 took place in 2006, and the least - 8 in 2003. The data has a growing trend.
 When looking into fire subcategories, the most incidents belonged to: Outside Fires (52.5%), and Structure Fires (31.4%).