Estimated zip code population in 2022: 834 Zip code population in 2010: 834 Zip code population in 2000: 703
Houses and condos: 314 Renter-occupied apartments: 26
% of renters here:
9%
State:
31%
March 2022 cost of living index in zip code 40022: 80.3 (low, U.S. average is 100)
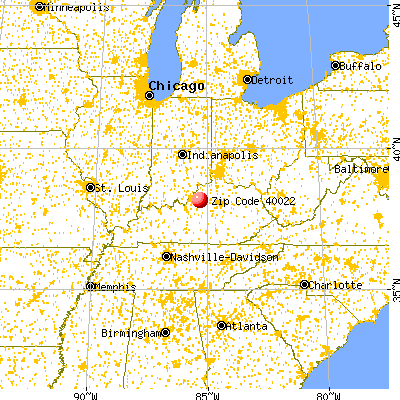
Land area: 16.1 sq. mi. Water area: 0.3 sq. mi.
Population density: 52 people per square mile
(very low).
OSM Map
General Map
Google Map
MSN Map
OSM Map
General Map
Google Map
MSN Map
OSM Map
General Map
Google Map
MSN Map
OSM Map
General Map
Google Map
MSN Map
Please wait while loading the map...
Real estate property taxes paid for housing units in 2022:
This zip code:
0.7% ($3,222)
Kentucky:
0.7% ($1,456)
Median real estate property taxes paid for housing units with mortgages in 2022: $3,085 (0.8%) Median real estate property taxes paid for housing units with no mortgage in 2022: $3,504 (0.7%)
Business Search- 14 Million verified businesses
Males: 389
(46.7%)
Females: 445
(53.3%)
For population 25 years and over in 40022:
High school or higher: 97.3%
Bachelor's degree or higher: 39.9%
Graduate or professional degree: 16.1%
Mean travel time to work (commute): 25.8 minutes
For population 15 years and over in 40022:
Never married: 24.0%
Now married: 63.9%
Separated: 4.4%
Widowed: 0.6%
Divorced: 7.1%
Zip code 40022 compared to state average:
Median household income above state average.
Median house value above state average.
Unemployed percentage significantly below state average.
Median age significantly above state average.
Foreign-born population percentage significantly below state average.
Renting percentage significantly below state average.
Length of stay since moving in significantly above state average.
Number of rooms per house above state average.
Percentage of population with a bachelor's degree or higher above state average.
Estimated median house/condo value in 2022: $434,411
40022:
$434,411
Kentucky:
$196,300
Median resident age:
This zip code:
51.0 years
Kentucky median age:
39.4 years
Average household size:
This zip code:
2.9 people
Kentucky:
2.4 people
Averages for the 2020 tax year for zip code 40022, filed in 2021:
Average Adjusted Gross Income (AGI) in 2020: $104,673 (Individual Income Tax Returns)
Here:
$104,673
State:
$61,342
Salary/wage: $80,677 (reported on 84.3% of returns)
Here:
$80,677
State:
$50,827
(% of AGI for various income ranges: 1282.2% for AGIs below $25k, 3884.3% for AGIs $25k-50k, 7140.0% for AGIs $50k-75k, 8873.3% for AGIs $75k-100k, 18290.0% for AGIs $100k-200k)
Taxable interest for individuals: $1,190 (reported on 39.2% of returns)
This zip code:
$1,190
Kentucky:
$1,441
(% of AGI for various income ranges: 2.2% for AGIs below $25k, 57.1% for AGIs $25k-50k, 37.5% for AGIs $50k-75k, 56.7% for AGIs $75k-100k, 43.3% for AGIs $100k-200k)
Ordinary dividends: $5,179 (reported on 27.5% of returns)
Here:
$5,179
State:
$7,388
(% of AGI for various income ranges: 230.0% for AGIs $25k-50k, 310.0% for AGIs $50k-75k, 251.7% for AGIs $100k-200k)
Net capital gain/loss in AGI: +$17,485 (reported on 25.5% of returns)
Here:
+$17,485
State:
+$19,475
(% of AGI for various income ranges: 137.1% for AGIs $25k-50k, 7.5% for AGIs $50k-75k, 635.0% for AGIs $100k-200k)
Profit/loss from business: +$8,889 (reported on 17.6% of returns)
Here:
+$8,889
State:
+$11,386
(% of AGI for various income ranges: 261.1% for AGIs below $25k, 732.5% for AGIs $50k-75k, 453.3% for AGIs $100k-200k)
Taxable individual retirement arrangement distribution: $19,100 (reported on 9.8% of returns)
40022:
$19,100
Kentucky:
$18,941
(% of AGI for various income ranges: 552.9% for AGIs $25k-50k, 946.7% for AGIs $100k-200k)
Total itemized deductions: $36,833 (reported on 11.8% of returns)
Here:
$36,833
State:
$32,473
(% of AGI for various income ranges: 2583.3% for AGIs $75k-100k)
Charity contributions: $18,950 (reported on 7.8% of returns)
Here:
$18,950
State:
$13,472
(% of AGI for various income ranges: )
Taxes paid: $8,100 (reported on 11.8% of returns)
40022:
$8,100
State:
$7,830
(% of AGI for various income ranges: 656.7% for AGIs $75k-100k)
Earned income credit: $1,620 (reported on 9.8% of returns)
Here:
$1,620
State:
$2,336
(% of AGI for various income ranges: 90.0% for AGIs below $25k)
Percentage of individuals using paid preparers for their 2020 taxes: 96.1%
Here:
96%
State:
94%
(% for various income ranges: 93.3% for AGIs below $25k, 90.0% for AGIs $25k-50k, 100.0% for AGIs $50k-75k, 100.0% for AGIs $75k-100k, 100.0% for AGIs $100k-200k, 100.0% for AGIs over 200k)
Averages for the 2012 tax year for zip code 40022, filed in 2013:
Average Adjusted Gross Income (AGI) in 2012: $73,235 (Individual Income Tax Returns)
Here:
$73,235
State:
$50,814
Salary/wage: $55,784 (reported on 86.0% of returns)
Here:
$55,784
State:
$42,723
(% of AGI for various income ranges: 66.4% for AGIs below $25k, 61.8% for AGIs $25k-50k, 85.3% for AGIs $50k-75k, 72.9% for AGIs $75k-100k, 59.8% for AGIs $100k-200k)
Taxable interest for individuals: $972 (reported on 41.9% of returns)
This zip code:
$972
Kentucky:
$1,381
(% of AGI for various income ranges: 0.8% for AGIs below $25k, 1.7% for AGIs $25k-50k, 0.8% for AGIs $75k-100k, 0.3% for AGIs $100k-200k)
Ordinary dividends: $3,315 (reported on 30.2% of returns)
Here:
$3,315
State:
$6,239
(% of AGI for various income ranges: 1.5% for AGIs below $25k, 0.8% for AGIs $25k-50k, 1.3% for AGIs $75k-100k, 1.8% for AGIs $100k-200k)
Net capital gain/loss in AGI: +$6,144 (reported on 20.9% of returns)
Here:
+$6,144
State:
+$11,336
(% of AGI for various income ranges: 0.2% for AGIs $25k-50k, 3.4% for AGIs $100k-200k)
Profit/loss from business: +$11,225 (reported on 18.6% of returns)
Here:
+$11,225
State:
+$10,862
Taxable individual retirement arrangement distribution: $9,840 (reported on 11.6% of returns)
40022:
$9,840
Kentucky:
$14,296
Total itemized deductions: $21,664 (20% of AGI, reported on 51.2% of returns)
Here:
$21,664
State:
$21,160
Here:
20.1% of AGI
State:
20.0% of AGI
(% of AGI for various income ranges: 18.0% for AGIs below $25k, 11.7% for AGIs $25k-50k, 15.8% for AGIs $50k-75k, 17.0% for AGIs $75k-100k, 14.8% for AGIs $100k-200k)
Charity contributions: $5,272 (reported on 41.9% of returns)
Here:
$5,272
State:
$4,303
(% of AGI for various income ranges: 2.1% for AGIs $25k-50k, 1.8% for AGIs $50k-75k, 2.4% for AGIs $75k-100k, 4.0% for AGIs $100k-200k)
Taxes paid: $8,455 (reported on 51.2% of returns)
40022:
$8,455
State:
$8,496
(% of AGI for various income ranges: 2.7% for AGIs below $25k, 2.8% for AGIs $25k-50k, 5.3% for AGIs $50k-75k, 6.6% for AGIs $75k-100k, 6.7% for AGIs $100k-200k)
Earned income credit: $2,100 (reported on 11.6% of returns)
Here:
$2,100
State:
$2,273
(% of AGI for various income ranges: 6.7% for AGIs below $25k)
Percentage of individuals using paid preparers for their 2012 taxes: 67.4%
Here:
67%
State:
60%
(% for various income ranges: 61.5% for AGIs below $25k, 70.0% for AGIs $25k-50k, 80.0% for AGIs $50k-75k, 57.1% for AGIs $75k-100k, 75.0% for AGIs $100k-200k)
Averages for the 2004 tax year for zip code 40022, filed in 2005:
Average Adjusted Gross Income (AGI) in 2004: $62,046 (Individual Income Tax Returns)
Here:
$62,046
State:
$41,540
Salary/wage: $52,220 (reported on 83.7% of returns)
Here:
$52,220
State:
$36,432
(% of AGI for various income ranges: 136.5% for AGIs below $10k, 67.5% for AGIs $10k-25k, 71.6% for AGIs $25k-50k, 79.6% for AGIs $50k-75k, 77.3% for AGIs $75k-100k, 63.1% for AGIs over 100k)
Taxable interest for individuals: $934 (reported on 59.2% of returns)
This zip code:
$934
Kentucky:
$1,571
(% of AGI for various income ranges: 11.6% for AGIs below $10k, 1.2% for AGIs $10k-25k, 1.2% for AGIs $25k-50k, 1.3% for AGIs $50k-75k, 0.6% for AGIs $75k-100k, 0.5% for AGIs over 100k)
Taxable dividends: $1,269 (reported on 32.5% of returns)
Here:
$1,269
State:
$3,453
(% of AGI for various income ranges: 4.6% for AGIs below $10k, 1.6% for AGIs $10k-25k, 0.4% for AGIs $25k-50k, 1.1% for AGIs $50k-75k, 0.5% for AGIs $75k-100k, 0.4% for AGIs over 100k)
Net capital gain/loss: +$9,262 (reported on 26.0% of returns)
Here:
+$9,262
State:
+$9,663
(% of AGI for various income ranges: -2.5% for AGIs below $10k, -0.3% for AGIs $10k-25k, 1.5% for AGIs $25k-50k, 0.1% for AGIs $50k-75k, 2.8% for AGIs $75k-100k, 6.8% for AGIs over 100k)
Profit/loss from business: +$10,551 (reported on 18.9% of returns)
Here:
+$10,551
State:
+$9,233
(% of AGI for various income ranges: 1.1% for AGIs below $10k, 6.8% for AGIs $10k-25k, 5.3% for AGIs $25k-50k, 3.5% for AGIs $50k-75k, 3.5% for AGIs over 100k)
Total itemized deductions: $20,869 (21% of AGI, reported on 50.0% of returns)
Here:
$20,869
State:
$17,474
Here:
21.0% of AGI
State:
21.0% of AGI
(% of AGI for various income ranges: 13.1% for AGIs $10k-25k, 14.9% for AGIs $25k-50k, 20.3% for AGIs $50k-75k, 18.5% for AGIs $75k-100k, 16.0% for AGIs over 100k)
Charity contributions deductions: $3,011 (3% of AGI, reported on 45.6% of returns)
Here:
$3,011
State:
$3,494
Here:
3.1% of AGI
State:
4.0% of AGI
(% of AGI for various income ranges: 2.8% for AGIs below $10k, 1.9% for AGIs $25k-50k, 3.3% for AGIs $50k-75k, 2.3% for AGIs $75k-100k, 2.0% for AGIs over 100k)
Total tax: $9,829 (reported on 82.3% of returns)
40022:
$9,829
State:
$6,162
(% of AGI for various income ranges: 5.3% for AGIs below $10k, 6.6% for AGIs $10k-25k, 6.9% for AGIs $25k-50k, 8.6% for AGIs $50k-75k, 9.5% for AGIs $75k-100k, 18.2% for AGIs over 100k)
Earned income credit: $1,655 (reported on 7.0% of returns)
Here:
$1,655
State:
$1,723
Percentage of individuals using paid preparers for their 2004 taxes: 66.0%
Here:
66%
State:
66%
(% for various income ranges: 60.8% for AGIs below $10k, 61.8% for AGIs $10k-25k, 75.7% for AGIs $25k-50k, 65.4% for AGIs $50k-75k, 57.1% for AGIs $75k-100k, 73.4% for AGIs over 100k)
Household received Food Stamps/SNAP in the past 12 months: 0 Household did not receive Food Stamps/SNAP in the past 12 months: 287
Women who had a birth in the past 12 months: 13 (13 now married, 0 unmarried) Women who did not have a birth in the past 12 months: 136 (55 now married, 81 unmarried)
Housing units in zip code 40022 with a mortgage: 129 (41 second mortgage, 25 home equity loan, 20 both second mortgage and home equity loan) Houses without a mortgage: 8
Median monthly owner costs for units with a mortgage: $1,884 Median monthly owner costs for units without a mortgage: $658
Residents with income below the poverty level in 2022:
This zip code:
5.8%
Whole state:
16.5%
Residents with income below 50% of the poverty level in 2022:
This zip code:
0.6%
Whole state:
9.0%
Median number of rooms in houses and condos:
Here:
8.2
State:
6.4
Median number of rooms in apartments:
Here:
4.7
State:
4.4
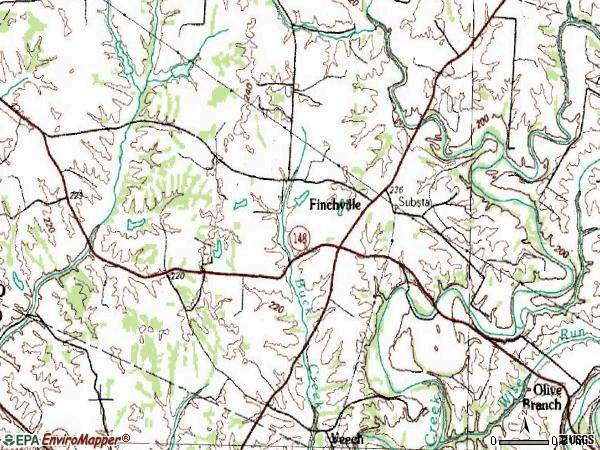
Notable locations in this zip code not listed on our city pages
Notable locations in zip code 40022: Simpsonville Rural Fire Protection District Station 3 (A), Shelby County Fire Department Station 4 (B). Display/hide their locations on the map
Housing units lacking complete kitchen facilities: 4.5%
65.9%Electricity
30.6%Bottled, tank, or LP gas
2.2%Utility gas
1.1%No fuel used
0.7%Wood
Population in 1990: 1,040.
Place of birth for U.S.-born residents:
This state: 574
Northeast: 25
Midwest: 136
South: 63
West: 12
58% of the 40022 zip code residents lived in the same house 5 years ago. Out of people who lived in different houses, 29% lived in this county. Out of people who lived in different counties, 50% lived in Kentucky.
100% of the 40022 zip code residents lived in the same house 1 year ago.
Private vs. public school enrollment:
Students in private schools in grades 1 to 8 (elementary and middle school): 38
Here:
49.9%
Kentucky:
17.2%
Students in private schools in grades 9 to 12 (high school): 12
Here:
14.7%
Kentucky:
15.2%
Students in private undergraduate colleges:
Here:
0.0%
Kentucky:
19.6%
Occupation by median earnings in the past 12 months ($)
87,615Installation, maintenance, and repair occupations
87,580Health diagnosing and treating practitioners and other technical occupations
77,083Production occupations
56,844Sales and related occupations
43,114Management occupations
17,513Office and administrative support occupations
Companies with federal contracts located in this zip code:
CREATIVE IMAGE TECHNOLOGIES, L (5759 BUCKCREEK RD in FINCHVILLE, KY; small business) : $53,987 in 4 contractsin 2005
$29,060 with Army for Video Recording and Reproducing Equipment. Signed on 2005-09-21. Completion date: 2005-10-31.
$9,962 with Army for Photographic Projection Equipment. Signed on 2005-09-26. Completion date: 2005-10-17.
$9,962, same as above.Signed on 2005-09-26. Completion date: 2005-10-17.
$5,003 with Army for ADP Software. Signed on 2005-09-22. Completion date: 2005-10-31.
Top industries in this zip code by the number of employees in 2005:
Arts, Entertainment, and Recreation: Other Spectator Sports (10-19 employees: 1 establishment)
Wholesale Trade: Meat and Meat Product Merchant Wholesalers (10-19: 1)
Administrative and Support and Waste Management and Remediation Services: Landscaping Services (1-4: 3)
Construction: Drywall and Insulation Contractors (1-4: 2)
Construction: Plumbing, Heating, and Air-Conditioning Contractors (1-4: 2)
Other Services (except Public Administration): Computer and Office Machine Repair and Maintenance (1-4: 1)
Educational Services: Sports and Recreation Instruction (1-4: 1)
Construction: Masonry Contractors (1-4: 1)
Professional, Scientific, and Technical Services: Veterinary Services (1-4: 1)
Fatal accident statistics in 2014:
Fatal accident count: 2
Vehicles involved in fatal accidents: 2
Fatal accidents caused by drunken drivers: 2
Fatalities: 3
Persons involved in fatal accidents: 4
Pedestrians involved in fatal accidents: 0
Fatal accident statistics in 2010:
Fatal accident count: 1
Vehicles involved in fatal accidents: 1
Fatal accidents caused by drunken drivers: 0
Fatalities: 1
Persons involved in fatal accidents: 1
Pedestrians involved in fatal accidents: 0
Home Mortgage Disclosure Act Aggregated Statistics For Year 2009 (Based on 2 partial tracts)
A) FHA, FSA/RHS & VA Home Purchase Loans
B) Conventional Home Purchase Loans
C) Refinancings
D) Home Improvement Loans
F) Non-occupant Loans on < 5 Family Dwellings (A B C & D)
G) Loans On Manufactured Home Dwelling (A B C & D)
Number
Average Value
Number
Average Value
Number
Average Value
Number
Average Value
Number
Average Value
Number
Average Value
LOANS ORIGINATED
12
$159,338
20
$213,629
105
$219,691
3
$44,987
9
$143,464
1
$76,230
APPLICATIONS APPROVED, NOT ACCEPTED
0
$0
1
$208,790
7
$196,130
1
$71,430
0
$0
0
$0
APPLICATIONS DENIED
3
$138,733
3
$247,590
31
$316,725
1
$40,520
1
$149,380
0
$0
APPLICATIONS WITHDRAWN
1
$112,980
2
$239,695
24
$225,857
1
$125,000
1
$131,520
0
$0
FILES CLOSED FOR INCOMPLETENESS
0
$0
0
$0
6
$234,542
0
$0
0
$0
0
$0
Aggregated Statistics For Year 2008 (Based on 2 partial tracts)
A) FHA, FSA/RHS & VA Home Purchase Loans
B) Conventional Home Purchase Loans
C) Refinancings
D) Home Improvement Loans
F) Non-occupant Loans on < 5 Family Dwellings (A B C & D)
Number
Average Value
Number
Average Value
Number
Average Value
Number
Average Value
Number
Average Value
LOANS ORIGINATED
9
$178,530
33
$236,832
49
$218,970
4
$111,175
9
$167,847
APPLICATIONS APPROVED, NOT ACCEPTED
0
$0
3
$260,527
7
$198,191
1
$101,990
0
$0
APPLICATIONS DENIED
2
$180,970
5
$324,720
27
$270,637
6
$50,252
1
$641,470
APPLICATIONS WITHDRAWN
1
$73,830
2
$201,230
16
$235,508
1
$115,040
1
$128,430
FILES CLOSED FOR INCOMPLETENESS
0
$0
0
$0
3
$307,230
0
$0
0
$0
Aggregated Statistics For Year 2007 (Based on 2 partial tracts)
A) FHA, FSA/RHS & VA Home Purchase Loans
B) Conventional Home Purchase Loans
C) Refinancings
D) Home Improvement Loans
F) Non-occupant Loans on < 5 Family Dwellings (A B C & D)
G) Loans On Manufactured Home Dwelling (A B C & D)
Number
Average Value
Number
Average Value
Number
Average Value
Number
Average Value
Number
Average Value
Number
Average Value
LOANS ORIGINATED
3
$154,760
50
$232,399
57
$228,939
9
$81,233
7
$225,516
0
$0
APPLICATIONS APPROVED, NOT ACCEPTED
0
$0
5
$191,000
10
$219,639
1
$77,610
0
$0
1
$23,350
APPLICATIONS DENIED
2
$158,480
7
$262,799
30
$258,191
5
$25,068
6
$336,073
0
$0
APPLICATIONS WITHDRAWN
0
$0
2
$200,545
13
$211,270
1
$133,930
1
$180,630
0
$0
FILES CLOSED FOR INCOMPLETENESS
0
$0
1
$171,010
4
$232,652
0
$0
0
$0
0
$0
Aggregated Statistics For Year 2006 (Based on 2 partial tracts)
A) FHA, FSA/RHS & VA Home Purchase Loans
B) Conventional Home Purchase Loans
C) Refinancings
D) Home Improvement Loans
F) Non-occupant Loans on < 5 Family Dwellings (A B C & D)
G) Loans On Manufactured Home Dwelling (A B C & D)
Number
Average Value
Number
Average Value
Number
Average Value
Number
Average Value
Number
Average Value
Number
Average Value
LOANS ORIGINATED
2
$247,420
56
$214,778
59
$192,502
8
$65,632
11
$143,791
1
$48,760
APPLICATIONS APPROVED, NOT ACCEPTED
0
$0
7
$248,229
9
$239,884
2
$47,220
0
$0
0
$0
APPLICATIONS DENIED
0
$0
4
$141,395
29
$179,752
3
$50,823
1
$69,020
1
$32,970
APPLICATIONS WITHDRAWN
0
$0
3
$141,940
15
$211,443
1
$34,340
2
$99,760
0
$0
FILES CLOSED FOR INCOMPLETENESS
0
$0
0
$0
10
$188,012
1
$12,020
1
$135,640
0
$0
Aggregated Statistics For Year 2005 (Based on 2 partial tracts)
A) FHA, FSA/RHS & VA Home Purchase Loans
B) Conventional Home Purchase Loans
C) Refinancings
D) Home Improvement Loans
F) Non-occupant Loans on < 5 Family Dwellings (A B C & D)
G) Loans On Manufactured Home Dwelling (A B C & D)
Number
Average Value
Number
Average Value
Number
Average Value
Number
Average Value
Number
Average Value
Number
Average Value
LOANS ORIGINATED
3
$124,197
60
$183,273
68
$211,822
6
$78,295
8
$108,300
1
$54,260
APPLICATIONS APPROVED, NOT ACCEPTED
0
$0
7
$176,507
8
$126,242
1
$36,740
0
$0
0
$0
APPLICATIONS DENIED
0
$0
9
$194,021
26
$177,828
3
$74,290
1
$123,620
1
$54,940
APPLICATIONS WITHDRAWN
1
$99,930
8
$211,921
15
$227,193
2
$140,280
1
$73,830
0
$0
FILES CLOSED FOR INCOMPLETENESS
0
$0
2
$197,970
6
$203,578
1
$123,620
0
$0
0
$0
Aggregated Statistics For Year 2004 (Based on 2 partial tracts)
A) FHA, FSA/RHS & VA Home Purchase Loans
B) Conventional Home Purchase Loans
C) Refinancings
D) Home Improvement Loans
F) Non-occupant Loans on < 5 Family Dwellings (A B C & D)
G) Loans On Manufactured Home Dwelling (A B C & D)


 Nearest zip codes: 40067, 40023, 40071, 40245, 40065, 40299.