Estimated zip code population in 2022: 7,540 Zip code population in 2010: 8,276 Zip code population in 2000: 7,538
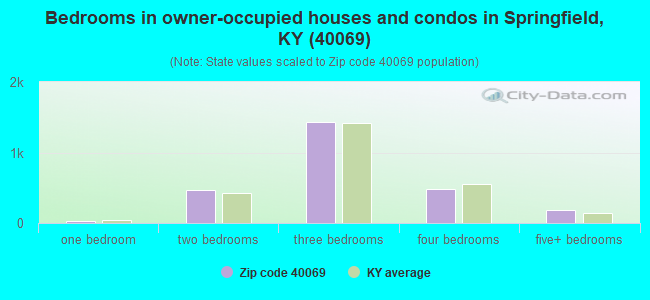
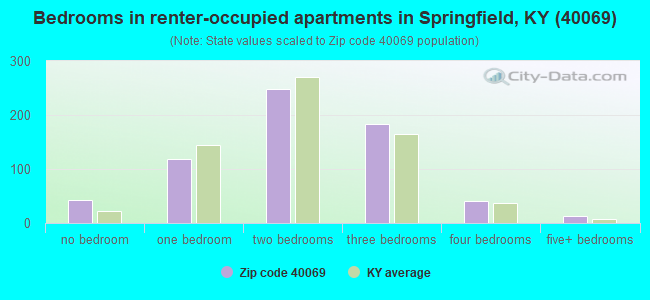
Houses and condos: 3,542 Renter-occupied apartments: 651
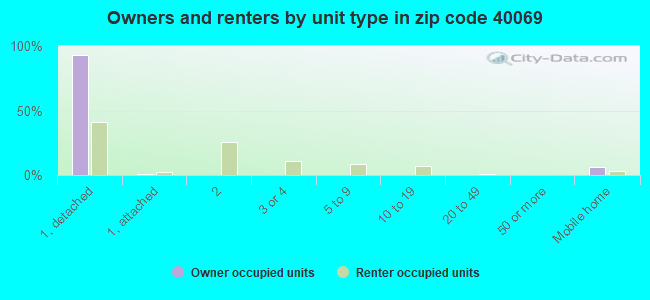
% of renters here:
20%
State:
31%
March 2022 cost of living index in zip code 40069: 81.2 (low, U.S. average is 100)
Land area: 190.4 sq. mi. Water area: 2.4 sq. mi.
Population density: 40 people per square mile
(very low).
OSM Map
General Map
Google Map
MSN Map
OSM Map
General Map
Google Map
MSN Map
OSM Map
General Map
Google Map
MSN Map
OSM Map
General Map
Google Map
MSN Map
Please wait while loading the map...
Real estate property taxes paid for housing units in 2022:
This zip code:
0.8% ($1,437)
Kentucky:
0.7% ($1,456)
Median real estate property taxes paid for housing units with mortgages in 2022: $1,347 (0.8%) Median real estate property taxes paid for housing units with no mortgage in 2022: $1,634 (0.8%)
Business Search- 14 Million verified businesses
Males: 3,939
(52.2%)
Females: 3,600
(47.8%)
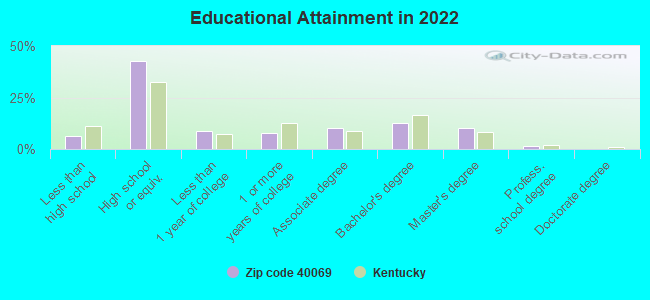
For population 25 years and over in 40069:
High school or higher: 93.9%
Bachelor's degree or higher: 24.7%
Graduate or professional degree: 11.8%
Unemployed: 1.2%
Mean travel time to work (commute): 20.2 minutes
For population 15 years and over in 40069:
Never married: 22.8%
Now married: 55.8%
Separated: 1.3%
Widowed: 7.4%
Divorced: 12.7%
Zip code 40069 compared to state average:
Unemployed percentage significantly below state average.
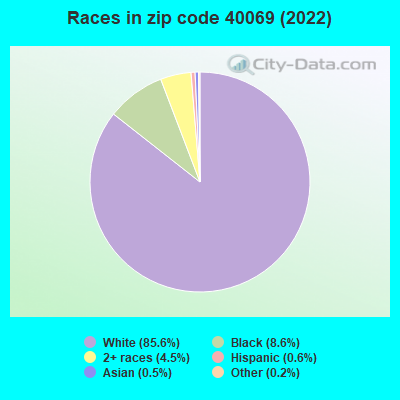
Hispanic race population percentage significantly below state average.
Median age above state average.
Foreign-born population percentage significantly below state average.
Renting percentage below state average.
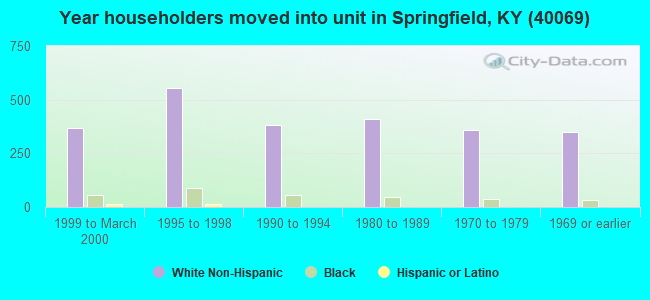
Length of stay since moving in significantly above state average.
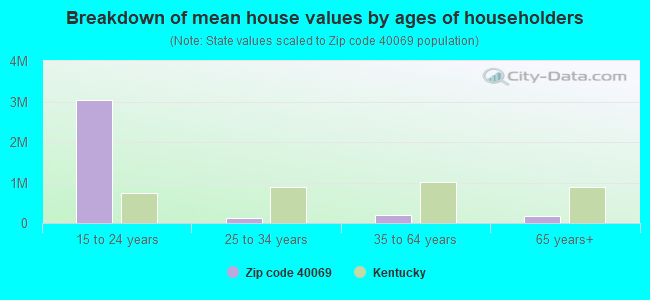
Estimated median house/condo value in 2022: $186,319
40069:
$186,319
Kentucky:
$196,300
According to our research of Kentucky and other state lists, there were 17 registered sex offenders living in 40069 zip code as of May 28, 2024. The ratio of all residents to sex offenders in zip code 40069 is 514 to 1. The ratio of registered sex offenders to all residents in this zip code is near the state average.
Median resident age:
This zip code:
44.6 years
Kentucky median age:
39.4 years
Average household size:
This zip code:
2.3 people
Kentucky:
2.4 people
Averages for the 2020 tax year for zip code 40069, filed in 2021:
Average Adjusted Gross Income (AGI) in 2020: $53,289 (Individual Income Tax Returns)
Here:
$53,289
State:
$61,342
Salary/wage: $46,205 (reported on 84.4% of returns)
Here:
$46,205
State:
$50,827
(% of AGI for various income ranges: 1303.4% for AGIs below $25k, 4041.5% for AGIs $25k-50k, 6608.3% for AGIs $50k-75k, 9891.5% for AGIs $75k-100k, 17104.6% for AGIs $100k-200k, 73360.0% for AGIs over 200k)
Taxable interest for individuals: $1,855 (reported on 25.8% of returns)
This zip code:
$1,855
Kentucky:
$1,441
(% of AGI for various income ranges: 33.8% for AGIs below $25k, 20.6% for AGIs $25k-50k, 36.6% for AGIs $50k-75k, 105.8% for AGIs $75k-100k, 214.2% for AGIs $100k-200k, 2465.0% for AGIs over 200k)
Ordinary dividends: $4,830 (reported on 14.9% of returns)
Here:
$4,830
State:
$7,388
(% of AGI for various income ranges: 28.4% for AGIs below $25k, 25.7% for AGIs $25k-50k, 76.2% for AGIs $50k-75k, 131.5% for AGIs $75k-100k, 308.3% for AGIs $100k-200k, 4960.0% for AGIs over 200k)
Net capital gain/loss in AGI: +$11,593 (reported on 14.1% of returns)
Here:
+$11,593
State:
+$19,475
(% of AGI for various income ranges: 30.7% for AGIs below $25k, 29.4% for AGIs $25k-50k, 123.2% for AGIs $50k-75k, 191.2% for AGIs $75k-100k, 1037.1% for AGIs $100k-200k, 12630.0% for AGIs over 200k)
Profit/loss from business: +$9,693 (reported on 14.6% of returns)
Here:
+$9,693
State:
+$11,386
(% of AGI for various income ranges: 107.6% for AGIs below $25k, 153.3% for AGIs $25k-50k, 256.6% for AGIs $50k-75k, 209.6% for AGIs $75k-100k, 194.6% for AGIs $100k-200k, 6400.0% for AGIs over 200k)
Taxable individual retirement arrangement distribution: $10,977 (reported on 7.7% of returns)
40069:
$10,977
Kentucky:
$18,941
(% of AGI for various income ranges: 53.4% for AGIs below $25k, 59.8% for AGIs $25k-50k, 173.4% for AGIs $50k-75k, 157.3% for AGIs $75k-100k, 503.7% for AGIs $100k-200k)
Total itemized deductions: $31,314 (reported on 3.5% of returns)
Here:
$31,314
State:
$32,473
(% of AGI for various income ranges: 68.7% for AGIs below $25k, 104.7% for AGIs $50k-75k, 339.6% for AGIs $75k-100k, 418.8% for AGIs $100k-200k, 6895.0% for AGIs over 200k)
Charity contributions: $13,036 (reported on 2.7% of returns)
Here:
$13,036
State:
$13,472
(% of AGI for various income ranges: 16.4% for AGIs $25k-50k, 111.2% for AGIs $75k-100k, 127.9% for AGIs $100k-200k, 3525.0% for AGIs over 200k)
Taxes paid: $6,879 (reported on 3.5% of returns)
40069:
$6,879
State:
$7,830
(% of AGI for various income ranges: 9.0% for AGIs below $25k, 25.3% for AGIs $50k-75k, 69.2% for AGIs $75k-100k, 117.5% for AGIs $100k-200k, 1500.0% for AGIs over 200k)
Earned income credit: $2,256 (reported on 17.4% of returns)
Here:
$2,256
State:
$2,336
(% of AGI for various income ranges: 101.0% for AGIs below $25k, 81.5% for AGIs $25k-50k)
Percentage of individuals using paid preparers for their 2020 taxes: 95.5%
Here:
96%
State:
94%
(% for various income ranges: 95.0% for AGIs below $25k, 95.4% for AGIs $25k-50k, 95.5% for AGIs $50k-75k, 97.4% for AGIs $75k-100k, 95.2% for AGIs $100k-200k, 100.0% for AGIs over 200k)
Averages for the 2012 tax year for zip code 40069, filed in 2013:
Average Adjusted Gross Income (AGI) in 2012: $42,785 (Individual Income Tax Returns)
Here:
$42,785
State:
$50,814
Salary/wage: $37,191 (reported on 85.7% of returns)
Here:
$37,191
State:
$42,723
(% of AGI for various income ranges: 76.2% for AGIs below $25k, 82.6% for AGIs $25k-50k, 81.8% for AGIs $50k-75k, 78.7% for AGIs $75k-100k, 70.0% for AGIs $100k-200k, 41.1% for AGIs over 200k)
Taxable interest for individuals: $1,808 (reported on 34.2% of returns)
This zip code:
$1,808
Kentucky:
$1,381
(% of AGI for various income ranges: 2.5% for AGIs below $25k, 1.1% for AGIs $25k-50k, 1.2% for AGIs $50k-75k, 1.1% for AGIs $75k-100k, 1.7% for AGIs $100k-200k, 1.3% for AGIs over 200k)
Ordinary dividends: $3,309 (reported on 15.6% of returns)
Here:
$3,309
State:
$6,239
(% of AGI for various income ranges: 0.9% for AGIs below $25k, 0.8% for AGIs $25k-50k, 0.8% for AGIs $50k-75k, 0.8% for AGIs $75k-100k, 2.4% for AGIs $100k-200k, 1.7% for AGIs over 200k)
Net capital gain/loss in AGI: +$10,298 (reported on 15.9% of returns)
Here:
+$10,298
State:
+$11,336
(% of AGI for various income ranges: 1.0% for AGIs below $25k, 1.5% for AGIs $25k-50k, 0.9% for AGIs $50k-75k, 2.4% for AGIs $75k-100k, 7.2% for AGIs $100k-200k, 14.7% for AGIs over 200k)
Profit/loss from business: +$8,321 (reported on 14.3% of returns)
Here:
+$8,321
State:
+$10,862
(% of AGI for various income ranges: 7.0% for AGIs below $25k, 1.9% for AGIs $25k-50k, 1.8% for AGIs $50k-75k, 1.0% for AGIs $75k-100k, 5.2% for AGIs $100k-200k)
Taxable individual retirement arrangement distribution: $9,294 (reported on 8.9% of returns)
40069:
$9,294
Kentucky:
$14,296
(% of AGI for various income ranges: 2.3% for AGIs below $25k, 1.6% for AGIs $25k-50k, 1.7% for AGIs $50k-75k, 2.3% for AGIs $75k-100k, 3.2% for AGIs $100k-200k)
Total itemized deductions: $19,442 (23% of AGI, reported on 23.2% of returns)
Here:
$19,442
State:
$21,160
Here:
22.6% of AGI
State:
20.0% of AGI
(% of AGI for various income ranges: 5.7% for AGIs below $25k, 8.6% for AGIs $25k-50k, 8.7% for AGIs $50k-75k, 11.6% for AGIs $75k-100k, 14.7% for AGIs $100k-200k, 15.5% for AGIs over 200k)
Charity contributions: $4,783 (reported on 19.4% of returns)
Here:
$4,783
State:
$4,303
(% of AGI for various income ranges: 0.7% for AGIs below $25k, 1.2% for AGIs $25k-50k, 1.6% for AGIs $50k-75k, 2.3% for AGIs $75k-100k, 4.1% for AGIs $100k-200k, 3.9% for AGIs over 200k)
Taxes paid: $6,244 (reported on 23.2% of returns)
40069:
$6,244
State:
$8,496
(% of AGI for various income ranges: 0.9% for AGIs below $25k, 1.8% for AGIs $25k-50k, 2.7% for AGIs $50k-75k, 4.4% for AGIs $75k-100k, 6.0% for AGIs $100k-200k, 5.3% for AGIs over 200k)
Earned income credit: $2,213 (reported on 21.0% of returns)
Here:
$2,213
State:
$2,273
(% of AGI for various income ranges: 6.6% for AGIs below $25k, 1.2% for AGIs $25k-50k)
Percentage of individuals using paid preparers for their 2012 taxes: 76.0%
Here:
76%
State:
60%
(% for various income ranges: 73.6% for AGIs below $25k, 76.5% for AGIs $25k-50k, 79.6% for AGIs $50k-75k, 75.9% for AGIs $75k-100k, 77.3% for AGIs $100k-200k, 100.0% for AGIs over 200k)
Averages for the 2004 tax year for zip code 40069, filed in 2005:
Average Adjusted Gross Income (AGI) in 2004: $35,360 (Individual Income Tax Returns)
Here:
$35,360
State:
$41,540
Salary/wage: $32,420 (reported on 85.5% of returns)
Here:
$32,420
State:
$36,432
(% of AGI for various income ranges: 119.7% for AGIs below $10k, 78.3% for AGIs $10k-25k, 86.7% for AGIs $25k-50k, 84.2% for AGIs $50k-75k, 81.6% for AGIs $75k-100k, 56.1% for AGIs over 100k)
Taxable interest for individuals: $1,858 (reported on 47.9% of returns)
This zip code:
$1,858
Kentucky:
$1,571
(% of AGI for various income ranges: 14.8% for AGIs below $10k, 4.3% for AGIs $10k-25k, 1.8% for AGIs $25k-50k, 1.2% for AGIs $50k-75k, 1.8% for AGIs $75k-100k, 3.0% for AGIs over 100k)
Taxable dividends: $2,614 (reported on 18.1% of returns)
Here:
$2,614
State:
$3,453
(% of AGI for various income ranges: 3.1% for AGIs below $10k, 0.8% for AGIs $10k-25k, 0.6% for AGIs $25k-50k, 0.9% for AGIs $50k-75k, 1.2% for AGIs $75k-100k, 2.9% for AGIs over 100k)
Net capital gain/loss: +$7,623 (reported on 16.2% of returns)
Here:
+$7,623
State:
+$9,663
(% of AGI for various income ranges: 0.1% for AGIs below $10k, 2.8% for AGIs $10k-25k, 1.6% for AGIs $25k-50k, 2.1% for AGIs $50k-75k, 2.9% for AGIs $75k-100k, 8.3% for AGIs over 100k)
Profit/loss from business: +$9,514 (reported on 14.8% of returns)
Here:
+$9,514
State:
+$9,233
(% of AGI for various income ranges: 7.9% for AGIs below $10k, 5.7% for AGIs $10k-25k, 2.0% for AGIs $25k-50k, 2.5% for AGIs $50k-75k, 0.8% for AGIs $75k-100k, 8.3% for AGIs over 100k)
IRA payment deduction: $3,207 (reported on 2.7% of returns)
40069:
$3,207
Kentucky:
$2,955
(% of AGI for various income ranges: 0.4% for AGIs $10k-25k, 0.3% for AGIs $25k-50k, 0.2% for AGIs $50k-75k, 0.2% for AGIs over 100k)
Self-employed pension: $14,100 (reported on 0.3% of returns)
Here:
$14,100
Kentucky:
$14,996
Total itemized deductions: $15,129 (21% of AGI, reported on 24.5% of returns)
Here:
$15,129
State:
$17,474
Here:
21.1% of AGI
State:
21.0% of AGI
(% of AGI for various income ranges: 14.0% for AGIs below $10k, 7.0% for AGIs $10k-25k, 7.7% for AGIs $25k-50k, 10.8% for AGIs $50k-75k, 13.8% for AGIs $75k-100k, 13.3% for AGIs over 100k)
Charity contributions deductions: $3,667 (5% of AGI, reported on 21.8% of returns)
Here:
$3,667
State:
$3,494
Here:
5.0% of AGI
State:
4.0% of AGI
(% of AGI for various income ranges: 1.1% for AGIs below $10k, 1.0% for AGIs $10k-25k, 1.4% for AGIs $25k-50k, 1.8% for AGIs $50k-75k, 3.1% for AGIs $75k-100k, 4.2% for AGIs over 100k)
Total tax: $4,481 (reported on 72.8% of returns)
40069:
$4,481
State:
$6,162
(% of AGI for various income ranges: 5.3% for AGIs below $10k, 4.0% for AGIs $10k-25k, 6.2% for AGIs $25k-50k, 7.8% for AGIs $50k-75k, 9.4% for AGIs $75k-100k, 17.8% for AGIs over 100k)
Earned income credit: $1,660 (reported on 18.8% of returns)
Here:
$1,660
State:
$1,723
Percentage of individuals using paid preparers for their 2004 taxes: 81.6%
Here:
82%
State:
66%
(% for various income ranges: 74.9% for AGIs below $10k, 82.3% for AGIs $10k-25k, 84.0% for AGIs $25k-50k, 83.7% for AGIs $50k-75k, 84.1% for AGIs $75k-100k, 89.1% for AGIs over 100k)
Household received Food Stamps/SNAP in the past 12 months: 293 Household did not receive Food Stamps/SNAP in the past 12 months: 2,940
Women who had a birth in the past 12 months: 47 (46 now married, 0 unmarried) Women who did not have a birth in the past 12 months: 1,513 (837 now married, 680 unmarried)
Housing units in zip code 40069 with a mortgage: 1,464 (136 second mortgage, 5 home equity loan, 99 both second mortgage and home equity loan) Houses without a mortgage: 41
Median monthly owner costs for units with a mortgage: $1,018 Median monthly owner costs for units without a mortgage: $505
Residents with income below the poverty level in 2022:
This zip code:
8.0%
Whole state:
16.5%
Residents with income below 50% of the poverty level in 2022:
This zip code:
6.0%
Whole state:
9.0%
Median number of rooms in houses and condos:
Here:
6.5
State:
6.4
Median number of rooms in apartments:
Here:
4.7
State:
4.4
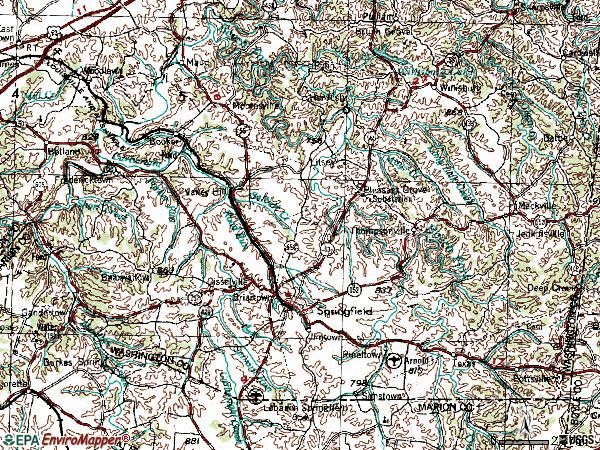
Notable locations in this zip code not listed on our city pages
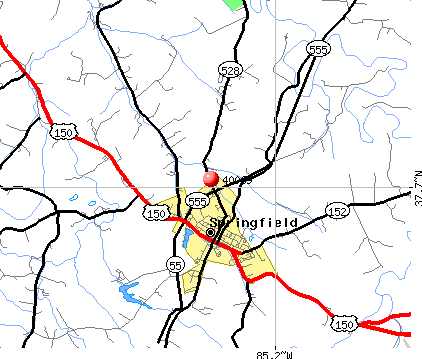
Notable locations in zip code 40069: Lone Star (A), Maple Grove (B), Washington County Fire Department (C), Springfield Fire Department (D), Washington County Ambulance Service (E). Display/hide their locations on the map
Churches in zip code 40069 include: Hardins Chapel (A), Hillsboro Church (B), Wesley Chapel (C), Holy Rosary Church (D), New Hope Church (E), Bethlehem Church (F), Thompsonville Church (G). Display/hide their locations on the map
Cemeteries: Cocanougher Cemetery (1), Young Cemetery (2), Holderman Cemetery (3), Settle Cemetery (4), Pleasant Grove Church Cemetery (5), Pile Cemetery (6), Moore Cemetery (7). Display/hide their locations on the map
Streams, rivers, and creeks: Servant Run (A), Allen Branch (B), Doe Run (C), Booker Branch (D), Brady Branch (E), Turkey Creek (F), Tick Creek (G), Casey Branch (H), Cartwright Creek (I). Display/hide their locations on the map
In group quarters: 76 (-1 institutionalized population)
Size of family households: 915 2-persons, 387 3-persons, 531 4-persons, 159 5-persons, 29 6-persons
Size of nonfamily households: 995 1-person, 212 2-persons, 7 3-persons
1,097 married couples with children.
299 single-parent households (49 men, 250 women).
98.3% of residents of 40069 zip code speak English at home.
1.2% of residents speak Spanish at home (36% very well, 59% well, 5% not at all).
0.4% of residents speak other Indo-European language at home (100% very well).
0.2% of residents speak Asian or Pacific Island language at home (38% very well, 38% well, 25% not well).
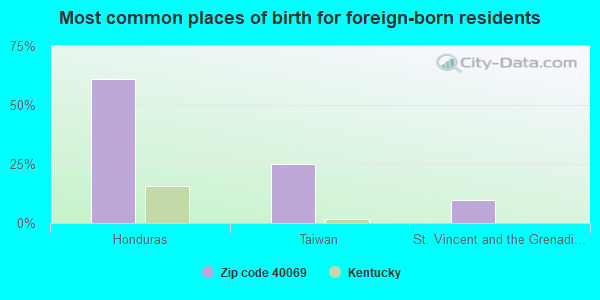
Foreign born population: 67 (0.9%) (6.1% of them are naturalized citizens)
This zip code:
0.9%
Whole state:
4.0%
61%Honduras
25%Taiwan
10%St. Vincent and the Grenadines
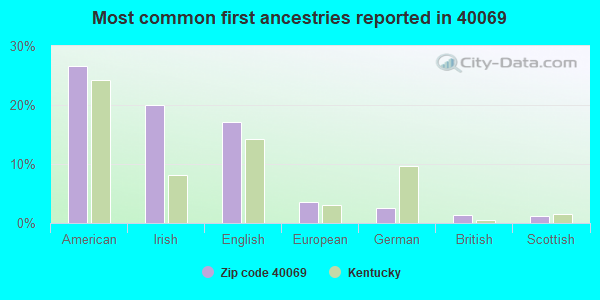
27%American
20%Irish
17%English
4%European
3%German
1%British
1%Scottish
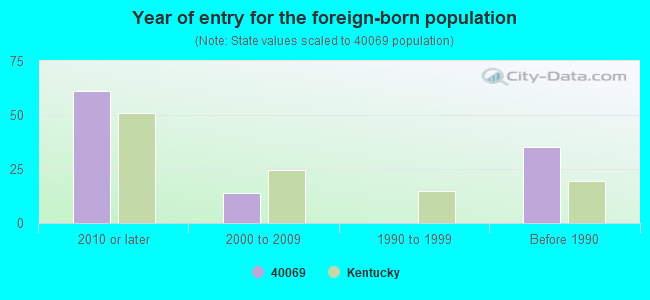
Year of entry for the foreign-born population
612010 or later
142000 to 2009
01990 to 1999
35Before 1990
Major facilities with environmental interests located in this zip code:
NALLY & HAYDON SURFACING LLC SPRINGFIELD ASPHALT PLANT (BOOKER ROAD in SPRINGFIELD, KY)
AIR MINOR (AIRS/AFS) CRITERIA AND HAZARDOUS AIR POLLUTANT INVENTORY (Inventory of air pollution sources) National Pollutant Discharge Elimination System NON-MAJOR (Tracking pollutant discharge elimination systems) - permit TRI REPORTER (Tracking of toxic chemicals releasing facilities) Business SIC classification: CRUSHED AND BROKEN LIMESTONE; ASPHALT PAVING MIXTURES AND BLOCKS; READY-MIXED CONCRETE Business NAICS classification: ASPHALT PAVING MIXTURE AND BLOCK MANUFACTURING. Organizations: NALLY & GIBSON QUARRIES INC (CONTACT/OWNER)
Alternative names: IRVING MATERIALS INC, NALLEY & HAYDON SURFACING L.L.C., NALLY & GIBSON QUARRIES INC
FREDRICKTOWN ELEMENTARY SCHOOL (318 FREDERICKTOWN RD in SPRINGFIELD, KY)
(National Center for Education Statistics) - STATE ID-115575030 Organizations: WASHINGTON COUNTY (SCHOOL DISTRICT)
CLEMENTS AG SUPPLY, INC. (1223 LEBANON ROAD in SPRINGFIELD, KY)
(Integrated Compliance Information System) - ICIS-04-2004-2015, FORMAL ENFORCEMENT ACTION
NORTH AMERICAN PIPE CORP (500 RIPPONFIELD RD in SPRINGFIELD, KY)
COMPLIANCE ACTIVITY (Tracking inspections of insecticide, fungicide, and rodenticide, and toxic substances) National Pollutant Discharge Elimination System NON-MAJOR (Tracking pollutant discharge elimination systems) - permit Conditionally Exempt Small Quantity Generators, less than 100 kg/month of hazardous waste (Resource Conservation and Recovery Act (tracking hazardous waste)) - notification Business SIC and NAICS classification: PLASTICS PIPE Organizations: NORTH AMERICAN PIPE CORP. (CONTACT/OWNER)
BLUEGRASS DAIRY & FOOD LLC (606 WEST MAIN STREET in SPRINGFIELD, KY)
COMPLIANCE ACTIVITY (Tracking inspections of insecticide, fungicide, and rodenticide, and toxic substances) National Pollutant Discharge Elimination System NON-MAJOR (Tracking pollutant discharge elimination systems) - permit TRI REPORTER (Tracking of toxic chemicals releasing facilities) Business SIC classification: DRY, CONDENSED, AND EVAPORATED DAIRY PRODUCTS Alternative names: ARMOUR FOOD INGREDIENTS
AMTEC BRAKE LLC (1101 CORPORATE DR in SPRINGFIELD, KY)
National Pollutant Discharge Elimination System NON-MAJOR (Tracking pollutant discharge elimination systems) - permit TRI REPORTER (Tracking of toxic chemicals releasing facilities) Business SIC classification: MOTOR VEHICLE PARTS AND ACCESSORIES
ALL WEATHER INSULATION CO LLC (5309 BARDSTOWN RD in SPRINGFIELD, KY)
National Pollutant Discharge Elimination System NON-MAJOR (Tracking pollutant discharge elimination systems) - permit Business SIC classification: CELLULOSIC MANMADE FIBERS
BALLARD OIL COMPANY (128 BALLARD ST in SPRINGFIELD, KY)
(Resource Conservation and Recovery Act (tracking hazardous waste)) Organizations: JOE PAT HAYDON (CONTACT/OWNER)
BELLSOUTH TELECOMMUNICATIONS, INC. (MANHOLE W-1, MAIN & WALNUT ST. in SPRINGFIELD, KY)
(Resource Conservation and Recovery Act (tracking hazardous waste)) Organizations: CITY OF SPRINGFIELD (CONTACT/OWNER)
Alternative names: SOUTH CENTRAL BELL COMPANY
CENTRAL SILVER, INC. (HIGHWAY 55 in SPRINGFIELD, KY)
(Resource Conservation and Recovery Act (tracking hazardous waste)) Business NAICS classification: SECONDARY SMELTING, REFINING, AND ALLOYING OF NONFERROUS METAL (EXCEPT COPPER AND ALUMINUM).
NALLY & GIBSON (BARKER ROAD in SPRINGFIELD, KY)
AIR MINOR (AIRS/AFS) Business SIC classification: ASPHALT PAVING MIXTURES AND BLOCKS
NALLY & HAYDEN SURF. (BARKER ROAD in SPRINGFIELD, KY)
AIR MINOR (AIRS/AFS) CRITERIA AND HAZARDOUS AIR POLLUTANT INVENTORY (Inventory of air pollution sources) Business SIC classification: CRUSHED AND BROKEN LIMESTONE Alternative names: NALLY & GIBSON QUARRIES
FRED LANHAM REALTY (HIGHWAY 55 AND HWY 458 in MOORESVILLE, KY)
(Resource Conservation and Recovery Act (tracking hazardous waste))
Housing units lacking complete plumbing facilities: 2.4% Housing units lacking complete kitchen facilities: 5.1%
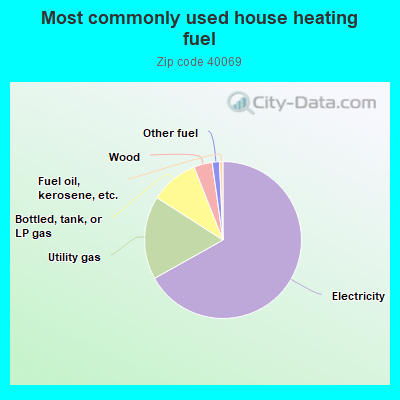
66.8%Electricity
17.2%Utility gas
9.9%Bottled, tank, or LP gas
3.8%Wood
1.5%Other fuel
0.7%Fuel oil, kerosene, etc.
Population in 1990: 6,314. Population change in the 1990s: +1,224 (+19.4%).
Place of birth for U.S.-born residents:
This state: 6,612
Northeast: 74
Midwest: 372
South: 256
West: 45
66% of the 40069 zip code residents lived in the same house 5 years ago. Out of people who lived in different houses, 58% lived in this county. Out of people who lived in different counties, 50% lived in Kentucky.
93% of the 40069 zip code residents lived in the same house 1 year ago. Out of people who lived in different houses, 54% moved from this county. Out of people who lived in different houses, 34% moved from different county within same state. Out of people who lived in different houses, 8% moved from different state. Out of people who lived in different houses, 4% moved from abroad.
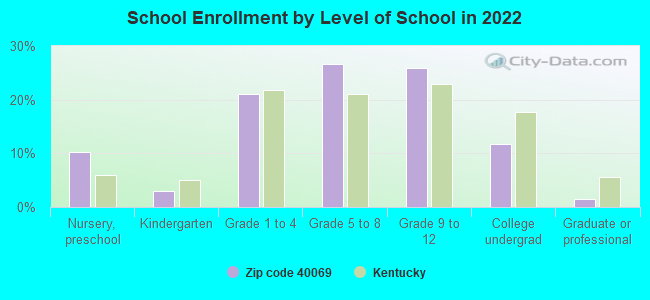
Private vs. public school enrollment:
Students in private schools in grades 1 to 8 (elementary and middle school): 111
Here:
14.7%
Kentucky:
17.2%
Students in private schools in grades 9 to 12 (high school): 57
Here:
13.8%
Kentucky:
15.2%
Students in private undergraduate colleges: 24
Here:
12.7%
Kentucky:
19.6%
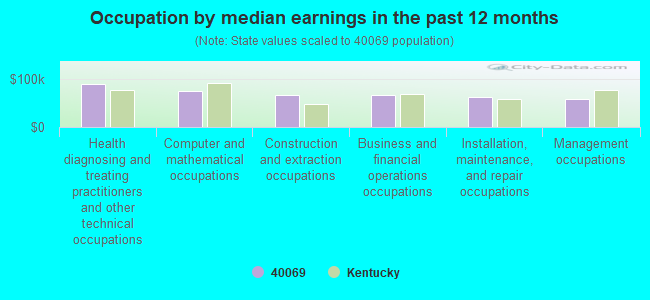
Occupation by median earnings in the past 12 months ($)
89,950Health diagnosing and treating practitioners and other technical occupations
76,453Computer and mathematical occupations
68,054Construction and extraction occupations
67,068Business and financial operations occupations
62,946Installation, maintenance, and repair occupations
58,613Management occupations
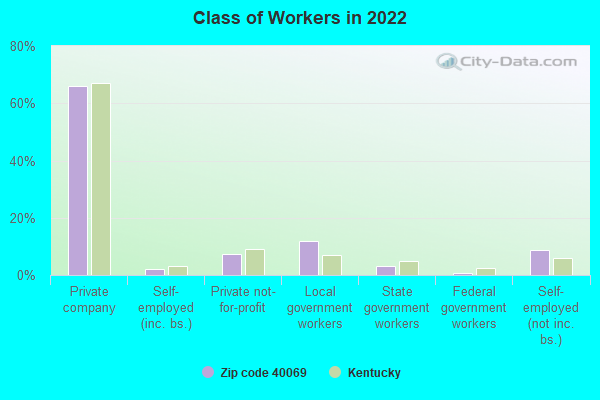
Top industries in this zip code by the number of employees in 2005:
Construction: Highway, Street, and Bridge Construction (50-99: 1, 20-49: 1)
Other Services (except Public Administration): Religious Organizations (20-49: 1, 10-19: 1, 5-9: 1, 1-4: 11)
Health Care and Social Assistance: Nursing Care Facilities (50-99: 1)
People in group quarters in 2010:
184 people in college/university student housing
123 people in nursing facilities/skilled-nursing facilities
53 people in other noninstitutional facilities
People in group quarters in 2000:
117 people in nursing homes
99 people in college dormitories (includes college quarters off campus)
55 people in religious group quarters
Fatal accident statistics in 2014:
Fatal accident count: 3
Vehicles involved in fatal accidents: 5
Fatal accidents caused by drunken drivers: 0
Fatalities: 3
Persons involved in fatal accidents: 5
Pedestrians involved in fatal accidents: 0
Fatal accident statistics in 2012:
Fatal accident count: 4
Vehicles involved in fatal accidents: 8
Fatal accidents caused by drunken drivers: 1
Fatalities: 4
Persons involved in fatal accidents: 16
Pedestrians involved in fatal accidents: 0
2002 - 2018 National Fire Incident Reporting System (NFIRS) incidents
Based on the data from the years 2002 - 2018 the average number of fire incidents per year is 38. The highest number of fires - 58 took place in 2010, and the least - 13 in 2002. The data has an increasing trend.
When looking into fire subcategories, the most incidents belonged to: Structure Fires (31.6%), and Outside Fires (31.0%).
Fire incident types reported to NFIRS in Zip Code 40069

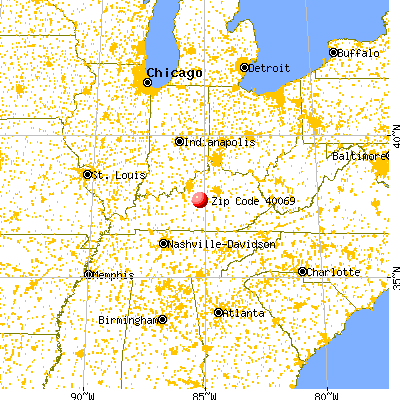


 Nearest zip codes: 40078, 40040, 40012, 40033, 40328, 40049.


 Based on the data from the years 2002 - 2018 the average number of fire incidents per year is 38. The highest number of fires - 58 took place in 2010, and the least - 13 in 2002. The data has an increasing trend.
 When looking into fire subcategories, the most incidents belonged to: Structure Fires (31.6%), and Outside Fires (31.0%).