Estimated zip code population in 2022: 922 Zip code population in 2010: 604 Zip code population in 2000: 484
March 2022 cost of living index in zip code 40152: 78.7 (low, U.S. average is 100)
Land area: 9.4 sq. mi. Water area: 2.1 sq. mi.
Population density: 98 people per square mile
(very low).
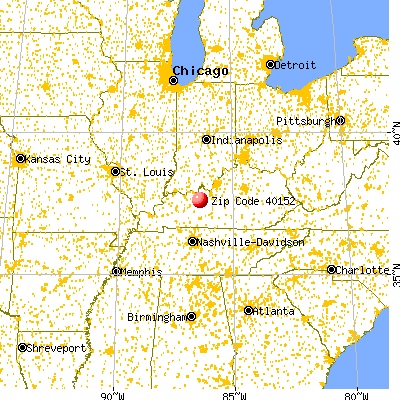
OSM Map
General Map
Google Map
MSN Map
OSM Map
General Map
Google Map
MSN Map
OSM Map
General Map
Google Map
MSN Map
OSM Map
General Map
Google Map
MSN Map
Please wait while loading the map...
Real estate property taxes paid for housing units in 2022:
This zip code:
0.6% ($1,186)
Kentucky:
0.7% ($1,456)
Median real estate property taxes paid for housing units with mortgages in 2022: $1,403 (0.7%) Median real estate property taxes paid for housing units with no mortgage in 2022: $1,050 (0.6%)
Business Search- 14 Million verified businesses
Males: 497
(53.9%)
Females: 424
(46.1%)
For population 25 years and over in 40152:
High school or higher: 86.1%
Bachelor's degree or higher: 24.1%
Graduate or professional degree: 7.1%
Mean travel time to work (commute): 44.3 minutes
For population 15 years and over in 40152:
Never married: 26.2%
Now married: 55.0%
Separated: 2.3%
Widowed: 4.3%
Divorced: 12.2%
Zip code 40152 compared to state average:
Unemployed percentage significantly below state average.
Black race population percentage significantly below state average.
Hispanic race population percentage significantly below state average.
Median age significantly above state average.
Foreign-born population percentage significantly below state average.
Renting percentage significantly below state average.
Length of stay since moving in above state average.
Number of college students significantly below state average.
Estimated median house/condo value in 2022: $185,986
40152:
$185,986
Kentucky:
$196,300
Median resident age:
This zip code:
57.0 years
Kentucky median age:
39.4 years
Average household size:
This zip code:
2.8 people
Kentucky:
2.4 people
Averages for the 2020 tax year for zip code 40152, filed in 2021:
Average Adjusted Gross Income (AGI) in 2020: $57,421 (Individual Income Tax Returns)
Here:
$57,421
State:
$61,342
Salary/wage: $46,222 (reported on 69.2% of returns)
Here:
$46,222
State:
$50,827
(% of AGI for various income ranges: 920.0% for AGIs below $25k, 2571.2% for AGIs $25k-50k, 3718.0% for AGIs $50k-75k, 15187.5% for AGIs $100k-200k)
Taxable interest for individuals: $670 (reported on 25.6% of returns)
This zip code:
$670
Kentucky:
$1,441
(% of AGI for various income ranges: 13.8% for AGIs $25k-50k, 24.0% for AGIs $50k-75k, 110.0% for AGIs $100k-200k)
Ordinary dividends: $1,200 (reported on 12.8% of returns)
Here:
$1,200
State:
$7,388
(% of AGI for various income ranges: 37.5% for AGIs $25k-50k)
Net capital gain/loss in AGI: +$3,500 (reported on 12.8% of returns)
Here:
+$3,500
State:
+$19,475
(% of AGI for various income ranges: )
Profit/loss from business: +$6,760 (reported on 12.8% of returns)
Here:
+$6,760
State:
+$11,386
(% of AGI for various income ranges: 217.0% for AGIs below $25k, 151.2% for AGIs $25k-50k)
Taxable individual retirement arrangement distribution: $23,600 (reported on 10.3% of returns)
40152:
$23,600
Kentucky:
$18,941
(% of AGI for various income ranges: 1888.0% for AGIs $50k-75k)
Earned income credit: $2,457 (reported on 17.9% of returns)
Here:
$2,457
State:
$2,336
(% of AGI for various income ranges: 116.0% for AGIs below $25k, 70.0% for AGIs $25k-50k)
Percentage of individuals using paid preparers for their 2020 taxes: 94.9%
Here:
95%
State:
94%
(% for various income ranges: 92.9% for AGIs below $25k, 100.0% for AGIs $25k-50k, 100.0% for AGIs $50k-75k, 100.0% for AGIs $75k-100k, 85.7% for AGIs $100k-200k)
Averages for the 2012 tax year for zip code 40152, filed in 2013:
Average Adjusted Gross Income (AGI) in 2012: $40,006 (Individual Income Tax Returns)
Here:
$40,006
State:
$50,814
Salary/wage: $36,059 (reported on 68.8% of returns)
Here:
$36,059
State:
$42,723
(% of AGI for various income ranges: 56.0% for AGIs below $25k, 61.4% for AGIs $25k-50k, 77.2% for AGIs $50k-75k, 50.0% for AGIs $75k-100k, 60.7% for AGIs $100k-200k)
Taxable interest for individuals: $520 (reported on 31.2% of returns)
This zip code:
$520
Kentucky:
$1,381
(% of AGI for various income ranges: 1.6% for AGIs below $25k, 0.6% for AGIs $25k-50k, 0.3% for AGIs $75k-100k)
Ordinary dividends: $525 (reported on 12.5% of returns)
Here:
$525
State:
$6,239
Net capital gain/loss in AGI: +$633 (reported on 9.4% of returns)
Here:
+$633
State:
+$11,336
Profit/loss from business: +$3,980 (reported on 15.6% of returns)
Here:
+$3,980
State:
+$10,862
Taxable individual retirement arrangement distribution: $9,250 (reported on 12.5% of returns)
40152:
$9,250
Kentucky:
$14,296
Total itemized deductions: $19,150 (26% of AGI, reported on 25.0% of returns)
Here:
$19,150
State:
$21,160
Here:
25.9% of AGI
State:
20.0% of AGI
(% of AGI for various income ranges: 25.9% for AGIs below $25k, 12.6% for AGIs $50k-75k, 30.5% for AGIs $75k-100k)
Charity contributions: $1,960 (reported on 15.6% of returns)
Here:
$1,960
State:
$4,303
Taxes paid: $4,988 (reported on 25.0% of returns)
40152:
$4,988
State:
$8,496
(% of AGI for various income ranges: 4.2% for AGIs below $25k, 3.6% for AGIs $50k-75k, 9.4% for AGIs $75k-100k)
Earned income credit: $2,014 (reported on 21.9% of returns)
Here:
$2,014
State:
$2,273
(% of AGI for various income ranges: 7.9% for AGIs below $25k)
Percentage of individuals using paid preparers for their 2012 taxes: 59.4%
Here:
59%
State:
60%
(% for various income ranges: 57.1% for AGIs below $25k, 57.1% for AGIs $25k-50k, 60.0% for AGIs $50k-75k, 133.3% for AGIs $75k-100k)
Averages for the 2004 tax year for zip code 40152, filed in 2005:
Average Adjusted Gross Income (AGI) in 2004: $34,058 (Individual Income Tax Returns)
Here:
$34,058
State:
$41,540
Salary/wage: $30,856 (reported on 71.1% of returns)
Here:
$30,856
State:
$36,432
(% of AGI for various income ranges: 66.5% for AGIs below $10k, 48.9% for AGIs $10k-25k, 68.5% for AGIs $25k-50k, 62.0% for AGIs $50k-75k, 130.5% for AGIs $75k-100k)
Taxable interest for individuals: $1,369 (reported on 41.5% of returns)
This zip code:
$1,369
Kentucky:
$1,571
(% of AGI for various income ranges: 1.6% for AGIs below $10k, 3.4% for AGIs $10k-25k, 0.3% for AGIs $25k-50k, 3.7% for AGIs $50k-75k, 0.7% for AGIs $75k-100k)
Taxable dividends: $634 (reported on 13.9% of returns)
Here:
$634
State:
$3,453
Net capital gain/loss: +$1,725 (reported on 13.6% of returns)
Here:
+$1,725
State:
+$9,663
Profit/loss from business: +$5,941 (reported on 17.3% of returns)
Here:
+$5,941
State:
+$9,233
Profit/loss from farming: +$4,727 (reported on 3.7% of returns)
Here:
+$4,727
State:
-$5,660
Total itemized deductions: $15,312 (26% of AGI, reported on 27.2% of returns)
Here:
$15,312
State:
$17,474
Here:
26.2% of AGI
State:
21.0% of AGI
(% of AGI for various income ranges: 12.4% for AGIs $10k-25k, 12.3% for AGIs $25k-50k, 11.0% for AGIs $50k-75k, 26.9% for AGIs $75k-100k)
Charity contributions deductions: $2,810 (5% of AGI, reported on 19.7% of returns)
Here:
$2,810
State:
$3,494
Here:
4.7% of AGI
State:
4.0% of AGI
Total tax: $4,241 (reported on 73.5% of returns)
40152:
$4,241
State:
$6,162
(% of AGI for various income ranges: 3.1% for AGIs below $10k, 5.0% for AGIs $10k-25k, 6.3% for AGIs $25k-50k, 8.3% for AGIs $50k-75k, 10.4% for AGIs $75k-100k, 18.4% for AGIs over 100k)
Earned income credit: $1,519 (reported on 17.7% of returns)
Here:
$1,519
State:
$1,723
Percentage of individuals using paid preparers for their 2004 taxes: 72.8%
Here:
73%
State:
66%
(% for various income ranges: 66.7% for AGIs below $10k, 77.4% for AGIs $10k-25k, 72.5% for AGIs $25k-50k, 67.4% for AGIs $50k-75k, 76.2% for AGIs $75k-100k, 90.9% for AGIs over 100k)
Household received Food Stamps/SNAP in the past 12 months: 31 Household did not receive Food Stamps/SNAP in the past 12 months: 294
Women who had a birth in the past 12 months: 22 (22 now married, 0 unmarried) Women who did not have a birth in the past 12 months: 101 (46 now married, 55 unmarried)
Housing units in zip code 40152 with a mortgage: 141 (8 second mortgage, 8 both second mortgage and home equity loan) Median monthly owner costs for units with a mortgage: $1,252 Median monthly owner costs for units without a mortgage: $373
Residents with income below the poverty level in 2022:
This zip code:
25.1%
Whole state:
16.5%
Residents with income below 50% of the poverty level in 2022:
This zip code:
20.6%
Whole state:
9.0%
Median number of rooms in houses and condos:
Here:
5.6
State:
6.4
Notable locations in this zip code not listed on our city pages
CAMP GREEN SHORES (EASTER SEALS CAMP) (BOX 74 AT ROUGH RIVER in MCDANIELS, KY)
(Resource Conservation and Recovery Act (tracking hazardous waste)) Business NAICS classification: RV (RECREATIONAL VEHICLE) PARKS AND CAMPGROUNDS. Organizations: KY EASTER SEALS SOCIETY, INC. (CONTACT/OWNER)
NICK BRONGERS BOAT DOCK INC (HIGHWAY 79 in MCDANIELS, KY)
(Resource Conservation and Recovery Act (tracking hazardous waste)) Organizations: SANDY BROWN (CONTACT/OWNER)
LASLIE'S COUNTRY STORE (HWY 259 in MCDANIELS, KY)
(Resource Conservation and Recovery Act (tracking hazardous waste)) Organizations: BOBBY PERKINS (CONTACT/OWNER)
MCDANIELS AUTO SALVAGE (HWY 259 in MC DANIELS, KY)
National Pollutant Discharge Elimination System NON-MAJOR (Tracking pollutant discharge elimination systems) - permit Business SIC classification: MOTOR VEHICLE PARTS, USED
Housing units lacking complete plumbing facilities: 6.9% Housing units lacking complete kitchen facilities: 6.9%
62.0%Electricity
30.5%Bottled, tank, or LP gas
8.0%Wood
Population in 1990: 44. Population change in the 1990s: +440 (+1000.0%).
Place of birth for U.S.-born residents:
This state: 735
Northeast: 7
Midwest: 150
South: 23
57% of the 40152 zip code residents lived in the same house 5 years ago. Out of people who lived in different houses, 36% lived in this county. Out of people who lived in different counties, 50% lived in Kentucky.
97% of the 40152 zip code residents lived in the same house 1 year ago. Out of people who lived in different houses, 109% moved from different county within same state.
Private vs. public school enrollment:
Students in private schools in grades 1 to 8 (elementary and middle school):
Here:
0.0%
Kentucky:
17.2%
Students in private schools in grades 9 to 12 (high school):
Here:
0.0%
Kentucky:
15.2%
Occupation by median earnings in the past 12 months ($)
44,612Material moving occupations
14,654Sales and related occupations
Companies with federal contracts located in this zip code (MC DANIELS, KY):
NANCY E HENNING (10362 SOUTH HWY 259; small business) : $288,310 in 3 contractsfrom 2005 to 2006
$132,405 with U.S. Army Corps of Engineers - civil program financing only for Construction of Structures and Facilities -- Highways, Roads, Streets, Bridges, and Railways (includes resurfacing). Signed on 2005-09-21. Completion date: 2005-09-30.
$132,405 with Army for Construction of Structures and Facilities -- Highways, Roads, Streets, Bridges, and Railways (includes resurfacing). Signed on 2005-09-21. Completion date: 2005-09-30.
$23,500 with Army for Landscaping/Groundskeeping Services. Signed on 2006-02-06. Completion date: 2006-09-30.
AUGUST HENNING CONSTRUCTION (10362 S HWY 259; small business) : $164,573 in 18 contractsfrom 2001 to 2005
Contracts for Construction of Structures and Facilities -- Recreation Facilities (Non-Building), Construction of Structures and Facilities -- Waste Treatment and Storage Facilities, Maintenance, Repair or Alteration of Real Property -- Recreation Facilities (Non-Building), Maintenance, Repair or Alteration of Real Property -- Sewage and Waste Facilities by Army, U.S. Army Corps of Engineers - civil program financing only Signed by year:2000: $0; 2001: $24,319; 2002: $0; 2003: $6,740; 2004: $56,300; 2005: $77,214; 2006: $0.
Biggest contracts:
$24,672 with Army for Construction of Structures and Facilities -- Recreation Facilities (Non-Building). Signed on 2005-07-08. Completion date: 2005-09-30.
$24,672 with U.S. Army Corps of Engineers - civil program financing only for Construction of Structures and Facilities -- Recreation Facilities (Non-Building). Signed on 2005-07-08. Completion date: 2005-09-30.
$24,319 with U.S. Army Corps of Engineers - civil program financing only for Construction of Structures and Facilities -- Waste Treatment and Storage Facilities. Signed on 2001-08-13. Completion date: 2001-09-22.
$17,000 with Army for Construction of Structures and Facilities -- Recreation Facilities (Non-Building). Signed on 2005-08-31. Completion date: 2005-09-30.
PRO-TECH AUTO & MARINE, INC (425 SOUTH HWY 79; small business)
$8,232 with Army for Miscellaneous Engines and Components. Signed on 2005-02-09. Completion date: 2005-02-28.
PAULIE''S MARINE SALES (HWY #79; small business) : $985 in 9 contractsfrom 2003 to 2006
Contracts for Lease or Rental of Facilities -- Open Storage Facilities by Army, U.S. Army Corps of Engineers - civil program financing only Signed by year:2000: $0; 2001: $0; 2002: $0; 2003: $300; 2004: $600; 2005: $0; 2006: $85.
Biggest contracts:
$150 with Army for Lease or Rental of Facilities -- Open Storage Facilities. Signed on 2004-10-25. Completion date: 2005-09-30.
$150 with U.S. Army Corps of Engineers - civil program financing only for Lease or Rental of Facilities -- Open Storage Facilities. Signed on 2004-10-25. Completion date: 2005-09-30.
$150 with Army for Lease or Rental of Facilities -- Open Storage Facilities. Signed on 2004-09-02. Completion date: 2005-09-30.
$150, same as above.Signed on 2003-10-06. Completion date: 2004-09-30.
Top industries in this zip code by the number of employees in 2005:
Construction: New Single-Family Housing Construction (except Operative Builders) (5-9: 1)
Other Services (except Public Administration): Religious Organizations (5-9: 1)
Construction: Site Preparation Contractors (5-9: 1)
Accommodation and Food Services: Limited-Service Restaurants (5-9: 1)
Construction: Flooring Contractors (5-9: 1)
Arts, Entertainment, and Recreation: Marinas (1-4: 1)
Other Services (except Public Administration): General Automotive Repair (1-4: 1)
Fatal accident statistics in 2014:
Fatal accident count: 1
Vehicles involved in fatal accidents: 1
Fatal accidents caused by drunken drivers: 0
Fatalities: 1
Persons involved in fatal accidents: 1
Pedestrians involved in fatal accidents: 0
Fatal accident statistics in 2013:
Fatal accident count: 1
Vehicles involved in fatal accidents: 2
Fatal accidents caused by drunken drivers: 0
Fatalities: 1
Persons involved in fatal accidents: 3
Pedestrians involved in fatal accidents: 0
2002 - 2018 National Fire Incident Reporting System (NFIRS) incidents
According to the data from the years 2002 - 2018 the average number of fire incidents per year is 9. The highest number of reported fire incidents - 26 took place in 2011, and the least - 1 in 2009. The data has an increasing trend.
When looking into fire subcategories, the most incidents belonged to: Outside Fires (47.3%), and Structure Fires (41.3%).
Fire incident types reported to NFIRS in Zip Code 40152


+$4,727
-$5,660
 Nearest zip codes: 40178, 40119, 40145, 40144, 42762, 40143.


 (Students: 174, Location: 13598 S. HWY 259, Grades: PK-5)


 According to the data from the years 2002 - 2018 the average number of fire incidents per year is 9. The highest number of reported fire incidents - 26 took place in 2011, and the least - 1 in 2009. The data has an increasing trend.
 When looking into fire subcategories, the most incidents belonged to: Outside Fires (47.3%), and Structure Fires (41.3%).