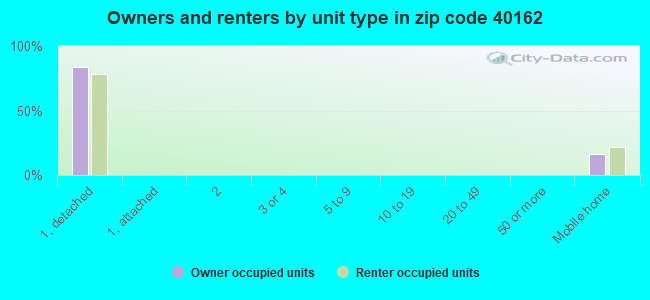
Estimated zip code population in 2022: 5,677 Zip code population in 2010: 6,056 Zip code population in 2000: 4,211
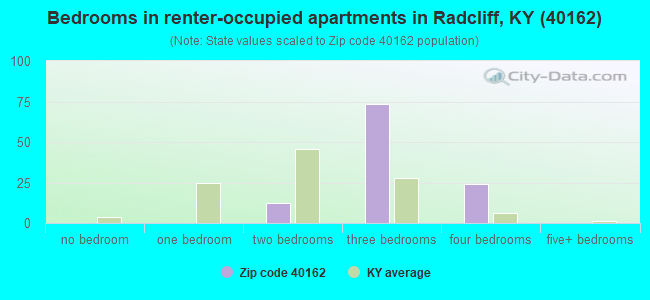
Houses and condos: 2,121 Renter-occupied apartments: 116
% of renters here:
6%
State:
31%
March 2022 cost of living index in zip code 40162: 83.2 (low, U.S. average is 100)
Land area: 56.4 sq. mi. Water area: 0.5 sq. mi.
Population density: 101 people per square mile
(very low).
OSM Map
General Map
Google Map
MSN Map
OSM Map
General Map
Google Map
MSN Map
OSM Map
General Map
Google Map
MSN Map
OSM Map
General Map
Google Map
MSN Map
Please wait while loading the map...
Real estate property taxes paid for housing units in 2022:
This zip code:
0.7% ($1,691)
Kentucky:
0.7% ($1,456)
Median real estate property taxes paid for housing units with mortgages in 2022: $1,736 (0.7%) Median real estate property taxes paid for housing units with no mortgage in 2022: $1,528 (0.6%)
Averages for the 2020 tax year for zip code 40162, filed in 2021:
Average Adjusted Gross Income (AGI) in 2020: $62,909 (Individual Income Tax Returns)
Here:
$62,909
State:
$61,342
Salary/wage: $53,943 (reported on 85.1% of returns)
Here:
$53,943
State:
$50,827
(% of AGI for various income ranges: 1157.0% for AGIs below $25k, 3225.7% for AGIs $25k-50k, 5791.7% for AGIs $50k-75k, 8486.8% for AGIs $75k-100k, 16341.5% for AGIs $100k-200k)
Taxable interest for individuals: $963 (reported on 26.0% of returns)
This zip code:
$963
Kentucky:
$1,441
(% of AGI for various income ranges: 10.0% for AGIs below $25k, 23.5% for AGIs $25k-50k, 33.7% for AGIs $50k-75k, 27.9% for AGIs $75k-100k, 83.3% for AGIs $100k-200k)
Ordinary dividends: $1,983 (reported on 12.1% of returns)
Here:
$1,983
State:
$7,388
(% of AGI for various income ranges: 6.3% for AGIs below $25k, 16.3% for AGIs $25k-50k, 26.0% for AGIs $50k-75k, 30.0% for AGIs $75k-100k, 66.4% for AGIs $100k-200k)
Net capital gain/loss in AGI: +$8,015 (reported on 11.8% of returns)
Here:
+$8,015
State:
+$19,475
(% of AGI for various income ranges: 6.3% for AGIs below $25k, 18.7% for AGIs $25k-50k, 21.7% for AGIs $50k-75k, 56.1% for AGIs $75k-100k, 203.3% for AGIs $100k-200k)
Profit/loss from business: +$7,680 (reported on 12.1% of returns)
Here:
+$7,680
State:
+$11,386
(% of AGI for various income ranges: 30.0% for AGIs below $25k, 70.0% for AGIs $25k-50k, 199.1% for AGIs $50k-75k, 172.5% for AGIs $75k-100k, 281.5% for AGIs $100k-200k)
Taxable individual retirement arrangement distribution: $15,132 (reported on 6.6% of returns)
40162:
$15,132
Kentucky:
$18,941
(% of AGI for various income ranges: 44.0% for AGIs below $25k, 52.4% for AGIs $25k-50k, 133.1% for AGIs $50k-75k, 116.4% for AGIs $75k-100k, 456.1% for AGIs $100k-200k)
Total itemized deductions: $26,300 (reported on 4.2% of returns)
Here:
$26,300
State:
$32,473
(% of AGI for various income ranges: 183.4% for AGIs $50k-75k, 171.1% for AGIs $75k-100k, 616.7% for AGIs $100k-200k)
Charity contributions: $9,230 (reported on 3.5% of returns)
Here:
$9,230
State:
$13,472
(% of AGI for various income ranges: 84.9% for AGIs $50k-75k, 189.7% for AGIs $100k-200k)
Taxes paid: $6,908 (reported on 4.2% of returns)
40162:
$6,908
State:
$7,830
(% of AGI for various income ranges: 35.1% for AGIs $50k-75k, 50.4% for AGIs $75k-100k, 171.2% for AGIs $100k-200k)
Earned income credit: $2,305 (reported on 14.5% of returns)
Here:
$2,305
State:
$2,336
(% of AGI for various income ranges: 81.6% for AGIs below $25k, 78.0% for AGIs $25k-50k)
Percentage of individuals using paid preparers for their 2020 taxes: 96.2%
Here:
96%
State:
94%
(% for various income ranges: 95.2% for AGIs below $25k, 96.9% for AGIs $25k-50k, 97.8% for AGIs $50k-75k, 94.4% for AGIs $75k-100k, 96.3% for AGIs $100k-200k, 100.0% for AGIs over 200k)
Averages for the 2012 tax year for zip code 40162, filed in 2013:
Average Adjusted Gross Income (AGI) in 2012: $52,413 (Individual Income Tax Returns)
Here:
$52,413
State:
$50,814
Salary/wage: $46,741 (reported on 87.7% of returns)
Here:
$46,741
State:
$42,723
(% of AGI for various income ranges: 79.9% for AGIs below $25k, 80.3% for AGIs $25k-50k, 79.1% for AGIs $50k-75k, 80.4% for AGIs $75k-100k, 80.5% for AGIs $100k-200k, 46.6% for AGIs over 200k)
Taxable interest for individuals: $857 (reported on 33.3% of returns)
This zip code:
$857
Kentucky:
$1,381
(% of AGI for various income ranges: 1.1% for AGIs below $25k, 0.6% for AGIs $25k-50k, 0.6% for AGIs $50k-75k, 0.3% for AGIs $75k-100k, 0.6% for AGIs $100k-200k)
Ordinary dividends: $1,179 (reported on 13.0% of returns)
Here:
$1,179
State:
$6,239
(% of AGI for various income ranges: 0.4% for AGIs below $25k, 0.2% for AGIs $25k-50k, 0.2% for AGIs $50k-75k, 0.4% for AGIs $75k-100k, 0.3% for AGIs $100k-200k)
Net capital gain/loss in AGI: +$3,642 (reported on 11.9% of returns)
Here:
+$3,642
State:
+$11,336
(% of AGI for various income ranges: 0.1% for AGIs below $25k, 0.5% for AGIs $25k-50k, 0.2% for AGIs $50k-75k, 0.4% for AGIs $75k-100k, 2.1% for AGIs $100k-200k)
Profit/loss from business: +$6,347 (reported on 12.3% of returns)
Here:
+$6,347
State:
+$10,862
(% of AGI for various income ranges: 4.4% for AGIs below $25k, 1.7% for AGIs $25k-50k, 1.9% for AGIs $50k-75k, 1.4% for AGIs $75k-100k, 0.6% for AGIs $100k-200k)
Taxable individual retirement arrangement distribution: $12,094 (reported on 6.1% of returns)
40162:
$12,094
Kentucky:
$14,296
(% of AGI for various income ranges: 1.1% for AGIs below $25k, 1.9% for AGIs $25k-50k, 1.6% for AGIs $50k-75k, 1.0% for AGIs $75k-100k, 1.7% for AGIs $100k-200k)
Total itemized deductions: $18,019 (21% of AGI, reported on 34.5% of returns)
Here:
$18,019
State:
$21,160
Here:
21.1% of AGI
State:
20.0% of AGI
(% of AGI for various income ranges: 7.1% for AGIs below $25k, 8.6% for AGIs $25k-50k, 11.9% for AGIs $50k-75k, 13.9% for AGIs $75k-100k, 13.3% for AGIs $100k-200k, 12.3% for AGIs over 200k)
Charity contributions: $3,138 (reported on 26.1% of returns)
Here:
$3,138
State:
$4,303
(% of AGI for various income ranges: 0.7% for AGIs below $25k, 0.8% for AGIs $25k-50k, 1.5% for AGIs $50k-75k, 2.0% for AGIs $75k-100k, 1.8% for AGIs $100k-200k, 1.9% for AGIs over 200k)
Taxes paid: $6,099 (reported on 34.5% of returns)
40162:
$6,099
State:
$8,496
(% of AGI for various income ranges: 1.5% for AGIs below $25k, 2.0% for AGIs $25k-50k, 3.5% for AGIs $50k-75k, 4.5% for AGIs $75k-100k, 5.3% for AGIs $100k-200k, 6.6% for AGIs over 200k)
Earned income credit: $2,193 (reported on 17.6% of returns)
Here:
$2,193
State:
$2,273
(% of AGI for various income ranges: 7.0% for AGIs below $25k, 1.3% for AGIs $25k-50k)
Percentage of individuals using paid preparers for their 2012 taxes: 53.6%
Here:
54%
State:
60%
(% for various income ranges: 50.0% for AGIs below $25k, 58.6% for AGIs $25k-50k, 54.3% for AGIs $50k-75k, 48.6% for AGIs $75k-100k, 58.1% for AGIs $100k-200k, 66.7% for AGIs over 200k)
Averages for the 2004 tax year for zip code 40162, filed in 2005:
Average Adjusted Gross Income (AGI) in 2004: $40,529 (Individual Income Tax Returns)
Here:
$40,529
State:
$41,540
Salary/wage: $38,002 (reported on 89.2% of returns)
Here:
$38,002
State:
$36,432
(% of AGI for various income ranges: 117.9% for AGIs below $10k, 77.1% for AGIs $10k-25k, 84.0% for AGIs $25k-50k, 85.0% for AGIs $50k-75k, 85.2% for AGIs $75k-100k, 78.0% for AGIs over 100k)
Taxable interest for individuals: $1,035 (reported on 44.1% of returns)
This zip code:
$1,035
Kentucky:
$1,571
(% of AGI for various income ranges: 3.8% for AGIs below $10k, 1.4% for AGIs $10k-25k, 0.8% for AGIs $25k-50k, 0.9% for AGIs $50k-75k, 0.8% for AGIs $75k-100k, 2.0% for AGIs over 100k)
Taxable dividends: $652 (reported on 16.1% of returns)
Here:
$652
State:
$3,453
(% of AGI for various income ranges: 0.2% for AGIs below $10k, 0.3% for AGIs $10k-25k, 0.1% for AGIs $25k-50k, 0.4% for AGIs $50k-75k, 0.1% for AGIs $75k-100k, 0.4% for AGIs over 100k)
Net capital gain/loss: +$3,663 (reported on 12.6% of returns)
Here:
+$3,663
State:
+$9,663
(% of AGI for various income ranges: -0.2% for AGIs below $10k, -0.0% for AGIs $10k-25k, 0.3% for AGIs $25k-50k, 1.2% for AGIs $50k-75k, 0.5% for AGIs $75k-100k, 3.8% for AGIs over 100k)
Profit/loss from business: +$5,270 (reported on 12.7% of returns)
Here:
+$5,270
State:
+$9,233
(% of AGI for various income ranges: 11.7% for AGIs below $10k, 3.7% for AGIs $10k-25k, 2.1% for AGIs $25k-50k, 1.0% for AGIs $50k-75k, 0.6% for AGIs $75k-100k, 1.1% for AGIs over 100k)
IRA payment deduction: $2,714 (reported on 2.2% of returns)
40162:
$2,714
Kentucky:
$2,955
Total itemized deductions: $14,879 (23% of AGI, reported on 35.6% of returns)
Here:
$14,879
State:
$17,474
Here:
22.5% of AGI
State:
21.0% of AGI
(% of AGI for various income ranges: 10.2% for AGIs below $10k, 6.7% for AGIs $10k-25k, 10.3% for AGIs $25k-50k, 15.0% for AGIs $50k-75k, 15.5% for AGIs $75k-100k, 14.4% for AGIs over 100k)
Charity contributions deductions: $2,438 (4% of AGI, reported on 30.4% of returns)
Here:
$2,438
State:
$3,494
Here:
3.6% of AGI
State:
4.0% of AGI
(% of AGI for various income ranges: 0.6% for AGIs below $10k, 0.9% for AGIs $10k-25k, 1.3% for AGIs $25k-50k, 1.8% for AGIs $50k-75k, 2.5% for AGIs $75k-100k, 2.4% for AGIs over 100k)
Total tax: $4,250 (reported on 76.2% of returns)
40162:
$4,250
State:
$6,162
(% of AGI for various income ranges: 3.1% for AGIs below $10k, 3.7% for AGIs $10k-25k, 5.8% for AGIs $25k-50k, 7.2% for AGIs $50k-75k, 9.4% for AGIs $75k-100k, 14.4% for AGIs over 100k)
Earned income credit: $1,708 (reported on 15.1% of returns)
Here:
$1,708
State:
$1,723
Percentage of individuals using paid preparers for their 2004 taxes: 65.6%
Here:
66%
State:
66%
(% for various income ranges: 54.1% for AGIs below $10k, 68.4% for AGIs $10k-25k, 70.5% for AGIs $25k-50k, 65.5% for AGIs $50k-75k, 65.7% for AGIs $75k-100k, 70.9% for AGIs over 100k)
Likely homosexual households (counted as self-reported same-sex unmarried-partner households)
Lesbian couples: 0.6% of all households
Gay men: 0.0% of all households
Household received Food Stamps/SNAP in the past 12 months: 160 Household did not receive Food Stamps/SNAP in the past 12 months: 1,901
Women who had a birth in the past 12 months: 95 (14 now married, 84 unmarried) Women who did not have a birth in the past 12 months: 1,068 (752 now married, 322 unmarried)
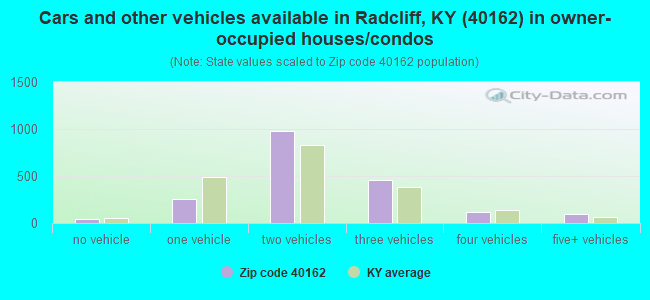
Housing units in zip code 40162 with a mortgage: 1,303 (45 second mortgage, 35 both second mortgage and home equity loan) Houses without a mortgage: 89
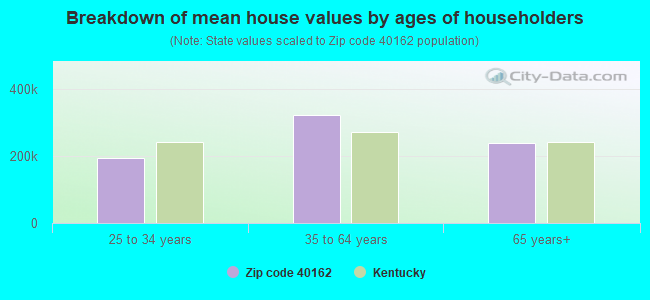
Median monthly owner costs for units with a mortgage: $1,335 Median monthly owner costs for units without a mortgage: $451
Residents with income below the poverty level in 2022:
This zip code:
6.8%
Whole state:
16.5%
Residents with income below 50% of the poverty level in 2022:
This zip code:
1.9%
Whole state:
9.0%
Median number of rooms in houses and condos:
Here:
6.8
State:
6.4
Median number of rooms in apartments:
Here:
6.1
State:
4.4
Notable locations in this zip code not listed on our city pages
Churches in zip code 40162 include: Grandview Church (A), Holbert Church (B), Pleasantview Church (C), Ridge Springs United Methodist Church (D). Display/hide their locations on the map
Cemeteries: Mays Grove Cemetery (1), Yates Cemetery (2), Martin Cemetery (3), Ridge Spring Cemetery (4), Arms Cemetery (5), Miller Cemetery (6), Lewis Cemetery (7). Display/hide their locations on the map
Size of family households: 683 2-persons, 416 3-persons, 221 4-persons, 90 5-persons, 91 6-persons, 56 7-or-more-persons
Size of nonfamily households: 412 1-person, 87 2-persons
1,088 married couples with children.
47 single-parent households (47 women).
92.1% of residents of 40162 zip code speak English at home.
0.4% of residents speak Spanish at home (100% very well).
6.4% of residents speak other Indo-European language at home (83% very well, 17% well).
1.0% of residents speak Asian or Pacific Island language at home (80% very well, 20% not well).
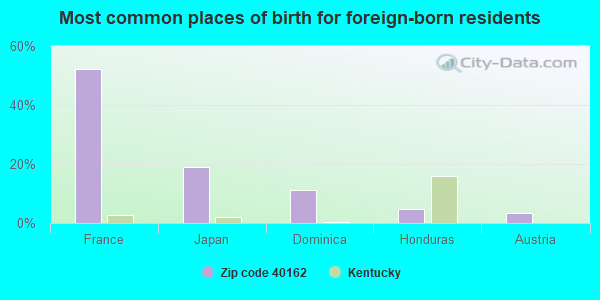
Foreign born population: 206 (3.6%) (55.0% of them are naturalized citizens)
This zip code:
3.6%
Whole state:
4.0%
52%France
19%Japan
11%Dominica
5%Honduras
3%Austria
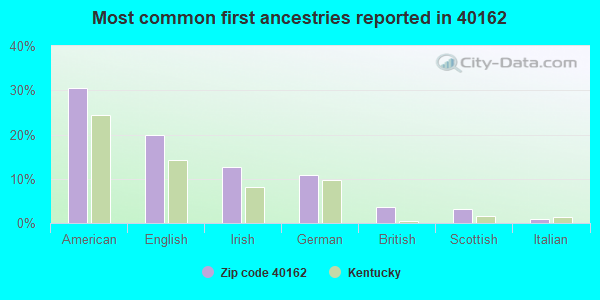
31%American
20%English
13%Irish
11%German
4%British
3%Scottish
1%Italian
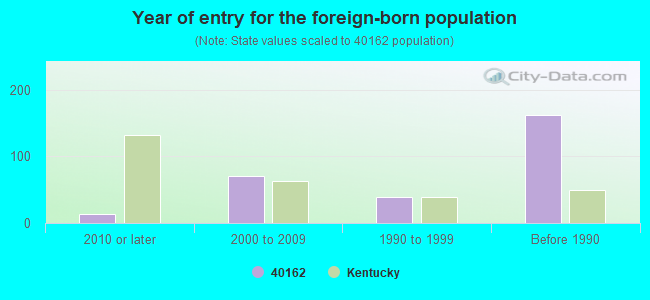
Year of entry for the foreign-born population
142010 or later
702000 to 2009
391990 to 1999
162Before 1990
Facilities with environmental interests located in this zip code:
RINEYVILLE ELEMENTARY SCHOOL (275 RINEYVILLE SCHOOL RD in RINEYVILLE, KY)
(National Center for Education Statistics) - STATE ID-047231090 Organizations: HARDIN COUNTY (SCHOOL DISTRICT)
SAGEBRUSH (KY HWY 220 in RINEYVILLE, KY)
National Pollutant Discharge Elimination System NON-MAJOR (Tracking pollutant discharge elimination systems) - permit Business SIC classification: MANAGEMENT SERVICES
HEARTLAND MOBILE HOME COMM (1451 DECKARD SCHOOL RD in RINEYVILLE, KY)
National Pollutant Discharge Elimination System NON-MAJOR (Tracking pollutant discharge elimination systems) - permit Business SIC classification: OPERATORS OF RESIDENTIAL MOBILE HOME SITES
70.4%Electricity
12.3%Bottled, tank, or LP gas
10.1%Utility gas
3.5%Wood
3.2%Fuel oil, kerosene, etc.
0.6%No fuel used
Population in 1990: 4,542.
Place of birth for U.S.-born residents:
This state: 3,371
Northeast: 474
Midwest: 373
South: 907
West: 286
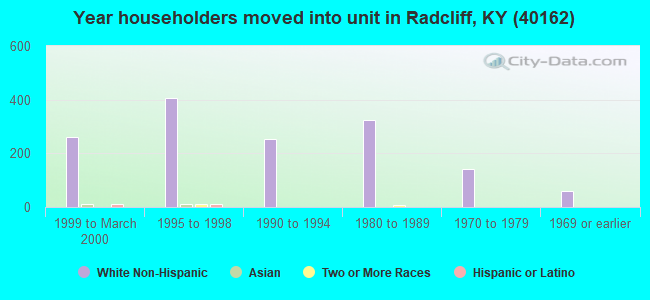
62% of the 40162 zip code residents lived in the same house 5 years ago. Out of people who lived in different houses, 59% lived in this county. Out of people who lived in different counties, 50% lived in Kentucky.
96% of the 40162 zip code residents lived in the same house 1 year ago. Out of people who lived in different houses, 23% moved from this county. Out of people who lived in different houses, 50% moved from different county within same state. Out of people who lived in different houses, 36% moved from different state.
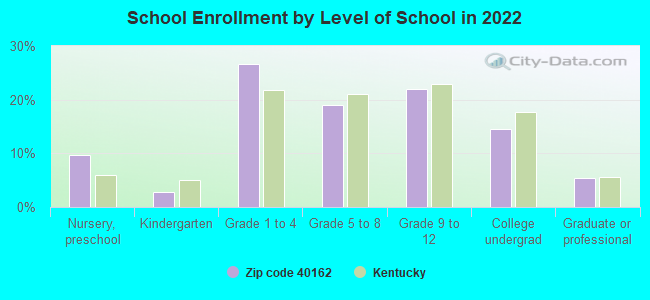
Private vs. public school enrollment:
Students in private schools in grades 1 to 8 (elementary and middle school): 99
Here:
19.2%
Kentucky:
17.2%
Students in private schools in grades 9 to 12 (high school): 13
Here:
5.3%
Kentucky:
15.2%
Students in private undergraduate colleges:
Here:
0.0%
Kentucky:
19.6%
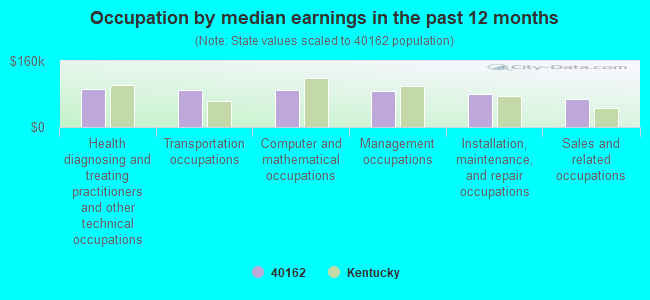
Occupation by median earnings in the past 12 months ($)
91,418Health diagnosing and treating practitioners and other technical occupations
90,872Transportation occupations
88,906Computer and mathematical occupations
88,332Management occupations
78,977Installation, maintenance, and repair occupations
67,428Sales and related occupations
Companies with federal contracts located in this zip code (RINEYVILLE, KY):
GEIS,KIMBERLY (102 CATLETT COURT; small business) : $262,004 in 9 contractsfrom 2003 to 2005
Contracts for Nursing Services by Army Signed by year:2000: $0; 2001: $0; 2002: $0; 2003: $52,216; 2004: $141,236; 2005: $68,552; 2006: $0.
Biggest contracts:
$101,366 with Army for Nursing Services. Signed on 2005-10-05. Completion date: 2005-09-30.
$101,216, same as above.Signed on 2004-10-06. Completion date: 2005-09-30.
$52,216, same as above.Signed on 2003-11-21. Completion date: 2004-05-21.
$28,720, same as above.Signed on 2004-06-22. Completion date: 2004-09-30.
W H F INC (860 SALEM SCHOOL ROAD; small business) : $248,612 in 2 contractsfrom 2000 to 2001
$150,620 with Army for Maintenance, Repair or Alteration of Real Property -- Miscellaneous Buildings. Signed on 2001-01-05. Completion date: 2001-07-31.
$97,992, same as above.Signed on 2000-04-10. Completion date: 2000-07-31.
BARBARA J JENKINS (102 DEFEW AVE; small business)
$32,750 with Army for Other Education and Training Services. Signed on 1999-10-05. Completion date: 2000-09-30.
SARA ONUFRAK (689 FLUSHING MEADOW DR; small business)
$27,210 with Army for Other Medical Services. Signed on 2006-01-13. Completion date: 2006-09-30.
WOODSHED, THE (6085 RINEYVILLE RD; small business)
$9,137 with Army for Office Furniture. Signed on 2004-07-15. Completion date: 2004-08-27.
Top industries in this zip code by the number of employees in 2005:
Accommodation and Food Services: Hotels (except Casino Hotels) and Motels (20-49 employees: 1 establishment)
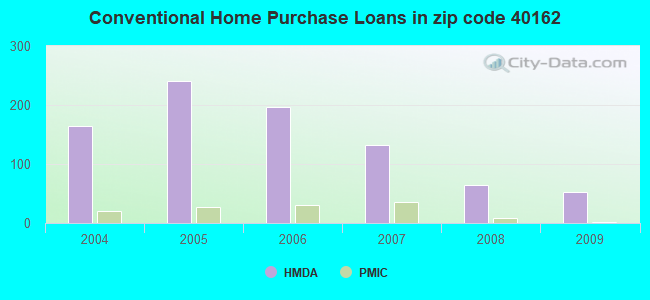
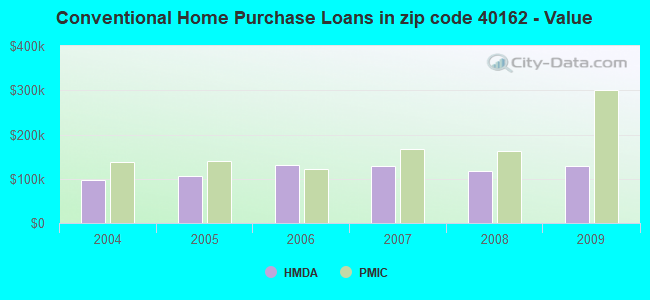
Detailed PMIC statistics for the following Tracts:0009.01
2002 - 2018 National Fire Incident Reporting System (NFIRS) incidents
According to the data from the years 2002 - 2018 the average number of fires per year is 22. The highest number of fire incidents - 50 took place in 2014, and the least - 4 in 2006. The data has a growing trend.
When looking into fire subcategories, the most incidents belonged to: Structure Fires (46.1%), and Outside Fires (35.5%).
Fire incident types reported to NFIRS in Zip Code 40162

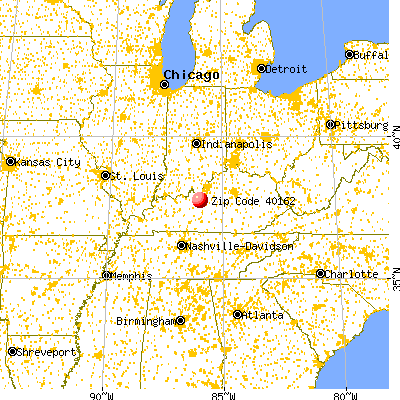


 Nearest zip codes: 40175, 42724, 40160, 40117, 40115, 42732.


 According to the data from the years 2002 - 2018 the average number of fires per year is 22. The highest number of fire incidents - 50 took place in 2014, and the least - 4 in 2006. The data has a growing trend.
 When looking into fire subcategories, the most incidents belonged to: Structure Fires (46.1%), and Outside Fires (35.5%).