Estimated zip code population in 2022: 7,094 Zip code population in 2010: 6,564 Zip code population in 2000: 6,026
Houses and condos: 3,217 Renter-occupied apartments: 1,009
% of renters here:
35%
State:
31%
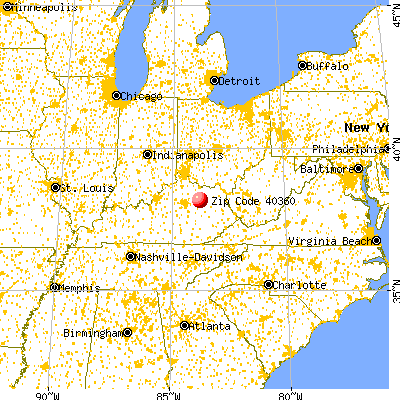
March 2022 cost of living index in zip code 40360: 80.4 (low, U.S. average is 100)
Land area: 146.5 sq. mi. Water area: 0.4 sq. mi.
Population density: 48 people per square mile
(very low).
OSM Map
General Map
Google Map
MSN Map
OSM Map
General Map
Google Map
MSN Map
OSM Map
General Map
Google Map
MSN Map
OSM Map
General Map
Google Map
MSN Map
Please wait while loading the map...
Real estate property taxes paid for housing units in 2022:
This zip code:
0.6% ($702)
Kentucky:
0.7% ($1,456)
Median real estate property taxes paid for housing units with mortgages in 2022: $809 (0.6%) Median real estate property taxes paid for housing units with no mortgage in 2022: $510 (0.5%)
Business Search- 14 Million verified businesses
Males: 3,472
(48.9%)
Females: 3,622
(51.1%)
For population 25 years and over in 40360:
High school or higher: 83.0%
Bachelor's degree or higher: 16.9%
Graduate or professional degree: 6.7%
Unemployed: 2.8%
Mean travel time to work (commute): 27.1 minutes
For population 15 years and over in 40360:
Never married: 27.1%
Now married: 55.0%
Separated: 2.0%
Widowed: 4.9%
Divorced: 10.9%
Zip code 40360 compared to state average:
Median house value below state average.
Black race population percentage significantly below state average.
Hispanic race population percentage significantly below state average.
Foreign-born population percentage significantly below state average.
Length of stay since moving in significantly above state average.
Number of college students below state average.
Percentage of population with a bachelor's degree or higher below state average.
Estimated median house/condo value in 2022: $115,340
40360:
$115,340
Kentucky:
$196,300
According to our research of Kentucky and other state lists, there were 18 registered sex offenders living in 40360 zip code as of May 28, 2024. The ratio of all residents to sex offenders in zip code 40360 is 377 to 1. The ratio of registered sex offenders to all residents in this zip code is near the state average.
Median resident age:
This zip code:
40.3 years
Kentucky median age:
39.4 years
Average household size:
This zip code:
2.4 people
Kentucky:
2.4 people
Averages for the 2020 tax year for zip code 40360, filed in 2021:
Average Adjusted Gross Income (AGI) in 2020: $43,659 (Individual Income Tax Returns)
Here:
$43,659
State:
$61,342
Salary/wage: $40,343 (reported on 80.6% of returns)
Here:
$40,343
State:
$50,827
(% of AGI for various income ranges: 1173.4% for AGIs below $25k, 3643.9% for AGIs $25k-50k, 6655.7% for AGIs $50k-75k, 10254.7% for AGIs $75k-100k, 18279.3% for AGIs $100k-200k)
Taxable interest for individuals: $1,261 (reported on 21.1% of returns)
This zip code:
$1,261
Kentucky:
$1,441
(% of AGI for various income ranges: 8.6% for AGIs below $25k, 21.4% for AGIs $25k-50k, 41.0% for AGIs $50k-75k, 66.0% for AGIs $75k-100k, 242.1% for AGIs $100k-200k)
Ordinary dividends: $2,188 (reported on 5.5% of returns)
Here:
$2,188
State:
$7,388
(% of AGI for various income ranges: 7.0% for AGIs below $25k, 8.9% for AGIs $25k-50k, 3.7% for AGIs $50k-75k, 29.3% for AGIs $75k-100k, 128.6% for AGIs $100k-200k)
Net capital gain/loss in AGI: +$9,176 (reported on 7.3% of returns)
Here:
+$9,176
State:
+$19,475
(% of AGI for various income ranges: 9.0% for AGIs below $25k, 40.3% for AGIs $25k-50k, 19.7% for AGIs $50k-75k, 222.7% for AGIs $75k-100k, 857.9% for AGIs $100k-200k)
Profit/loss from business: +$9,656 (reported on 18.0% of returns)
Here:
+$9,656
State:
+$11,386
(% of AGI for various income ranges: 275.5% for AGIs below $25k, 150.5% for AGIs $25k-50k, 156.3% for AGIs $50k-75k, 397.3% for AGIs $75k-100k, 504.3% for AGIs $100k-200k)
Taxable individual retirement arrangement distribution: $12,833 (reported on 5.2% of returns)
40360:
$12,833
Kentucky:
$18,941
(% of AGI for various income ranges: 26.1% for AGIs below $25k, 60.5% for AGIs $25k-50k, 128.0% for AGIs $50k-75k, 162.0% for AGIs $75k-100k, 495.7% for AGIs $100k-200k)
Total itemized deductions: $24,225 (reported on 1.4% of returns)
Here:
$24,225
State:
$32,473
(% of AGI for various income ranges: 323.0% for AGIs $50k-75k)
Charity contributions: $6,200 (reported on 0.7% of returns)
Here:
$6,200
State:
$13,472
(% of AGI for various income ranges: 19.4% for AGIs $25k-50k)
Taxes paid: $5,000 (reported on 1.4% of returns)
40360:
$5,000
State:
$7,830
(% of AGI for various income ranges: 66.7% for AGIs $50k-75k)
Earned income credit: $2,444 (reported on 25.3% of returns)
Here:
$2,444
State:
$2,336
(% of AGI for various income ranges: 133.9% for AGIs below $25k, 105.2% for AGIs $25k-50k)
Percentage of individuals using paid preparers for their 2020 taxes: 95.8%
Here:
96%
State:
94%
(% for various income ranges: 96.6% for AGIs below $25k, 96.3% for AGIs $25k-50k, 95.2% for AGIs $50k-75k, 91.7% for AGIs $75k-100k, 104.5% for AGIs $100k-200k, 0.0% for AGIs over 200k)
Averages for the 2012 tax year for zip code 40360, filed in 2013:
Average Adjusted Gross Income (AGI) in 2012: $35,831 (Individual Income Tax Returns)
Here:
$35,831
State:
$50,814
Salary/wage: $33,453 (reported on 82.6% of returns)
Here:
$33,453
State:
$42,723
(% of AGI for various income ranges: 74.7% for AGIs below $25k, 81.8% for AGIs $25k-50k, 79.6% for AGIs $50k-75k, 76.8% for AGIs $75k-100k, 70.6% for AGIs $100k-200k)
Taxable interest for individuals: $1,273 (reported on 24.2% of returns)
This zip code:
$1,273
Kentucky:
$1,381
(% of AGI for various income ranges: 1.3% for AGIs below $25k, 0.6% for AGIs $25k-50k, 1.1% for AGIs $50k-75k, 0.8% for AGIs $75k-100k, 0.6% for AGIs $100k-200k)
Ordinary dividends: $1,994 (reported on 6.4% of returns)
Here:
$1,994
State:
$6,239
(% of AGI for various income ranges: 0.3% for AGIs below $25k, 0.5% for AGIs $25k-50k, 0.3% for AGIs $50k-75k, 0.5% for AGIs $100k-200k)
Net capital gain/loss in AGI: +$2,579 (reported on 10.6% of returns)
Here:
+$2,579
State:
+$11,336
(% of AGI for various income ranges: 1.2% for AGIs below $25k, 0.6% for AGIs $25k-50k, 0.5% for AGIs $50k-75k, 0.8% for AGIs $75k-100k, 0.7% for AGIs $100k-200k)
Profit/loss from business: +$8,704 (reported on 18.1% of returns)
Here:
+$8,704
State:
+$10,862
(% of AGI for various income ranges: 11.5% for AGIs below $25k, 2.6% for AGIs $25k-50k, 3.2% for AGIs $50k-75k, 1.4% for AGIs $75k-100k, 4.7% for AGIs $100k-200k)
Taxable individual retirement arrangement distribution: $10,162 (reported on 6.0% of returns)
40360:
$10,162
Kentucky:
$14,296
(% of AGI for various income ranges: 1.3% for AGIs below $25k, 1.4% for AGIs $25k-50k, 1.7% for AGIs $50k-75k, 4.4% for AGIs $75k-100k)
Total itemized deductions: $16,610 (23% of AGI, reported on 18.1% of returns)
Here:
$16,610
State:
$21,160
Here:
23.0% of AGI
State:
20.0% of AGI
(% of AGI for various income ranges: 4.1% for AGIs below $25k, 6.4% for AGIs $25k-50k, 8.1% for AGIs $50k-75k, 11.3% for AGIs $75k-100k, 12.6% for AGIs $100k-200k)
Charity contributions: $2,973 (reported on 12.5% of returns)
Here:
$2,973
State:
$4,303
(% of AGI for various income ranges: 0.5% for AGIs below $25k, 0.5% for AGIs $25k-50k, 1.2% for AGIs $50k-75k, 1.4% for AGIs $75k-100k, 1.6% for AGIs $100k-200k)
Taxes paid: $5,702 (reported on 18.5% of returns)
40360:
$5,702
State:
$8,496
(% of AGI for various income ranges: 0.5% for AGIs below $25k, 1.5% for AGIs $25k-50k, 2.6% for AGIs $50k-75k, 4.3% for AGIs $75k-100k, 6.2% for AGIs $100k-200k)
Earned income credit: $2,473 (reported on 31.7% of returns)
Here:
$2,473
State:
$2,273
(% of AGI for various income ranges: 10.4% for AGIs below $25k, 1.8% for AGIs $25k-50k)
Percentage of individuals using paid preparers for their 2012 taxes: 76.2%
Here:
76%
State:
60%
(% for various income ranges: 73.8% for AGIs below $25k, 75.4% for AGIs $25k-50k, 78.8% for AGIs $50k-75k, 84.2% for AGIs $75k-100k, 85.7% for AGIs $100k-200k)
Averages for the 2004 tax year for zip code 40360, filed in 2005:
Average Adjusted Gross Income (AGI) in 2004: $30,431 (Individual Income Tax Returns)
Here:
$30,431
State:
$41,540
Salary/wage: $29,239 (reported on 85.3% of returns)
Here:
$29,239
State:
$36,432
(% of AGI for various income ranges: 95.7% for AGIs below $10k, 79.5% for AGIs $10k-25k, 86.0% for AGIs $25k-50k, 84.5% for AGIs $50k-75k, 86.2% for AGIs $75k-100k, 59.3% for AGIs over 100k)
Taxable interest for individuals: $1,523 (reported on 31.9% of returns)
This zip code:
$1,523
Kentucky:
$1,571
(% of AGI for various income ranges: 7.3% for AGIs below $10k, 2.2% for AGIs $10k-25k, 1.1% for AGIs $25k-50k, 1.4% for AGIs $50k-75k, 1.4% for AGIs $75k-100k, 1.5% for AGIs over 100k)
Taxable dividends: $1,140 (reported on 8.5% of returns)
Here:
$1,140
State:
$3,453
(% of AGI for various income ranges: 0.6% for AGIs below $10k, 0.3% for AGIs $10k-25k, 0.1% for AGIs $25k-50k, 0.2% for AGIs $50k-75k, 0.2% for AGIs $75k-100k, 1.3% for AGIs over 100k)
Net capital gain/loss: +$5,277 (reported on 8.9% of returns)
Here:
+$5,277
State:
+$9,663
(% of AGI for various income ranges: 1.6% for AGIs below $10k, 1.1% for AGIs $10k-25k, 1.0% for AGIs $25k-50k, 1.7% for AGIs $50k-75k, 1.5% for AGIs $75k-100k, 3.6% for AGIs over 100k)
Profit/loss from business: +$6,086 (reported on 18.0% of returns)
Here:
+$6,086
State:
+$9,233
(% of AGI for various income ranges: 15.4% for AGIs below $10k, 4.5% for AGIs $10k-25k, 3.0% for AGIs $25k-50k, 3.0% for AGIs $50k-75k, 0.4% for AGIs $75k-100k, 5.9% for AGIs over 100k)
IRA payment deduction: $2,935 (reported on 1.2% of returns)
40360:
$2,935
Kentucky:
$2,955
Total itemized deductions: $14,555 (24% of AGI, reported on 18.2% of returns)
Here:
$14,555
State:
$17,474
Here:
23.6% of AGI
State:
21.0% of AGI
(% of AGI for various income ranges: 6.8% for AGIs below $10k, 4.5% for AGIs $10k-25k, 6.0% for AGIs $25k-50k, 10.5% for AGIs $50k-75k, 15.8% for AGIs $75k-100k, 12.3% for AGIs over 100k)
Charity contributions deductions: $2,279 (3% of AGI, reported on 12.9% of returns)
Here:
$2,279
State:
$3,494
Here:
3.4% of AGI
State:
4.0% of AGI
(% of AGI for various income ranges: 0.3% for AGIs $10k-25k, 0.4% for AGIs $25k-50k, 1.0% for AGIs $50k-75k, 2.1% for AGIs $75k-100k, 2.5% for AGIs over 100k)
Total tax: $3,373 (reported on 69.2% of returns)
40360:
$3,373
State:
$6,162
(% of AGI for various income ranges: 4.5% for AGIs below $10k, 3.8% for AGIs $10k-25k, 5.9% for AGIs $25k-50k, 8.4% for AGIs $50k-75k, 9.4% for AGIs $75k-100k, 17.0% for AGIs over 100k)
Earned income credit: $1,741 (reported on 26.4% of returns)
Here:
$1,741
State:
$1,723
Percentage of individuals using paid preparers for their 2004 taxes: 81.9%
Here:
82%
State:
66%
(% for various income ranges: 80.5% for AGIs below $10k, 82.3% for AGIs $10k-25k, 82.4% for AGIs $25k-50k, 82.6% for AGIs $50k-75k, 79.3% for AGIs $75k-100k, 85.5% for AGIs over 100k)
Household received Food Stamps/SNAP in the past 12 months: 588 Household did not receive Food Stamps/SNAP in the past 12 months: 2,287
Women who had a birth in the past 12 months: 94 (67 now married, 27 unmarried) Women who did not have a birth in the past 12 months: 1,554 (864 now married, 693 unmarried)
Housing units in zip code 40360 with a mortgage: 1,123 (45 second mortgage, 29 both second mortgage and home equity loan) Houses without a mortgage: 6
Median monthly owner costs for units with a mortgage: $969 Median monthly owner costs for units without a mortgage: $345
Residents with income below the poverty level in 2022:
This zip code:
21.2%
Whole state:
16.5%
Residents with income below 50% of the poverty level in 2022:
This zip code:
10.9%
Whole state:
9.0%
Median number of rooms in houses and condos:
Here:
6.2
State:
6.4
Median number of rooms in apartments:
Here:
4.2
State:
4.4
Notable locations in this zip code not listed on our city pages
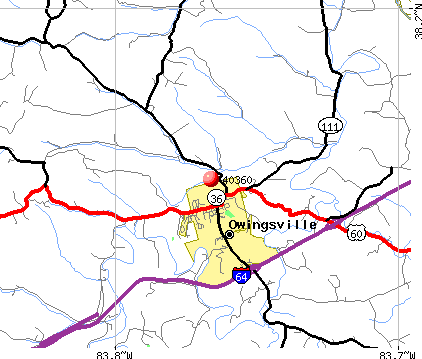
Notable locations in zip code 40360: Old Forge Farm (A), Knob Lick (B), Harpers Mill (C), Devils Nose (D), Peeled Oak (E), Bourbon Furnace (F), Slate Blockhouse (G), Bath Courthouse (H), Owingsville Fire Department (I), Thomlinson Old Store (J), Bath County Emergency Medical Services (K). Display/hide their locations on the map
Churches in zip code 40360 include: Blevins Valley Church (A), Sugar Grove Christian Church (B), Slate Valley Christian Church (C), Preston Church of God (D), Peeled Oak Union Church (E), Ore Mines Church of God (F), Oakla Church of God (G), Mormon Church (H), Lees Chapel (I). Display/hide their locations on the map
Cemeteries: Thompson Cemetery (1), Old Virginia Cemetery (2), Old Fields Cemetery (3), McCarthy Cemetery (4), Boaz Cemetery (5), Knox Hill Cemetery (6), Jackson Cemetery (7). Display/hide their locations on the map
Streams, rivers, and creeks: Claver Branch (A), Dry Branch (B), Elys Branch (C), Gooden Branch (D), Cow Creek (E), Indian Creek (F), Turkey Run (G), Knox Hill Branch (H), Mill Creek (I). Display/hide their locations on the map
In group quarters: 73 (-1 institutionalized population)
Size of family households: 802 2-persons, 418 3-persons, 523 4-persons, 140 5-persons, 29 6-persons, 40 7-or-more-persons
Size of nonfamily households: 693 1-person, 218 2-persons
935 married couples with children.
282 single-parent households (81 men, 201 women).
96.9% of residents of 40360 zip code speak English at home.
1.1% of residents speak Spanish at home (100% very well).
1.8% of residents speak other Indo-European language at home (3% very well, 93% well, 3% not at all).
0.1% of residents speak Asian or Pacific Island language at home (100% very well).
Foreign born population: 0 (0.0%)
:
0.0%
Whole state:
4.0%
53%American
13%Irish
8%English
8%German
3%French
1%Scottish
1%Polish
Major facilities with environmental interests located in this zip code:
BATH COUNTY CENTRAL ALTERNATIVE SCHOOL ( in OWINGSVILLE, KY)
(National Center for Education Statistics) - STATE ID-006025011
BATH COUNTY HIGH SCHOOL (645 CHENAULT DR in OWINGSVILLE, KY)
(National Center for Education Statistics) - STATE ID-006025040
BATH COUNTY MIDDLE SCHOOL (335 W MAIN ST in OWINGSVILLE, KY)
(National Center for Education Statistics) - STATE ID-006025020
OWINGSVILLE ELEMENTARY SCHOOL (50 CHENAULT DR in OWINGSVILLE, KY)
(National Center for Education Statistics) - STATE ID-006025030 Organizations: BATH COUNTY (SCHOOL DISTRICT)
OIL SPILL (D & D CATTLE DBA SLAVENS TRUCKING CO.) (W I-64 AT MILE MARKER 125.25 in OWINGSVILLE, KY)
(Integrated Compliance Information System) - ICIS-04-2004-5029, FORMAL ENFORCEMENT ACTION
MARATHON ASHLAND PIPE LINE LLC (7956 STULLTOWN RD in OWINGSVILLE, KY)
(Resource Conservation and Recovery Act (tracking hazardous waste))
BATH CO AGR EXT FOUNDATION (22 OLD PEASTICKS RD in OWINGSVILLE, KY)
National Pollutant Discharge Elimination System NON-MAJOR (Tracking pollutant discharge elimination systems) - permit Business SIC classification: MANAGEMENT SERVICES
BLUEGRASS RACEWAY PARK LLP (WELLS RD in OWINGSVILLE, KY)
National Pollutant Discharge Elimination System NON-MAJOR (Tracking pollutant discharge elimination systems) - permit Business SIC classification: MANAGEMENT SERVICES
COFFEY PROPERTY DRUMS (1660 OLD STATE ROAD in OWINGSVILLE, KY)
(Resource Conservation and Recovery Act (tracking hazardous waste))
COPHERS GROCERY (79 BLEVINS VALLEY RD in OWINGSVILLE, KY)
National Pollutant Discharge Elimination System NON-MAJOR (Tracking pollutant discharge elimination systems) - permit Business SIC classification: OPERATORS OF RESIDENTIAL MOBILE HOME SITES
OLD DISTRICT HEALTH BLDG (WATER ST in OWINGSVILLE, KY)
(Resource Conservation and Recovery Act (tracking hazardous waste)) Organizations: BATH COUNTY FISCAL COURT (CONTACT/OWNER)
OWINGSVILLE AUTO BODY (382 E HIGH ST in OWINGSVILLE, KY)
(Resource Conservation and Recovery Act (tracking hazardous waste)) Business NAICS classification: AUTOMOTIVE BODY, PAINT, AND INTERIOR REPAIR AND MAINTENANCE. Organizations: DAN BROTHERTON (CONTACT/OWNER)
Housing units lacking complete plumbing facilities: 2.5% Housing units lacking complete kitchen facilities: 4.3%
60.2%Electricity
20.9%Utility gas
12.7%Bottled, tank, or LP gas
4.1%Wood
1.4%Fuel oil, kerosene, etc.
Population in 1990: 4,583. Population change in the 1990s: +1,443 (+31.5%).
Place of birth for U.S.-born residents:
This state: 5,628
Northeast: 107
Midwest: 723
South: 496
West: 107
61% of the 40360 zip code residents lived in the same house 5 years ago. Out of people who lived in different houses, 61% lived in this county. Out of people who lived in different counties, 50% lived in Kentucky.
88% of the 40360 zip code residents lived in the same house 1 year ago. Out of people who lived in different houses, 34% moved from this county. Out of people who lived in different houses, 52% moved from different county within same state. Out of people who lived in different houses, 11% moved from different state. Out of people who lived in different houses, 3% moved from abroad.
Private vs. public school enrollment:
Students in private schools in grades 1 to 8 (elementary and middle school): 60
Here:
9.7%
Kentucky:
17.2%
Students in private schools in grades 9 to 12 (high school): 37
Here:
11.0%
Kentucky:
15.2%
Students in private undergraduate colleges:
Here:
0.0%
Kentucky:
19.6%
Occupation by median earnings in the past 12 months ($)
85,720Business and financial operations occupations
81,277Health diagnosing and treating practitioners and other technical occupations
58,654Installation, maintenance, and repair occupations
55,522Management occupations
52,253Education, training, and library occupations
48,136Transportation occupations
Top industries in this zip code by the number of employees in 2005:
Health Care and Social Assistance: Nursing Care Facilities (100-249 employees: 1 establishment)
Health Care and Social Assistance: Child Day Care Services (20-49: 1, 5-9: 1)
People in group quarters in 2010:
86 people in nursing facilities/skilled-nursing facilities
17 people in group homes intended for adults
People in group quarters in 2000:
115 people in nursing homes
Fatal accident statistics in 2014:
Fatal accident count: 1
Vehicles involved in fatal accidents: 1
Fatal accidents caused by drunken drivers: 0
Fatalities: 1
Persons involved in fatal accidents: 1
Pedestrians involved in fatal accidents: 0
Fatal accident statistics in 2013:
Fatal accident count: 2
Vehicles involved in fatal accidents: 3
Fatal accidents caused by drunken drivers: 0
Fatalities: 3
Persons involved in fatal accidents: 5
Pedestrians involved in fatal accidents: 1
2002 - 2018 National Fire Incident Reporting System (NFIRS) incidents
Based on the data from the years 2002 - 2018 the average number of fires per year is 8. The highest number of reported fire incidents - 22 took place in 2014, and the least - 0 in 2005. The data has a rising trend.
When looking into fire subcategories, the most reports belonged to: Structure Fires (57.2%), and Outside Fires (31.2%).
Fire incident types reported to NFIRS in Zip Code 40360


 Nearest zip codes: 40374, 40334, 40358, 40350, 40346, 40353.


 Based on the data from the years 2002 - 2018 the average number of fires per year is 8. The highest number of reported fire incidents - 22 took place in 2014, and the least - 0 in 2005. The data has a rising trend.
 When looking into fire subcategories, the most reports belonged to: Structure Fires (57.2%), and Outside Fires (31.2%).