Estimated zip code population in 2022: 3,797 Zip code population in 2010: 3,288 Zip code population in 2000: 2,752
Houses and condos: 1,702 Renter-occupied apartments: 199
% of renters here:
12%
State:
31%
March 2022 cost of living index in zip code 40379: 83.7 (less than average, U.S. average is 100)
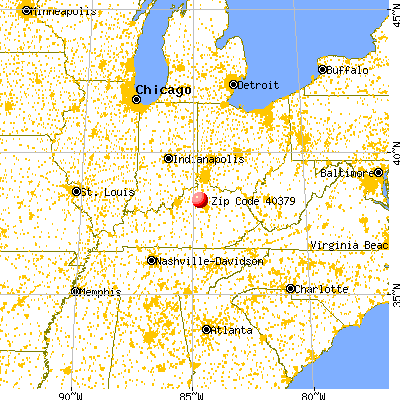
Land area: 63.5 sq. mi. Water area: 0.5 sq. mi.
Population density: 60 people per square mile
(very low).
OSM Map
General Map
Google Map
MSN Map
OSM Map
General Map
Google Map
MSN Map
OSM Map
General Map
Google Map
MSN Map
OSM Map
General Map
Google Map
MSN Map
Please wait while loading the map...
Real estate property taxes paid for housing units in 2022:
This zip code:
0.5% ($1,170)
Kentucky:
0.7% ($1,456)
Median real estate property taxes paid for housing units with mortgages in 2022: $1,397 (0.6%) Median real estate property taxes paid for housing units with no mortgage in 2022: $879 (0.5%)
Business Search- 14 Million verified businesses
Males: 1,935
(51.0%)
Females: 1,862
(49.0%)
For population 25 years and over in 40379:
High school or higher: 92.5%
Bachelor's degree or higher: 25.7%
Graduate or professional degree: 12.6%
Unemployed: 0.9%
Mean travel time to work (commute): 26.0 minutes
For population 15 years and over in 40379:
Never married: 18.5%
Now married: 56.5%
Separated: 1.4%
Widowed: 6.9%
Divorced: 16.7%
Zip code 40379 compared to state average:
Unemployed percentage significantly below state average.
Black race population percentage significantly below state average.
Hispanic race population percentage significantly below state average.
Median age above state average.
Foreign-born population percentage significantly below state average.
Renting percentage significantly below state average.
Length of stay since moving in significantly above state average.
Estimated median house/condo value in 2022: $223,471
40379:
$223,471
Kentucky:
$196,300
According to our research of Kentucky and other state lists, there were 5 registered sex offenders living in 40379 zip code as of May 28, 2024. The ratio of all residents to sex offenders in zip code 40379 is 708 to 1. The ratio of registered sex offenders to all residents in this zip code is lower than the state average.
Median resident age:
This zip code:
46.4 years
Kentucky median age:
39.4 years
Average household size:
This zip code:
2.3 people
Kentucky:
2.4 people
Averages for the 2020 tax year for zip code 40379, filed in 2021:
Average Adjusted Gross Income (AGI) in 2020: $64,375 (Individual Income Tax Returns)
Here:
$64,375
State:
$61,342
Salary/wage: $59,871 (reported on 82.0% of returns)
Here:
$59,871
State:
$50,827
(% of AGI for various income ranges: 1064.5% for AGIs below $25k, 3604.6% for AGIs $25k-50k, 6852.2% for AGIs $50k-75k, 9457.1% for AGIs $75k-100k, 15876.0% for AGIs $100k-200k)
Taxable interest for individuals: $600 (reported on 31.1% of returns)
This zip code:
$600
Kentucky:
$1,441
(% of AGI for various income ranges: 10.3% for AGIs below $25k, 24.6% for AGIs $25k-50k, 31.1% for AGIs $50k-75k, 43.6% for AGIs $75k-100k, 27.0% for AGIs $100k-200k)
Ordinary dividends: $3,332 (reported on 15.5% of returns)
Here:
$3,332
State:
$7,388
(% of AGI for various income ranges: 11.0% for AGIs below $25k, 25.0% for AGIs $25k-50k, 96.1% for AGIs $50k-75k, 76.4% for AGIs $75k-100k, 154.5% for AGIs $100k-200k)
Net capital gain/loss in AGI: +$10,708 (reported on 14.9% of returns)
Here:
+$10,708
State:
+$19,475
(% of AGI for various income ranges: 9.7% for AGIs below $25k, 3.9% for AGIs $25k-50k, 126.1% for AGIs $50k-75k, 150.0% for AGIs $75k-100k, 646.0% for AGIs $100k-200k)
Profit/loss from business: +$6,676 (reported on 18.0% of returns)
Here:
+$6,676
State:
+$11,386
(% of AGI for various income ranges: 146.8% for AGIs below $25k, 176.4% for AGIs $25k-50k, 127.2% for AGIs $50k-75k, 235.7% for AGIs $75k-100k, 214.0% for AGIs $100k-200k)
Taxable individual retirement arrangement distribution: $17,371 (reported on 8.7% of returns)
40379:
$17,371
Kentucky:
$18,941
(% of AGI for various income ranges: 81.3% for AGIs below $25k, 132.5% for AGIs $25k-50k, 579.4% for AGIs $50k-75k, 383.0% for AGIs $100k-200k)
Total itemized deductions: $25,950 (reported on 6.2% of returns)
Here:
$25,950
State:
$32,473
(% of AGI for various income ranges: 578.9% for AGIs $50k-75k, 776.5% for AGIs $100k-200k)
Charity contributions: $7,125 (reported on 5.0% of returns)
Here:
$7,125
State:
$13,472
(% of AGI for various income ranges: 72.8% for AGIs $50k-75k, 219.5% for AGIs $100k-200k)
Taxes paid: $7,550 (reported on 6.2% of returns)
40379:
$7,550
State:
$7,830
(% of AGI for various income ranges: 165.0% for AGIs $50k-75k, 229.0% for AGIs $100k-200k)
Earned income credit: $2,409 (reported on 13.7% of returns)
Here:
$2,409
State:
$2,336
(% of AGI for various income ranges: 104.5% for AGIs below $25k, 73.6% for AGIs $25k-50k)
Percentage of individuals using paid preparers for their 2020 taxes: 92.5%
Here:
93%
State:
94%
(% for various income ranges: 89.1% for AGIs below $25k, 91.9% for AGIs $25k-50k, 92.3% for AGIs $50k-75k, 94.7% for AGIs $75k-100k, 96.6% for AGIs $100k-200k, 100.0% for AGIs over 200k)
Averages for the 2012 tax year for zip code 40379, filed in 2013:
Average Adjusted Gross Income (AGI) in 2012: $49,369 (Individual Income Tax Returns)
Here:
$49,369
State:
$50,814
Salary/wage: $46,826 (reported on 84.0% of returns)
Here:
$46,826
State:
$42,723
(% of AGI for various income ranges: 72.7% for AGIs below $25k, 77.2% for AGIs $25k-50k, 79.8% for AGIs $50k-75k, 87.4% for AGIs $75k-100k, 78.1% for AGIs $100k-200k)
Taxable interest for individuals: $824 (reported on 30.0% of returns)
This zip code:
$824
Kentucky:
$1,381
(% of AGI for various income ranges: 1.1% for AGIs below $25k, 0.9% for AGIs $25k-50k, 0.3% for AGIs $50k-75k, 0.3% for AGIs $75k-100k, 0.4% for AGIs $100k-200k)
Ordinary dividends: $1,486 (reported on 14.7% of returns)
Here:
$1,486
State:
$6,239
(% of AGI for various income ranges: 0.3% for AGIs below $25k, 0.5% for AGIs $25k-50k, 0.5% for AGIs $50k-75k, 0.2% for AGIs $75k-100k, 0.5% for AGIs $100k-200k)
Net capital gain/loss in AGI: +$3,041 (reported on 14.7% of returns)
Here:
+$3,041
State:
+$11,336
(% of AGI for various income ranges: 1.0% for AGIs below $25k, 1.2% for AGIs $25k-50k, 0.3% for AGIs $50k-75k, 0.3% for AGIs $75k-100k, 1.5% for AGIs $100k-200k)
Profit/loss from business: +$5,038 (reported on 17.3% of returns)
Here:
+$5,038
State:
+$10,862
(% of AGI for various income ranges: 9.4% for AGIs below $25k, 1.3% for AGIs $25k-50k, 2.8% for AGIs $50k-75k, 0.2% for AGIs $75k-100k, 0.1% for AGIs $100k-200k)
Taxable individual retirement arrangement distribution: $10,008 (reported on 8.0% of returns)
40379:
$10,008
Kentucky:
$14,296
(% of AGI for various income ranges: 3.1% for AGIs below $25k, 1.9% for AGIs $25k-50k, 1.7% for AGIs $50k-75k, 3.3% for AGIs $75k-100k)
Total itemized deductions: $18,075 (22% of AGI, reported on 34.7% of returns)
Here:
$18,075
State:
$21,160
Here:
21.9% of AGI
State:
20.0% of AGI
(% of AGI for various income ranges: 9.2% for AGIs below $25k, 9.8% for AGIs $25k-50k, 12.5% for AGIs $50k-75k, 14.1% for AGIs $75k-100k, 14.3% for AGIs $100k-200k)
Charity contributions: $3,118 (reported on 26.7% of returns)
Here:
$3,118
State:
$4,303
(% of AGI for various income ranges: 0.7% for AGIs below $25k, 1.1% for AGIs $25k-50k, 1.7% for AGIs $50k-75k, 1.5% for AGIs $75k-100k, 2.3% for AGIs $100k-200k)
Taxes paid: $7,177 (reported on 34.7% of returns)
40379:
$7,177
State:
$8,496
(% of AGI for various income ranges: 1.4% for AGIs below $25k, 2.5% for AGIs $25k-50k, 4.3% for AGIs $50k-75k, 6.3% for AGIs $75k-100k, 6.9% for AGIs $100k-200k)
Earned income credit: $2,388 (reported on 17.3% of returns)
Here:
$2,388
State:
$2,273
(% of AGI for various income ranges: 7.5% for AGIs below $25k, 0.7% for AGIs $25k-50k)
Percentage of individuals using paid preparers for their 2012 taxes: 64.7%
Here:
65%
State:
60%
(% for various income ranges: 64.9% for AGIs below $25k, 68.8% for AGIs $25k-50k, 66.7% for AGIs $50k-75k, 55.6% for AGIs $75k-100k, 63.2% for AGIs $100k-200k)
Averages for the 2004 tax year for zip code 40379, filed in 2005:
Average Adjusted Gross Income (AGI) in 2004: $42,551 (Individual Income Tax Returns)
Here:
$42,551
State:
$41,540
Salary/wage: $40,749 (reported on 85.0% of returns)
Here:
$40,749
State:
$36,432
(% of AGI for various income ranges: 98.5% for AGIs below $10k, 73.3% for AGIs $10k-25k, 82.3% for AGIs $25k-50k, 85.3% for AGIs $50k-75k, 83.9% for AGIs $75k-100k, 76.5% for AGIs over 100k)
Taxable interest for individuals: $914 (reported on 43.3% of returns)
This zip code:
$914
Kentucky:
$1,571
(% of AGI for various income ranges: 6.0% for AGIs below $10k, 3.0% for AGIs $10k-25k, 1.3% for AGIs $25k-50k, 0.5% for AGIs $50k-75k, 0.5% for AGIs $75k-100k, 0.2% for AGIs over 100k)
Taxable dividends: $1,172 (reported on 16.7% of returns)
Here:
$1,172
State:
$3,453
(% of AGI for various income ranges: 1.7% for AGIs below $10k, 0.9% for AGIs $10k-25k, 0.6% for AGIs $25k-50k, 0.1% for AGIs $50k-75k, 0.5% for AGIs $75k-100k, 0.4% for AGIs over 100k)
Net capital gain/loss: +$5,830 (reported on 14.0% of returns)
Here:
+$5,830
State:
+$9,663
(% of AGI for various income ranges: 2.9% for AGIs below $10k, 0.0% for AGIs $10k-25k, 0.3% for AGIs $25k-50k, 1.6% for AGIs $50k-75k, 0.3% for AGIs $75k-100k, 5.6% for AGIs over 100k)
Profit/loss from business: +$5,337 (reported on 17.9% of returns)
Here:
+$5,337
State:
+$9,233
(% of AGI for various income ranges: 4.4% for AGIs below $10k, 7.5% for AGIs $10k-25k, 4.7% for AGIs $25k-50k, 2.8% for AGIs $50k-75k, -0.3% for AGIs $75k-100k, -0.5% for AGIs over 100k)
IRA payment deduction: $3,235 (reported on 1.2% of returns)
40379:
$3,235
Kentucky:
$2,955
Total itemized deductions: $15,938 (22% of AGI, reported on 36.1% of returns)
Here:
$15,938
State:
$17,474
Here:
21.5% of AGI
State:
21.0% of AGI
(% of AGI for various income ranges: 12.7% for AGIs below $10k, 5.4% for AGIs $10k-25k, 10.5% for AGIs $25k-50k, 13.7% for AGIs $50k-75k, 15.8% for AGIs $75k-100k, 17.2% for AGIs over 100k)
Charity contributions deductions: $3,092 (4% of AGI, reported on 29.7% of returns)
Here:
$3,092
State:
$3,494
Here:
4.0% of AGI
State:
4.0% of AGI
(% of AGI for various income ranges: 0.9% for AGIs $10k-25k, 1.5% for AGIs $25k-50k, 1.7% for AGIs $50k-75k, 2.8% for AGIs $75k-100k, 3.3% for AGIs over 100k)
Total tax: $5,166 (reported on 76.9% of returns)
40379:
$5,166
State:
$6,162
(% of AGI for various income ranges: 3.7% for AGIs below $10k, 4.5% for AGIs $10k-25k, 6.5% for AGIs $25k-50k, 8.9% for AGIs $50k-75k, 9.9% for AGIs $75k-100k, 14.1% for AGIs over 100k)
Earned income credit: $1,798 (reported on 16.4% of returns)
Here:
$1,798
State:
$1,723
Percentage of individuals using paid preparers for their 2004 taxes: 67.0%
Here:
67%
State:
66%
(% for various income ranges: 61.1% for AGIs below $10k, 71.2% for AGIs $10k-25k, 73.9% for AGIs $25k-50k, 66.3% for AGIs $50k-75k, 58.5% for AGIs $75k-100k, 60.8% for AGIs over 100k)
Household received Food Stamps/SNAP in the past 12 months: 117 Household did not receive Food Stamps/SNAP in the past 12 months: 1,514
Women who had a birth in the past 12 months: 16 (3 now married, 14 unmarried) Women who did not have a birth in the past 12 months: 746 (452 now married, 296 unmarried)
Housing units in zip code 40379 with a mortgage: 759 (55 second mortgage, 52 both second mortgage and home equity loan) Houses without a mortgage: 48
Median monthly owner costs for units with a mortgage: $1,355 Median monthly owner costs for units without a mortgage: $401
Residents with income below the poverty level in 2022:
This zip code:
6.4%
Whole state:
16.5%
Residents with income below 50% of the poverty level in 2022:
This zip code:
3.1%
Whole state:
9.0%
Median number of rooms in houses and condos:
Here:
5.8
State:
6.4
Median number of rooms in apartments:
Here:
4.2
State:
4.4
Notable locations in this zip code not listed on our city pages
Cemeteries: Masonic Cemetery (1), Bond Cemetery (2), Cedar Grove Cemetery (3), Riddle Cemetery (4), Minorsville Cemetery (5), Lindsay Cemetery (6), Robey Cemetery (7). Display/hide their locations on the map
Streams, rivers, and creeks: Allsup Branch (A), McConnell Run (B), Longlick Branch (C), Opossum Branch (D), Locust Fork (E), Little Indian Branch (F), Lecomptes Run (G), Hess Branch (H), Griffith Branch (I). Display/hide their locations on the map
BRADLEY'S STAMPING GROUND FOOD STORE (131 SPRINGVIEW DR in STAMPING GROUND, KY)
(Resource Conservation and Recovery Act (tracking hazardous waste)) Organizations: MIKE BRADLEY (CONTACT/OWNER)
COLONIAL HEIGHTS SUBD ( in STAMPING GROUND, KY)
National Pollutant Discharge Elimination System NON-MAJOR (Tracking pollutant discharge elimination systems) - permit Business SIC classification: MANAGEMENT SERVICES
COMMONWEALTH TOOL & MACHINE INC (3511 MAIN ST in STAMPING GROUND, KY)
Conditionally Exempt Small Quantity Generators, less than 100 kg/month of hazardous waste (Resource Conservation and Recovery Act (tracking hazardous waste)) Business NAICS classification: INDUSTRIAL MOLD MANUFACTURING. Organizations: ROB PARKER & STEVE WHITHOCK (CONTACT/OWNER)
, STEVE WHITLOCK (CONTACT/OWNER)
Housing units lacking complete plumbing facilities: 1.7% Housing units lacking complete kitchen facilities: 0.4%
65.7%Electricity
29.7%Bottled, tank, or LP gas
3.0%Wood
0.6%Fuel oil, kerosene, etc.
0.6%Other fuel
0.6%No fuel used
Population in 1990: 3,757.
Place of birth for U.S.-born residents:
This state: 3,155
Northeast: 51
Midwest: 222
South: 298
West: 39
60% of the 40379 zip code residents lived in the same house 5 years ago. Out of people who lived in different houses, 51% lived in this county. Out of people who lived in different counties, 50% lived in Kentucky.
94% of the 40379 zip code residents lived in the same house 1 year ago. Out of people who lived in different houses, 74% moved from this county. Out of people who lived in different houses, 24% moved from different county within same state.
Private vs. public school enrollment:
Students in private schools in grades 1 to 8 (elementary and middle school): 74
Here:
14.5%
Kentucky:
17.2%
Students in private schools in grades 9 to 12 (high school): 22
Here:
10.3%
Kentucky:
15.2%
Students in private undergraduate colleges: 10
Here:
13.1%
Kentucky:
19.6%
Occupation by median earnings in the past 12 months ($)
94,353Architecture and engineering occupations
84,767Production occupations
73,730Fire fighting and prevention, and other protective service workers including supervisors
72,966Health technologists and technicians
71,380Installation, maintenance, and repair occupations
70,176Arts, design, entertainment, sports, and media occupations
Top industries in this zip code by the number of employees in 2005:
Construction: New Housing Operative Builders (10-19 employees: 1 establishment)
Construction: Plumbing, Heating, and Air-Conditioning Contractors (10-19: 1)
Other Services (except Public Administration): Religious Organizations (1-4: 5)
Construction: Electrical Contractors (5-9: 1)
Accommodation and Food Services: Full-Service Restaurants (5-9: 1)
Health Care and Social Assistance: Offices of Physicians (except Mental Health Specialists) (5-9: 1)
Arts, Entertainment, and Recreation: Other Spectator Sports (5-9: 1)
Fatal accident statistics in 2014:
Fatal accident count: 1
Vehicles involved in fatal accidents: 1
Fatal accidents caused by drunken drivers: 1
Fatalities: 1
Persons involved in fatal accidents: 2
Pedestrians involved in fatal accidents: 0
Fatal accident statistics in 2013:
Fatal accident count: 1
Vehicles involved in fatal accidents: 2
Fatal accidents caused by drunken drivers: 1
Fatalities: 1
Persons involved in fatal accidents: 3
Pedestrians involved in fatal accidents: 0
Home Mortgage Disclosure Act Aggregated Statistics For Year 2009 (Based on 4 partial tracts)
A) FHA, FSA/RHS & VA Home Purchase Loans
B) Conventional Home Purchase Loans
C) Refinancings
D) Home Improvement Loans
F) Non-occupant Loans on < 5 Family Dwellings (A B C & D)
G) Loans On Manufactured Home Dwelling (A B C & D)
Number
Average Value
Number
Average Value
Number
Average Value
Number
Average Value
Number
Average Value
Number
Average Value
LOANS ORIGINATED
30
$165,641
67
$171,139
365
$171,987
15
$33,110
32
$134,639
15
$62,349
APPLICATIONS APPROVED, NOT ACCEPTED
1
$368,110
2
$154,250
11
$168,914
0
$0
0
$0
0
$0
APPLICATIONS DENIED
4
$154,342
12
$146,559
100
$166,473
5
$106,574
3
$163,117
7
$107,589
APPLICATIONS WITHDRAWN
8
$158,382
14
$179,644
57
$189,297
2
$105,730
5
$115,616
2
$114,175
FILES CLOSED FOR INCOMPLETENESS
0
$0
1
$87,840
17
$183,662
1
$72,610
1
$58,630
2
$76,115
Aggregated Statistics For Year 2008 (Based on 4 partial tracts)
A) FHA, FSA/RHS & VA Home Purchase Loans
B) Conventional Home Purchase Loans
C) Refinancings
D) Home Improvement Loans
F) Non-occupant Loans on < 5 Family Dwellings (A B C & D)
G) Loans On Manufactured Home Dwelling (A B C & D)
Number
Average Value
Number
Average Value
Number
Average Value
Number
Average Value
Number
Average Value
Number
Average Value
LOANS ORIGINATED
33
$154,998
79
$178,016
179
$163,597
29
$35,620
28
$179,690
20
$74,472
APPLICATIONS APPROVED, NOT ACCEPTED
3
$129,980
7
$169,411
15
$162,993
4
$40,492
1
$84,110
2
$77,490
APPLICATIONS DENIED
4
$119,888
16
$150,195
117
$172,230
19
$50,814
3
$172,247
17
$76,479
APPLICATIONS WITHDRAWN
3
$176,597
10
$203,690
43
$192,350
4
$75,590
1
$171,020
4
$127,032
FILES CLOSED FOR INCOMPLETENESS
0
$0
4
$145,172
5
$240,320
0
$0
1
$102,860
0
$0
Aggregated Statistics For Year 2007 (Based on 4 partial tracts)
A) FHA, FSA/RHS & VA Home Purchase Loans
B) Conventional Home Purchase Loans
C) Refinancings
D) Home Improvement Loans
F) Non-occupant Loans on < 5 Family Dwellings (A B C & D)
G) Loans On Manufactured Home Dwelling (A B C & D)
Number
Average Value
Number
Average Value
Number
Average Value
Number
Average Value
Number
Average Value
Number
Average Value
LOANS ORIGINATED
11
$154,991
154
$146,405
179
$150,463
67
$40,603
32
$126,345
25
$66,342
APPLICATIONS APPROVED, NOT ACCEPTED
2
$139,375
10
$178,756
31
$165,744
5
$59,580
2
$105,340
6
$105,422
APPLICATIONS DENIED
4
$126,825
27
$149,947
97
$153,479
23
$45,464
9
$148,026
11
$67,875
APPLICATIONS WITHDRAWN
0
$0
21
$129,356
38
$144,360
7
$55,746
1
$103,920
3
$72,687
FILES CLOSED FOR INCOMPLETENESS
0
$0
2
$185,075
10
$160,910
0
$0
1
$133,380
0
$0
Aggregated Statistics For Year 2006 (Based on 4 partial tracts)
A) FHA, FSA/RHS & VA Home Purchase Loans
B) Conventional Home Purchase Loans
C) Refinancings
D) Home Improvement Loans
F) Non-occupant Loans on < 5 Family Dwellings (A B C & D)
G) Loans On Manufactured Home Dwelling (A B C & D)
Number
Average Value
Number
Average Value
Number
Average Value
Number
Average Value
Number
Average Value
Number
Average Value
LOANS ORIGINATED
20
$147,838
199
$143,407
177
$143,099
68
$44,694
35
$92,237
26
$71,480
APPLICATIONS APPROVED, NOT ACCEPTED
3
$118,333
16
$117,814
28
$130,104
8
$34,095
2
$65,640
2
$75,775
APPLICATIONS DENIED
2
$161,700
23
$97,273
103
$145,097
20
$58,273
9
$97,478
18
$81,332
APPLICATIONS WITHDRAWN
4
$145,768
24
$162,517
44
$148,388
10
$64,627
3
$120,630
2
$41,145
FILES CLOSED FOR INCOMPLETENESS
0
$0
5
$127,300
23
$161,057
0
$0
0
$0
0
$0
Aggregated Statistics For Year 2005 (Based on 4 partial tracts)
A) FHA, FSA/RHS & VA Home Purchase Loans
B) Conventional Home Purchase Loans
C) Refinancings
D) Home Improvement Loans
F) Non-occupant Loans on < 5 Family Dwellings (A B C & D)
G) Loans On Manufactured Home Dwelling (A B C & D)
Number
Average Value
Number
Average Value
Number
Average Value
Number
Average Value
Number
Average Value
Number
Average Value
LOANS ORIGINATED
16
$139,334
174
$135,336
202
$132,392
36
$53,152
24
$80,508
25
$83,907
APPLICATIONS APPROVED, NOT ACCEPTED
0
$0
30
$97,032
33
$106,551
5
$44,374
2
$113,025
7
$80,066
APPLICATIONS DENIED
1
$133,740
35
$97,501
116
$107,850
16
$34,928
3
$129,113
24
$78,725
APPLICATIONS WITHDRAWN
2
$105,300
27
$145,491
78
$144,847
10
$100,962
3
$81,500
5
$102,994
FILES CLOSED FOR INCOMPLETENESS
0
$0
7
$116,420
14
$142,774
1
$38,060
0
$0
1
$137,830
Aggregated Statistics For Year 2004 (Based on 4 partial tracts)
A) FHA, FSA/RHS & VA Home Purchase Loans
B) Conventional Home Purchase Loans
C) Refinancings
D) Home Improvement Loans
F) Non-occupant Loans on < 5 Family Dwellings (A B C & D)
G) Loans On Manufactured Home Dwelling (A B C & D)
Number
Average Value
Number
Average Value
Number
Average Value
Number
Average Value
Number
Average Value
Number
Average Value
LOANS ORIGINATED
25
$114,208
167
$130,727
199
$127,547
38
$46,839
28
$111,117
29
$63,544
APPLICATIONS APPROVED, NOT ACCEPTED
3
$91,947
15
$93,217
43
$127,018
4
$104,372
0
$0
8
$80,904
APPLICATIONS DENIED
5
$139,020
23
$120,080
99
$122,567
22
$41,683
5
$106,398
16
$72,123
APPLICATIONS WITHDRAWN
5
$151,052
25
$141,172
83
$124,561
3
$37,407
2
$84,310
6
$71,323
FILES CLOSED FOR INCOMPLETENESS
0
$0
5
$246,734
12
$135,547
1
$19,260
0
$0
2
$49,885
Aggregated Statistics For Year 2003 (Based on 4 partial tracts)
A) FHA, FSA/RHS & VA Home Purchase Loans
B) Conventional Home Purchase Loans
C) Refinancings
D) Home Improvement Loans
F) Non-occupant Loans on < 5 Family Dwellings (A B C & D)
Detailed PMIC statistics for the following Tracts:0405.00
, 0406.00
2002 - 2018 National Fire Incident Reporting System (NFIRS) incidents
According to the data from the years 2002 - 2018 the average number of fire incidents per year is 11. The highest number of fire incidents - 25 took place in 2017, and the least - 0 in 2007. The data has a dropping trend.
When looking into fire subcategories, the most reports belonged to: Outside Fires (40.8%), and Structure Fires (34.6%).
Fire incident types reported to NFIRS in Zip Code 40379


 Nearest zip codes: 40324, 40347, 40370, 40601, 41010, 40604.


 According to the data from the years 2002 - 2018 the average number of fire incidents per year is 11. The highest number of fire incidents - 25 took place in 2017, and the least - 0 in 2007. The data has a dropping trend.
 When looking into fire subcategories, the most reports belonged to: Outside Fires (40.8%), and Structure Fires (34.6%).