Estimated zip code population in 2022: 2,063 Zip code population in 2010: 1,928 Zip code population in 2000: 1,236
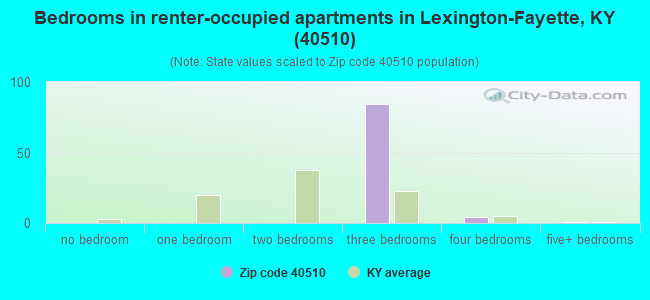
Houses and condos: 449 Renter-occupied apartments: 97
% of renters here:
21%
State:
31%
March 2022 cost of living index in zip code 40510: 89.5 (less than average, U.S. average is 100)
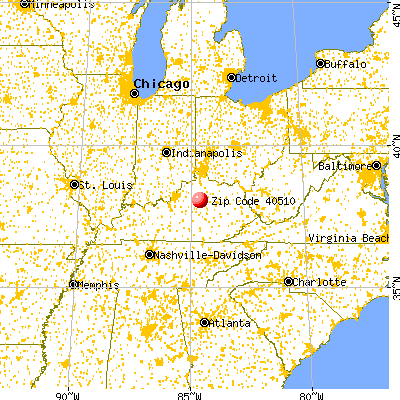
Land area: 21.4 sq. mi. Water area: 0.2 sq. mi.
Population density: 96 people per square mile
(very low).
OSM Map
General Map
Google Map
MSN Map
OSM Map
General Map
Google Map
MSN Map
OSM Map
General Map
Google Map
MSN Map
OSM Map
General Map
Google Map
MSN Map
Please wait while loading the map...
Real estate property taxes paid for housing units in 2022:
This zip code:
0.5% ($3,927)
Kentucky:
0.7% ($1,456)
Median real estate property taxes paid for housing units with mortgages in 2022: $5,577 (0.6%) Median real estate property taxes paid for housing units with no mortgage in 2022: $3,302 (0.6%)
Business Search- 14 Million verified businesses
Males: 1,383
(67.1%)
Females: 678
(32.9%)
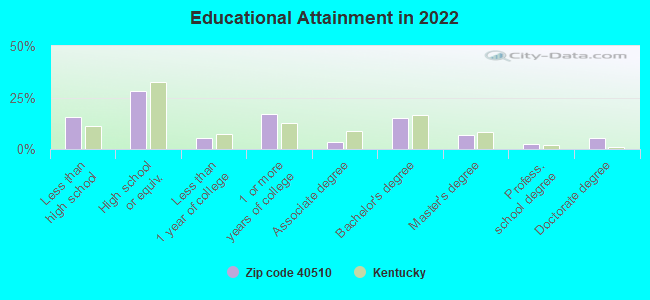
For population 25 years and over in 40510:
High school or higher: 82.5%
Bachelor's degree or higher: 29.6%
Graduate or professional degree: 14.8%
Unemployed: 2.1%
Mean travel time to work (commute): 18.0 minutes
For population 15 years and over in 40510:
Never married: 50.2%
Now married: 25.2%
Separated: 4.5%
Widowed: 8.2%
Divorced: 11.8%
Zip code 40510 compared to state average:
Median household income significantly above state average.
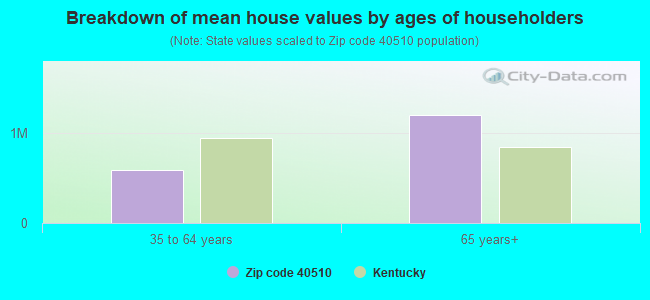
Median house value significantly above state average.
Unemployed percentage below state average.
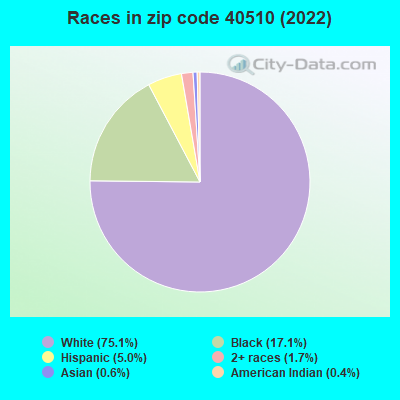
Black race population percentage above state average.
Length of stay since moving in significantly above state average.
Averages for the 2020 tax year for zip code 40510, filed in 2021:
Average Adjusted Gross Income (AGI) in 2020: $167,494 (Individual Income Tax Returns)
Here:
$167,494
State:
$61,342
Salary/wage: $77,695 (reported on 78.7% of returns)
Here:
$77,695
State:
$50,827
(% of AGI for various income ranges: 1597.0% for AGIs below $25k, 4680.0% for AGIs $25k-50k, 4157.5% for AGIs $50k-75k, 13562.0% for AGIs $100k-200k)
Taxable interest for individuals: $2,472 (reported on 38.3% of returns)
This zip code:
$2,472
Kentucky:
$1,441
(% of AGI for various income ranges: 3.0% for AGIs below $25k, 55.0% for AGIs $50k-75k, 508.0% for AGIs $100k-200k)
Ordinary dividends: $19,740 (reported on 31.9% of returns)
Here:
$19,740
State:
$7,388
(% of AGI for various income ranges: 19.0% for AGIs below $25k, 640.0% for AGIs $50k-75k, 1826.0% for AGIs $100k-200k)
Net capital gain/loss in AGI: +$43,031 (reported on 34.0% of returns)
Here:
+$43,031
State:
+$19,475
(% of AGI for various income ranges: 36.0% for AGIs $25k-50k, 1614.0% for AGIs $100k-200k)
Profit/loss from business: +$11,838 (reported on 17.0% of returns)
Here:
+$11,838
State:
+$11,386
(% of AGI for various income ranges: 288.0% for AGIs $25k-50k, 1104.0% for AGIs $100k-200k)
Taxable individual retirement arrangement distribution: $33,720 (reported on 10.6% of returns)
40510:
$33,720
Kentucky:
$18,941
(% of AGI for various income ranges: 3372.0% for AGIs $100k-200k)
Total itemized deductions: $34,586 (reported on 14.9% of returns)
Here:
$34,586
State:
$32,473
(% of AGI for various income ranges: 2408.0% for AGIs $100k-200k)
Charity contributions: $13,100 (reported on 12.8% of returns)
Here:
$13,100
State:
$13,472
(% of AGI for various income ranges: 532.0% for AGIs $100k-200k)
Taxes paid: $7,986 (reported on 14.9% of returns)
40510:
$7,986
State:
$7,830
(% of AGI for various income ranges: 546.0% for AGIs $100k-200k)
Earned income credit: $1,300 (reported on 6.4% of returns)
Here:
$1,300
State:
$2,336
(% of AGI for various income ranges: 39.0% for AGIs below $25k)
Percentage of individuals using paid preparers for their 2020 taxes: 89.4%
Here:
89%
State:
94%
(% for various income ranges: 92.9% for AGIs below $25k, 87.5% for AGIs $25k-50k, 100.0% for AGIs $50k-75k, 75.0% for AGIs $75k-100k, 90.0% for AGIs $100k-200k, 85.7% for AGIs over 200k)
Averages for the 2012 tax year for zip code 40510, filed in 2013:
Average Adjusted Gross Income (AGI) in 2012: $119,669 (Individual Income Tax Returns)
Here:
$119,669
State:
$50,814
Salary/wage: $59,753 (reported on 75.0% of returns)
Here:
$59,753
State:
$42,723
(% of AGI for various income ranges: 80.0% for AGIs below $25k, 82.2% for AGIs $25k-50k, 51.3% for AGIs $50k-75k, 48.6% for AGIs $75k-100k, 52.8% for AGIs $100k-200k, 24.2% for AGIs over 200k)
Taxable interest for individuals: $2,227 (reported on 45.8% of returns)
This zip code:
$2,227
Kentucky:
$1,381
(% of AGI for various income ranges: 2.7% for AGIs below $25k, 1.0% for AGIs $50k-75k, 1.8% for AGIs $75k-100k, 1.3% for AGIs $100k-200k, 0.5% for AGIs over 200k)
Ordinary dividends: $9,828 (reported on 37.5% of returns)
Here:
$9,828
State:
$6,239
(% of AGI for various income ranges: 4.3% for AGIs below $25k, 1.6% for AGIs $25k-50k, 3.4% for AGIs $75k-100k, 7.4% for AGIs $100k-200k, 2.0% for AGIs over 200k)
Net capital gain/loss in AGI: +$6,367 (reported on 31.2% of returns)
Here:
+$6,367
State:
+$11,336
(% of AGI for various income ranges: 0.8% for AGIs below $25k, 4.0% for AGIs $100k-200k, 1.4% for AGIs over 200k)
Profit/loss from business: +$11,722 (reported on 18.8% of returns)
Here:
+$11,722
State:
+$10,862
(% of AGI for various income ranges: 8.1% for AGIs below $25k, 4.5% for AGIs $50k-75k, 6.8% for AGIs $100k-200k)
Taxable individual retirement arrangement distribution: $12,843 (reported on 14.6% of returns)
40510:
$12,843
Kentucky:
$14,296
Total itemized deductions: $38,365 (16% of AGI, reported on 41.7% of returns)
Here:
$38,365
State:
$21,160
Here:
15.6% of AGI
State:
20.0% of AGI
(% of AGI for various income ranges: 28.6% for AGIs below $25k, 16.7% for AGIs $50k-75k, 13.5% for AGIs $75k-100k, 19.9% for AGIs $100k-200k, 11.0% for AGIs over 200k)
Charity contributions: $9,717 (reported on 37.5% of returns)
Here:
$9,717
State:
$4,303
(% of AGI for various income ranges: 3.4% for AGIs below $25k, 4.3% for AGIs $50k-75k, 3.5% for AGIs $75k-100k, 3.8% for AGIs $100k-200k, 2.9% for AGIs over 200k)
Taxes paid: $14,626 (reported on 39.6% of returns)
40510:
$14,626
State:
$8,496
(% of AGI for various income ranges: 4.7% for AGIs below $25k, 4.5% for AGIs $50k-75k, 4.3% for AGIs $75k-100k, 7.5% for AGIs $100k-200k, 4.5% for AGIs over 200k)
Earned income credit: $1,567 (reported on 6.2% of returns)
Here:
$1,567
State:
$2,273
(% of AGI for various income ranges: 2.3% for AGIs below $25k)
Percentage of individuals using paid preparers for their 2012 taxes: 60.4%
Here:
60%
State:
60%
(% for various income ranges: 44.4% for AGIs below $25k, 62.5% for AGIs $25k-50k, 80.0% for AGIs $50k-75k, 60.0% for AGIs $75k-100k, 75.0% for AGIs $100k-200k, 75.0% for AGIs over 200k)
Averages for the 2004 tax year for zip code 40510, filed in 2005:
Average Adjusted Gross Income (AGI) in 2004: $96,201 (Individual Income Tax Returns)
Here:
$96,201
State:
$41,540
Salary/wage: $58,095 (reported on 77.2% of returns)
Here:
$58,095
State:
$36,432
(% of AGI for various income ranges: 71.9% for AGIs $10k-25k, 63.2% for AGIs $25k-50k, 65.4% for AGIs $50k-75k, 58.5% for AGIs $75k-100k, 39.5% for AGIs over 100k)
Taxable interest for individuals: $2,736 (reported on 59.5% of returns)
This zip code:
$2,736
Kentucky:
$1,571
(% of AGI for various income ranges: 5.6% for AGIs $10k-25k, 3.3% for AGIs $25k-50k, 1.4% for AGIs $50k-75k, 1.7% for AGIs $75k-100k, 1.3% for AGIs over 100k)
Taxable dividends: $9,946 (reported on 45.1% of returns)
Here:
$9,946
State:
$3,453
(% of AGI for various income ranges: 3.7% for AGIs $10k-25k, 2.5% for AGIs $25k-50k, 0.8% for AGIs $50k-75k, 3.2% for AGIs $75k-100k, 5.2% for AGIs over 100k)
Net capital gain/loss: +$12,772 (reported on 35.8% of returns)
Here:
+$12,772
State:
+$9,663
(% of AGI for various income ranges: -0.7% for AGIs $10k-25k, -1.2% for AGIs $25k-50k, -0.1% for AGIs $50k-75k, 0.2% for AGIs $75k-100k, 6.4% for AGIs over 100k)
IRA payment deduction: $3,200 (reported on 3.3% of returns)
40510:
$3,200
Kentucky:
$2,955
Total itemized deductions: $31,352 (17% of AGI, reported on 44.0% of returns)
Here:
$31,352
State:
$17,474
Here:
16.5% of AGI
State:
21.0% of AGI
(% of AGI for various income ranges: 18.7% for AGIs $25k-50k, 15.3% for AGIs $50k-75k, 16.9% for AGIs $75k-100k, 14.2% for AGIs over 100k)
Charity contributions deductions: $8,699 (5% of AGI, reported on 41.2% of returns)
Here:
$8,699
State:
$3,494
Here:
4.5% of AGI
State:
4.0% of AGI
(% of AGI for various income ranges: 3.3% for AGIs $25k-50k, 2.4% for AGIs $50k-75k, 2.5% for AGIs $75k-100k, 4.1% for AGIs over 100k)
Total tax: $23,191 (reported on 80.1% of returns)
40510:
$23,191
State:
$6,162
(% of AGI for various income ranges: 5.0% for AGIs $10k-25k, 7.6% for AGIs $25k-50k, 10.9% for AGIs $50k-75k, 11.3% for AGIs $75k-100k, 22.4% for AGIs over 100k)
Earned income credit: $1,208 (reported on 5.3% of returns)
Here:
$1,208
State:
$1,723
Percentage of individuals using paid preparers for their 2004 taxes: 62.4%
Here:
62%
State:
66%
(% for various income ranges: 50.0% for AGIs below $10k, 55.6% for AGIs $10k-25k, 68.6% for AGIs $25k-50k, 61.5% for AGIs $50k-75k, 53.1% for AGIs $75k-100k, 76.1% for AGIs over 100k)
Household received Food Stamps/SNAP in the past 12 months: 0 Household did not receive Food Stamps/SNAP in the past 12 months: 452
Women who had a birth in the past 12 months: 15 (9 now married, 6 unmarried) Women who did not have a birth in the past 12 months: 381 (96 now married, 284 unmarried)
Housing units in zip code 40510 with a mortgage: 153 (7 second mortgage, 7 both second mortgage and home equity loan) Median monthly owner costs for units with a mortgage: $2,843 Median monthly owner costs for units without a mortgage: $645
Residents with income below the poverty level in 2022:
This zip code:
12.1%
Whole state:
16.5%
Residents with income below 50% of the poverty level in 2022:
This zip code:
1.7%
Whole state:
9.0%
Median number of rooms in houses and condos:
Here:
10.0
State:
6.4
Median number of rooms in apartments:
Here:
4.9
State:
4.4
Notable locations in this zip code not listed on our city pages
Tourist attractions (not listed on the city page) : Aviation Museum of KY Inc (4316 Hanger Drive) (1), Headley-Whitney Museum (Cultural Attractions- Events- & Facilities; 4435 Old Frankfort Pike) (2), Rag Peddler (Tours & Charters; 817 Enterprise Drive) (3). Display/hide their approximate locations on the map
In group quarters: 1,249 (-1 institutionalized population)
Size of family households: 107 2-persons, 27 3-persons, 15 4-persons, 10 5-persons, 16 6-persons
Size of nonfamily households: 245 1-person, 35 2-persons
97 married couples with children.
7 single-parent households (7 men).
92.1% of residents of 40510 zip code speak English at home.
5.9% of residents speak Spanish at home (36% very well, 36% well, 12% not well, 16% not at all).
1.2% of residents speak other Indo-European language at home (76% very well, 24% well).
0.3% of residents speak Asian or Pacific Island language at home (100% well).
0.3% of residents speak other language at home (100% well).
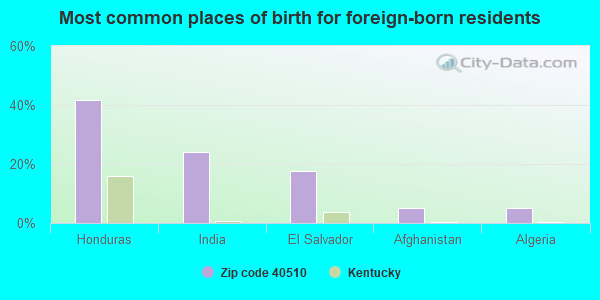
Foreign born population: 114 (5.5%) (24.5% of them are naturalized citizens)
This zip code:
5.5%
Whole state:
4.0%
42%Honduras
24%India
18%El Salvador
5%Afghanistan
5%Algeria
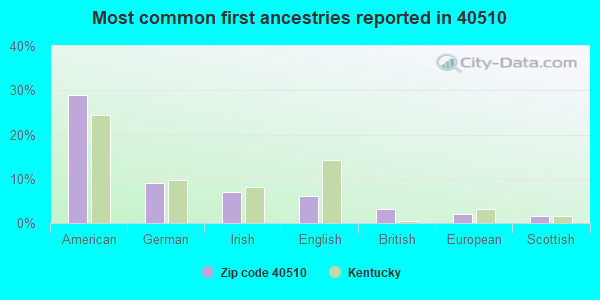
29%American
9%German
7%Irish
6%English
3%British
2%European
2%Scottish
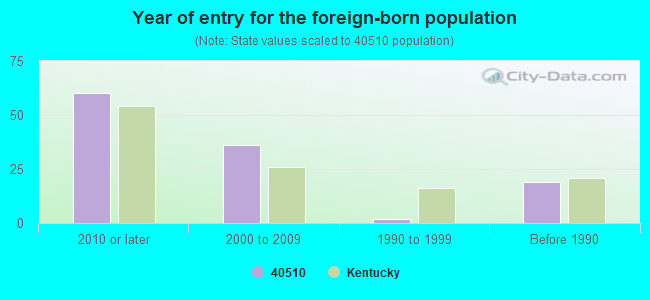
Year of entry for the foreign-born population
602010 or later
362000 to 2009
21990 to 1999
19Before 1990
Major facilities with environmental interests located in this zip code:
BLUEGRASS AIRPORT (4000 TERMINAL DRIVE SUITE 206 in LEXINGTON, KY)
COMPLIANCE ACTIVITY (Tracking inspections of insecticide, fungicide, and rodenticide, and toxic substances) National Pollutant Discharge Elimination System NON-MAJOR (Tracking pollutant discharge elimination systems) - permit National Pollutant Discharge Elimination System NON-MAJOR (Tracking pollutant discharge elimination systems) - permit National Pollutant Discharge Elimination System NON-MAJOR (Tracking pollutant discharge elimination systems) - permit National Pollutant Discharge Elimination System NON-MAJOR (Tracking pollutant discharge elimination systems) - permit Conditionally Exempt Small Quantity Generators, less than 100 kg/month of hazardous waste (Resource Conservation and Recovery Act (tracking hazardous waste)) - notification TSD (Resource Conservation and Recovery Act (tracking hazardous waste)) - notification Business SIC classification: AIRPORTS, FLYING FIELDS, AND AIRPORT TERMINAL SERVICES; MANAGEMENT SERVICES Organizations: BLUE GRASS AIRPORT (CONTACT/OWNER)
, LEX-FAYETTE URBAN CO. AIRPORT BOARD (CONTACT/OWNER)
Alternative names: BLUE GRASS AIRPORT
CERADYNE COMPANY SEMICON ASSOC (695 LACO DR. in LEXINGTON, KY)
AIR MAJOR (AIRS/AFS) (Integrated Compliance Information System) - ICIS-04-2000-0910, FORMAL ENFORCEMENT ACTION COMPLIANCE ACTIVITY (Tracking inspections of insecticide, fungicide, and rodenticide, and toxic substances) CRITERIA AND HAZARDOUS AIR POLLUTANT INVENTORY (Inventory of air pollution sources) Small Quantity Generators, between 100 kg and 1000 kg of hazardous waste/month (Resource Conservation and Recovery Act (tracking hazardous waste)) - notification TRI REPORTER (Tracking of toxic chemicals releasing facilities) - ICIS-, ENFORCEMENT/COMPLIANCE ACTIVITY Business SIC classification: ELECTRONIC COMPONENTS Business NAICS classification: ELECTRON TUBE MANUFACTURING.; ALL OTHER MISCELLANEOUS ELECTRICAL EQUIPMENT AND COMPONENT MANUFACTURING. Organizations: CERADYNE INC (CONTACT/OPERATOR)
, CERADYNE INC. (CONTACT/OWNER)
Alternative names: CERADYNE, INC., SEMICON ASSOCIATES
ADULT DETENTION CENTER ALTERNATIVE SCH (600 OLD FRANKFORT CIRCLE in LEXINGTON, KY)
(National Center for Education Statistics) - STATE ID-034165029 Organizations: FAYETTE COUNTY (SCHOOL DISTRICT)
CONGLETON,W T CO (613 LACO DR. in LEXINGTON, KY)
AIR MINOR (AIRS/AFS) CRITERIA AND HAZARDOUS AIR POLLUTANT INVENTORY (Inventory of air pollution sources) National Pollutant Discharge Elimination System NON-MAJOR (Tracking pollutant discharge elimination systems) - permit Business SIC classification: READY-MIXED CONCRETE Organizations: W T CONGLETON CO INC (CONTACT/OWNER)
Alternative names: W T CONGLETON CO INC
MAREHAVEN PHASE 3 (313 ALEXANDRIA DR in LEXINGTON, KY)
AIRPORT FOOD MART (5584 VERSAILLES RD in LEXINGTON, KY)
National Pollutant Discharge Elimination System NON-MAJOR (Tracking pollutant discharge elimination systems) - permit Business SIC classification: GROCERY STORES
AMERICA'S FINEST WOODWORKING TEAM (800 ENTERPRISE DR in LEXINGTON, KY)
AIR SYNTHETIC MINOR (AIRS/AFS) CRITERIA AND HAZARDOUS AIR POLLUTANT INVENTORY (Inventory of air pollution sources) Small Quantity Generators, between 100 kg and 1000 kg of hazardous waste/month (Resource Conservation and Recovery Act (tracking hazardous waste)) - notification Business SIC classification: WOOD OFFICE AND STORE FIXTURES, PARTITIONS, SHELVING, AND LOCKERS Business NAICS classification: CUSTOM ARCHITECTURAL WOODWORK AND MILLWORK MANUFACTURING.; SHOWCASE, PARTITION, SHELVING, AND LOCKER MANUFACTURING.
ASHLAND BRANDED MARKETING #341-0233838 (3225 OLD FRANKFORT ROAD in LEXINGTON, KY)
(Resource Conservation and Recovery Act (tracking hazardous waste)) Organizations: ASHLAND BRANDED MARKETING INC. (CONTACT/OWNER)
ASHLAND BRANDED MARKETING #341-0466936 (2601 OLD FRANKFORT ROAD in LEXINGTON, KY)
(Resource Conservation and Recovery Act (tracking hazardous waste)) Organizations: ASHLAND BRANDED MARKETING INC. (CONTACT/OWNER)
C V WHITNEY FARM (JOHNSTON RD in LEXINGTON, KY)
(Resource Conservation and Recovery Act (tracking hazardous waste)) Business NAICS classification: RACETRACKS.
CLOUD CONCRETE PRODUCTS INC (747 ALLENRIDGE POINT in LEXINGTON, KY)
National Pollutant Discharge Elimination System NON-MAJOR (Tracking pollutant discharge elimination systems) - permit Business SIC classification: CONCRETE PRODUCTS, EXCEPT BLOCK AND BRICK
OLD TRANSFER STATION (1709 OLD FRANKFORT PK in LEXINGTON, KY)
(Resource Conservation and Recovery Act (tracking hazardous waste)) Business NAICS classification: GENERAL AUTOMOTIVE REPAIR. Organizations: LEXINGTON FAYETTE URBAN CO GOV (CONTACT/OWNER)
OLDCASTLE PRECAST INC CLOUD CN (747 ALLENRIDGE POINT in LEXINGTON, KY)
National Pollutant Discharge Elimination System NON-MAJOR (Tracking pollutant discharge elimination systems) - permit Business SIC classification: CONCRETE PRODUCTS, EXCEPT BLOCK AND BRICK
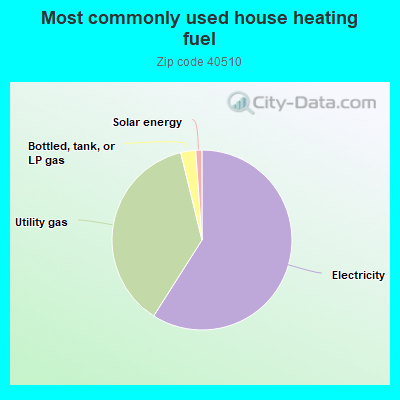
59.2%Electricity
37.3%Utility gas
2.7%Bottled, tank, or LP gas
1.1%Solar energy
Population in 1990: 1,467.
Place of birth for U.S.-born residents:
This state: 1,303
Northeast: 37
Midwest: 325
South: 209
West: 70
70% of the 40510 zip code residents lived in the same house 5 years ago. Out of people who lived in different houses, 46% lived in this county. Out of people who lived in different counties, 50% lived in Kentucky.
57% of the 40510 zip code residents lived in the same house 1 year ago. Out of people who lived in different houses, 61% moved from this county. Out of people who lived in different houses, 20% moved from different county within same state. Out of people who lived in different houses, 12% moved from different state. Out of people who lived in different houses, 2% moved from abroad.
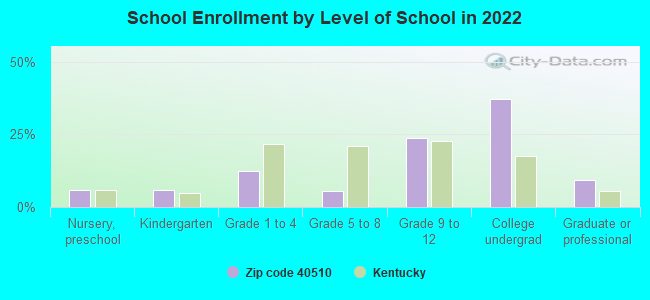
Private vs. public school enrollment:
Students in private schools in grades 1 to 8 (elementary and middle school): 7
Here:
14.4%
Kentucky:
17.2%
Students in private schools in grades 9 to 12 (high school): 36
Here:
48.9%
Kentucky:
15.2%
Students in private undergraduate colleges: 6
Here:
5.8%
Kentucky:
19.6%
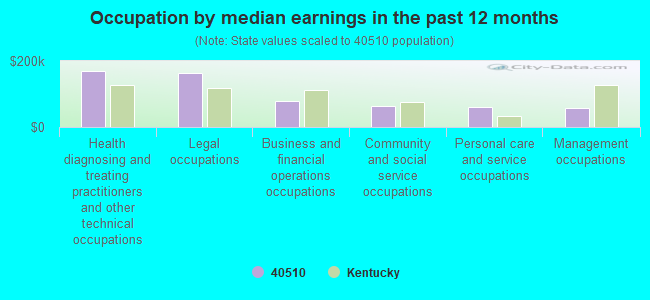
Occupation by median earnings in the past 12 months ($)
168,409Health diagnosing and treating practitioners and other technical occupations
164,771Legal occupations
79,696Business and financial operations occupations
62,449Community and social service occupations
61,919Personal care and service occupations
57,844Management occupations
Companies with federal contracts located in this zip code:
TRUMAN ARNOLD COMPANIES (4029 AIRPORT ROAD, SUITE 1 in LEXINGTON, KY; small business) : $1,340,227 in 2 contractsfrom 2001 to 2004
$890,846 with Defense Logistics Agency for Liquid Propellants and Fuels, Petroleum Base. Signed on 2004-09-27. Completion date: 2008-09-30.
$449,381, same as above.Signed on 2001-08-09. Completion date: 2004-09-30.
THERMAL EQUIPMENT SALES, INC (612 BIZZELL DR in LEXINGTON, KY; small business) : $4,715 in 3 contractsin 2003
$4,879 with Army for Maintenance, Repair or Alteration of Real Property -- Other Airfield Structures. Signed on 2003-07-14. Completion date: 2003-07-29.
$4,071 with Army for Maintenance, Repair or Alteration of Real Property -- Recreational Buildings. Signed on 2003-02-11. Completion date: 2003-03-14.
-$4,235 with Army for Maintenance, Repair or Alteration of Real Property -- Other Airfield Structures. Signed on 2003-07-21. Completion date: 2003-07-29.
Top industries in this zip code by the number of employees in 2005:
Arts, Entertainment, and Recreation: Racetracks (250-499 employees: 1 establishment)
Construction: Water and Sewer Line and Related Structures Construction (100-249: 1)
Construction: Site Preparation Contractors (50-99: 1, 1-4: 2)
Construction: Electrical Contractors (50-99: 1)
People in group quarters in 2010:
1,093 people in college/university student housing
52 people in workers' group living quarters and job corps centers
People in group quarters in 2000:
418 people in agriculture workers' dormitories on farms
Fatal accident statistics in 2011:
Fatal accident count: 2
Vehicles involved in fatal accidents: 3
Fatal accidents caused by drunken drivers: 2
Fatalities: 2
Persons involved in fatal accidents: 4
Pedestrians involved in fatal accidents: 0
Fatal accident statistics in 2010:
Fatal accident count: 3
Vehicles involved in fatal accidents: 5
Fatal accidents caused by drunken drivers: 2
Fatalities: 3
Persons involved in fatal accidents: 7
Pedestrians involved in fatal accidents: 1
Home Mortgage Disclosure Act Aggregated Statistics For Year 2009 (Based on 4 partial tracts)
A) FHA, FSA/RHS & VA Home Purchase Loans
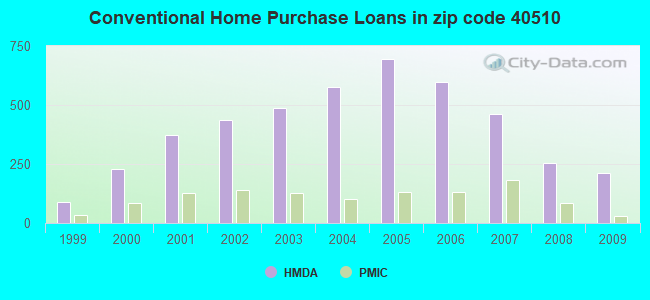
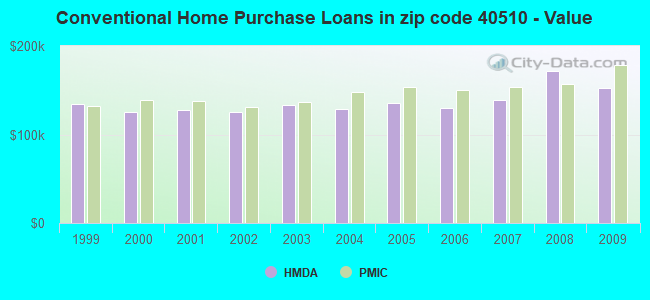
B) Conventional Home Purchase Loans
C) Refinancings
D) Home Improvement Loans
F) Non-occupant Loans on < 5 Family Dwellings (A B C & D)
Number
Average Value
Number
Average Value
Number
Average Value
Number
Average Value
Number
Average Value
LOANS ORIGINATED
194
$148,909
212
$152,233
592
$171,465
17
$51,898
73
$159,501
APPLICATIONS APPROVED, NOT ACCEPTED
8
$138,725
9
$430,683
34
$161,838
3
$118,053
3
$116,697
APPLICATIONS DENIED
18
$139,836
16
$176,388
153
$177,659
14
$57,273
7
$98,104
APPLICATIONS WITHDRAWN
12
$143,068
21
$148,061
112
$174,177
3
$41,830
6
$69,243
FILES CLOSED FOR INCOMPLETENESS
4
$119,535
2
$183,950
23
$180,196
1
$137,870
1
$162,770
Aggregated Statistics For Year 2008 (Based on 4 partial tracts)
A) FHA, FSA/RHS & VA Home Purchase Loans
B) Conventional Home Purchase Loans
C) Refinancings
D) Home Improvement Loans
E) Loans on Dwellings For 5+ Families
F) Non-occupant Loans on < 5 Family Dwellings (A B C & D)
G) Loans On Manufactured Home Dwelling (A B C & D)
Number
Average Value
Number
Average Value
Number
Average Value
Number
Average Value
Number
Average Value
Number
Average Value
Number
Average Value
LOANS ORIGINATED
150
$151,914
253
$171,912
269
$172,507
24
$65,499
1
$48,050
103
$185,069
0
$0
APPLICATIONS APPROVED, NOT ACCEPTED
7
$118,034
19
$151,821
28
$152,186
6
$40,442
0
$0
3
$125,563
0
$0
APPLICATIONS DENIED
15
$150,921
20
$159,890
165
$149,784
21
$83,424
0
$0
12
$114,859
1
$9,780
APPLICATIONS WITHDRAWN
9
$168,447
28
$158,889
58
$172,582
5
$23,858
0
$0
12
$139,224
0
$0
FILES CLOSED FOR INCOMPLETENESS
2
$148,625
3
$118,870
18
$166,738
2
$124,960
0
$0
2
$106,090
0
$0
Aggregated Statistics For Year 2007 (Based on 4 partial tracts)
A) FHA, FSA/RHS & VA Home Purchase Loans
B) Conventional Home Purchase Loans
C) Refinancings
D) Home Improvement Loans
F) Non-occupant Loans on < 5 Family Dwellings (A B C & D)
G) Loans On Manufactured Home Dwelling (A B C & D)
Number
Average Value
Number
Average Value
Number
Average Value
Number
Average Value
Number
Average Value
Number
Average Value
LOANS ORIGINATED
64
$156,594
461
$139,529
296
$141,289
43
$56,690
92
$139,268
2
$65,025
APPLICATIONS APPROVED, NOT ACCEPTED
2
$141,780
40
$142,979
54
$133,027
10
$47,487
8
$135,340
1
$73,330
APPLICATIONS DENIED
12
$151,631
57
$145,586
177
$144,506
41
$38,527
17
$145,812
1
$29,330
APPLICATIONS WITHDRAWN
2
$146,700
40
$145,881
107
$156,980
11
$61,934
12
$175,151
2
$99,735
FILES CLOSED FOR INCOMPLETENESS
2
$82,625
9
$162,059
29
$143,743
1
$39,110
1
$225,360
0
$0
Aggregated Statistics For Year 2006 (Based on 4 partial tracts)
A) FHA, FSA/RHS & VA Home Purchase Loans
B) Conventional Home Purchase Loans
C) Refinancings
D) Home Improvement Loans
F) Non-occupant Loans on < 5 Family Dwellings (A B C & D)
G) Loans On Manufactured Home Dwelling (A B C & D)
Number
Average Value
Number
Average Value
Number
Average Value
Number
Average Value
Number
Average Value
Number
Average Value
LOANS ORIGINATED
91
$155,574
597
$129,791
256
$144,572
43
$47,471
100
$141,804
0
$0
APPLICATIONS APPROVED, NOT ACCEPTED
6
$142,433
45
$123,334
43
$114,136
11
$36,254
3
$117,303
0
$0
APPLICATIONS DENIED
18
$154,112
65
$123,128
175
$128,423
34
$39,189
10
$123,545
2
$57,690
APPLICATIONS WITHDRAWN
3
$184,750
60
$155,666
86
$152,279
3
$57,070
10
$253,753
1
$106,580
FILES CLOSED FOR INCOMPLETENESS
2
$176,495
10
$118,154
21
$160,209
3
$66,077
3
$76,593
0
$0
Aggregated Statistics For Year 2005 (Based on 4 partial tracts)
A) FHA, FSA/RHS & VA Home Purchase Loans
B) Conventional Home Purchase Loans
C) Refinancings
D) Home Improvement Loans
F) Non-occupant Loans on < 5 Family Dwellings (A B C & D)
G) Loans On Manufactured Home Dwelling (A B C & D)
Number
Average Value
Number
Average Value
Number
Average Value
Number
Average Value
Number
Average Value
Number
Average Value
LOANS ORIGINATED
118
$144,384
693
$135,720
315
$130,802
42
$44,904
87
$165,925
1
$5,870
APPLICATIONS APPROVED, NOT ACCEPTED
2
$188,835
61
$127,576
45
$126,249
6
$58,742
1
$225,950
0
$0
APPLICATIONS DENIED
9
$138,413
78
$105,882
172
$147,406
23
$48,580
9
$115,508
0
$0
APPLICATIONS WITHDRAWN
11
$141,828
77
$133,418
108
$155,200
14
$130,787
4
$108,858
0
$0
FILES CLOSED FOR INCOMPLETENESS
1
$174,050
16
$102,884
21
$143,785
3
$18,920
1
$102,670
0
$0
Aggregated Statistics For Year 2004 (Based on 4 partial tracts)
A) FHA, FSA/RHS & VA Home Purchase Loans
B) Conventional Home Purchase Loans
C) Refinancings
D) Home Improvement Loans
E) Loans on Dwellings For 5+ Families
F) Non-occupant Loans on < 5 Family Dwellings (A B C & D)
G) Loans On Manufactured Home Dwelling (A B C & D)
Number
Average Value
Number
Average Value
Number
Average Value
Number
Average Value
Number
Average Value
Number
Average Value
Number
Average Value
LOANS ORIGINATED
120
$127,955
575
$129,074
338
$152,659
21
$32,654
4
$2,998,965
99
$108,476
2
$61,600
APPLICATIONS APPROVED, NOT ACCEPTED
6
$119,455
41
$130,749
45
$160,157
7
$37,104
0
$0
1
$144,710
0
$0
APPLICATIONS DENIED
5
$133,958
62
$132,207
134
$148,062
25
$39,036
0
$0
4
$278,648
2
$30,310
APPLICATIONS WITHDRAWN
16
$127,239
50
$149,811
108
$154,814
8
$59,170
0
$0
2
$181,025
0
$0
FILES CLOSED FOR INCOMPLETENESS
2
$128,090
11
$130,542
18
$151,615
2
$38,625
0
$0
1
$102,670
0
$0
Aggregated Statistics For Year 2003 (Based on 4 partial tracts)
A) FHA, FSA/RHS & VA Home Purchase Loans
B) Conventional Home Purchase Loans
C) Refinancings
D) Home Improvement Loans
F) Non-occupant Loans on < 5 Family Dwellings (A B C & D)
Number
Average Value
Number
Average Value
Number
Average Value
Number
Average Value
Number
Average Value
LOANS ORIGINATED
154
$124,586
487
$132,833
873
$140,133
28
$30,978
87
$121,209
APPLICATIONS APPROVED, NOT ACCEPTED
3
$130,700
37
$147,869
79
$130,484
2
$18,670
3
$128,777
APPLICATIONS DENIED
8
$125,875
38
$132,806
151
$111,526
15
$27,063
5
$102,744
APPLICATIONS WITHDRAWN
6
$113,262
43
$160,934
121
$139,657
3
$20,533
4
$115,182
FILES CLOSED FOR INCOMPLETENESS
3
$109,840
10
$119,050
36
$142,048
2
$42,800
9
$99,187
Aggregated Statistics For Year 2002 (Based on 4 partial tracts)
A) FHA, FSA/RHS & VA Home Purchase Loans
B) Conventional Home Purchase Loans
C) Refinancings
D) Home Improvement Loans
E) Loans on Dwellings For 5+ Families
F) Non-occupant Loans on < 5 Family Dwellings (A B C & D)
Number
Average Value
Number
Average Value
Number
Average Value
Number
Average Value
Number
Average Value
Number
Average Value
LOANS ORIGINATED
136
$120,614
435
$124,988
498
$142,334
19
$24,358
0
$0
68
$116,059
APPLICATIONS APPROVED, NOT ACCEPTED
3
$103,320
31
$122,856
53
$136,052
3
$28,690
1
$2,327,160
0
$0
APPLICATIONS DENIED
9
$112,664
38
$104,768
72
$112,157
8
$29,129
0
$0
5
$104,500
APPLICATIONS WITHDRAWN
5
$132,198
30
$143,525
69
$143,364
0
$0
0
$0
9
$73,873
FILES CLOSED FOR INCOMPLETENESS
1
$111,470
8
$91,685
8
$145,442
1
$33,720
0
$0
1
$104,010
Aggregated Statistics For Year 2001 (Based on 4 partial tracts)
A) FHA, FSA/RHS & VA Home Purchase Loans
B) Conventional Home Purchase Loans
C) Refinancings
D) Home Improvement Loans
E) Loans on Dwellings For 5+ Families
F) Non-occupant Loans on < 5 Family Dwellings (A B C & D)
Number
Average Value
Number
Average Value
Number
Average Value
Number
Average Value
Number
Average Value
Number
Average Value
LOANS ORIGINATED
151
$114,620
373
$127,956
335
$136,195
21
$23,213
0
$0
65
$116,523
APPLICATIONS APPROVED, NOT ACCEPTED
5
$117,282
29
$113,617
24
$99,934
8
$78,766
0
$0
3
$98,367
APPLICATIONS DENIED
8
$126,870
35
$108,827
60
$97,482
10
$27,082
1
$3,540,600
4
$110,405
APPLICATIONS WITHDRAWN
8
$110,369
16
$137,981
45
$113,443
4
$17,980
0
$0
7
$76,493
FILES CLOSED FOR INCOMPLETENESS
0
$0
6
$133,000
11
$99,564
0
$0
0
$0
2
$95,335
Aggregated Statistics For Year 2000 (Based on 4 partial tracts)
A) FHA, FSA/RHS & VA Home Purchase Loans
B) Conventional Home Purchase Loans
C) Refinancings
D) Home Improvement Loans
F) Non-occupant Loans on < 5 Family Dwellings (A B C & D)
Number
Average Value
Number
Average Value
Number
Average Value
Number
Average Value
Number
Average Value
LOANS ORIGINATED
72
$115,753
228
$125,815
71
$117,847
11
$20,503
24
$102,389
APPLICATIONS APPROVED, NOT ACCEPTED
2
$97,290
23
$154,023
11
$77,809
5
$19,586
3
$87,023
APPLICATIONS DENIED
2
$91,890
21
$121,522
33
$79,079
15
$21,201
0
$0
APPLICATIONS WITHDRAWN
4
$106,928
20
$113,628
21
$114,027
2
$20,045
5
$75,970
FILES CLOSED FOR INCOMPLETENESS
3
$119,290
4
$138,202
2
$93,715
0
$0
0
$0
Aggregated Statistics For Year 1999 (Based on 2 partial tracts)
A) FHA, FSA/RHS & VA Home Purchase Loans
B) Conventional Home Purchase Loans
C) Refinancings
D) Home Improvement Loans
F) Non-occupant Loans on < 5 Family Dwellings (A B C & D)
Detailed PMIC statistics for the following Tracts:0037.00
, 0042.02
2004 - 2018 National Fire Incident Reporting System (NFIRS) incidents
Based on the data from the years 2004 - 2018 the average number of fires per year is 16. The highest number of reported fire incidents - 29 took place in 2007, and the least - 6 in 2013. The data has a decreasing trend.
When looking into fire subcategories, the most incidents belonged to: Mobile Property/Vehicle Fires (35.6%), and Outside Fires (34.7%).
Fire incident types reported to NFIRS in Zip Code 40510


 Nearest zip codes: 40504, 40513, 40508, 40503, 40507, 40514.


 Based on the data from the years 2004 - 2018 the average number of fires per year is 16. The highest number of reported fire incidents - 29 took place in 2007, and the least - 6 in 2013. The data has a decreasing trend.
 When looking into fire subcategories, the most incidents belonged to: Mobile Property/Vehicle Fires (35.6%), and Outside Fires (34.7%).