Estimated zip code population in 2022: 3,189 Zip code population in 2010: 2,712 Zip code population in 2000: 2,340
Houses and condos: 1,333 Renter-occupied apartments: 206
% of renters here:
16%
State:
31%
March 2022 cost of living index in zip code 41059: 81.7 (low, U.S. average is 100)
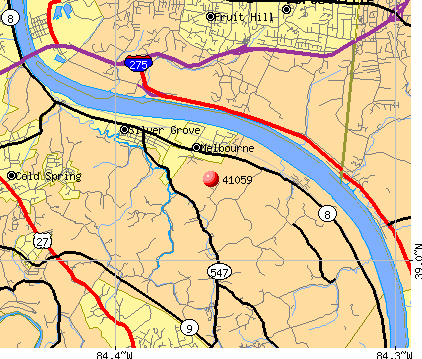
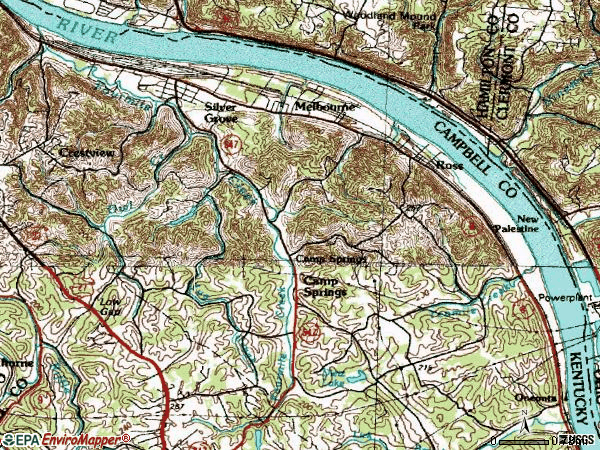
Land area: 13.6 sq. mi. Water area: 2.3 sq. mi.
Population density: 234 people per square mile
(very low).
OSM Map
General Map
Google Map
MSN Map
OSM Map
General Map
Google Map
MSN Map
OSM Map
General Map
Google Map
MSN Map
OSM Map
General Map
Google Map
MSN Map
Please wait while loading the map...
Real estate property taxes paid for housing units in 2022:
This zip code:
0.9% ($1,961)
Kentucky:
0.7% ($1,456)
Median real estate property taxes paid for housing units with mortgages in 2022: $2,074 (1.0%) Median real estate property taxes paid for housing units with no mortgage in 2022: $1,663 (0.7%)
Estimated median house/condo value in 2022: $213,268
41059:
$213,268
Kentucky:
$196,300
According to our research of Kentucky and other state lists, there were 4 registered sex offenders living in 41059 zip code as of May 28, 2024. The ratio of all residents to sex offenders in zip code 41059 is 644 to 1. The ratio of registered sex offenders to all residents in this zip code is lower than the state average.
Median resident age:
This zip code:
44.6 years
Kentucky median age:
39.4 years
Average household size:
This zip code:
2.3 people
Kentucky:
2.4 people
Averages for the 2020 tax year for zip code 41059, filed in 2021:
Average Adjusted Gross Income (AGI) in 2020: $71,689 (Individual Income Tax Returns)
Here:
$71,689
State:
$61,342
Salary/wage: $60,531 (reported on 78.4% of returns)
Here:
$60,531
State:
$50,827
(% of AGI for various income ranges: 1028.6% for AGIs below $25k, 3462.7% for AGIs $25k-50k, 6258.6% for AGIs $50k-75k, 9850.0% for AGIs $75k-100k, 17901.7% for AGIs $100k-200k, 67755.0% for AGIs over 200k)
Taxable interest for individuals: $859 (reported on 29.1% of returns)
This zip code:
$859
Kentucky:
$1,441
(% of AGI for various income ranges: 8.2% for AGIs below $25k, 5.8% for AGIs $25k-50k, 57.1% for AGIs $50k-75k, 76.2% for AGIs $75k-100k, 67.5% for AGIs $100k-200k, 375.0% for AGIs over 200k)
Ordinary dividends: $5,497 (reported on 26.1% of returns)
Here:
$5,497
State:
$7,388
(% of AGI for various income ranges: 38.6% for AGIs below $25k, 49.2% for AGIs $25k-50k, 90.7% for AGIs $50k-75k, 318.8% for AGIs $75k-100k, 364.2% for AGIs $100k-200k, 4345.0% for AGIs over 200k)
Net capital gain/loss in AGI: +$22,793 (reported on 20.1% of returns)
Here:
+$22,793
State:
+$19,475
(% of AGI for various income ranges: 30.4% for AGIs below $25k, 27.7% for AGIs $25k-50k, 109.3% for AGIs $50k-75k, 332.5% for AGIs $75k-100k, 550.0% for AGIs $100k-200k, 24590.0% for AGIs over 200k)
Profit/loss from business: +$13,100 (reported on 12.7% of returns)
Here:
+$13,100
State:
+$11,386
(% of AGI for various income ranges: 128.6% for AGIs below $25k, 75.4% for AGIs $25k-50k, 308.6% for AGIs $50k-75k, 528.8% for AGIs $75k-100k, 680.0% for AGIs $100k-200k)
Taxable individual retirement arrangement distribution: $17,607 (reported on 11.2% of returns)
41059:
$17,607
Kentucky:
$18,941
(% of AGI for various income ranges: 76.8% for AGIs below $25k, 160.4% for AGIs $25k-50k, 220.7% for AGIs $50k-75k, 765.0% for AGIs $75k-100k, 906.7% for AGIs $100k-200k)
Total itemized deductions: $28,140 (reported on 7.5% of returns)
Here:
$28,140
State:
$32,473
(% of AGI for various income ranges: 687.9% for AGIs $50k-75k, 586.7% for AGIs $100k-200k, 5735.0% for AGIs over 200k)
Charity contributions: $7,825 (reported on 6.0% of returns)
Here:
$7,825
State:
$13,472
(% of AGI for various income ranges: 67.1% for AGIs $50k-75k, 186.7% for AGIs $100k-200k, 1540.0% for AGIs over 200k)
Taxes paid: $6,964 (reported on 8.2% of returns)
41059:
$6,964
State:
$7,830
(% of AGI for various income ranges: 192.9% for AGIs $50k-75k, 199.2% for AGIs $100k-200k, 1285.0% for AGIs over 200k)
Earned income credit: $1,862 (reported on 11.9% of returns)
Here:
$1,862
State:
$2,336
(% of AGI for various income ranges: 68.6% for AGIs below $25k, 40.8% for AGIs $25k-50k)
Percentage of individuals using paid preparers for their 2020 taxes: 94.0%
Here:
94%
State:
94%
(% for various income ranges: 95.0% for AGIs below $25k, 93.8% for AGIs $25k-50k, 95.0% for AGIs $50k-75k, 85.7% for AGIs $75k-100k, 95.5% for AGIs $100k-200k, 100.0% for AGIs over 200k)
Averages for the 2012 tax year for zip code 41059, filed in 2013:
Average Adjusted Gross Income (AGI) in 2012: $55,827 (Individual Income Tax Returns)
Here:
$55,827
State:
$50,814
Salary/wage: $49,450 (reported on 85.8% of returns)
Here:
$49,450
State:
$42,723
(% of AGI for various income ranges: 70.7% for AGIs below $25k, 77.7% for AGIs $25k-50k, 79.2% for AGIs $50k-75k, 80.2% for AGIs $75k-100k, 77.9% for AGIs $100k-200k, 64.3% for AGIs over 200k)
Taxable interest for individuals: $676 (reported on 35.4% of returns)
This zip code:
$676
Kentucky:
$1,381
(% of AGI for various income ranges: 0.9% for AGIs below $25k, 0.8% for AGIs $25k-50k, 0.1% for AGIs $50k-75k, 0.4% for AGIs $75k-100k, 0.3% for AGIs $100k-200k, 0.5% for AGIs over 200k)
Ordinary dividends: $4,264 (reported on 26.0% of returns)
Here:
$4,264
State:
$6,239
(% of AGI for various income ranges: 1.5% for AGIs below $25k, 1.6% for AGIs $25k-50k, 0.9% for AGIs $50k-75k, 1.0% for AGIs $75k-100k, 1.3% for AGIs $100k-200k, 6.7% for AGIs over 200k)
Net capital gain/loss in AGI: +$3,200 (reported on 15.7% of returns)
Here:
+$3,200
State:
+$11,336
(% of AGI for various income ranges: 0.2% for AGIs $50k-75k, 1.1% for AGIs $100k-200k, 4.0% for AGIs over 200k)
Profit/loss from business: +$6,925 (reported on 12.6% of returns)
Here:
+$6,925
State:
+$10,862
(% of AGI for various income ranges: 9.1% for AGIs below $25k, 2.7% for AGIs $25k-50k, 1.4% for AGIs $50k-75k, 0.8% for AGIs $100k-200k)
Taxable individual retirement arrangement distribution: $15,023 (reported on 10.2% of returns)
41059:
$15,023
Kentucky:
$14,296
(% of AGI for various income ranges: 3.4% for AGIs below $25k, 2.9% for AGIs $25k-50k, 5.3% for AGIs $50k-75k, 4.1% for AGIs $100k-200k)
Total itemized deductions: $19,617 (20% of AGI, reported on 37.8% of returns)
Here:
$19,617
State:
$21,160
Here:
20.1% of AGI
State:
20.0% of AGI
(% of AGI for various income ranges: 9.4% for AGIs below $25k, 8.6% for AGIs $25k-50k, 13.6% for AGIs $50k-75k, 13.2% for AGIs $75k-100k, 15.3% for AGIs $100k-200k, 16.1% for AGIs over 200k)
Charity contributions: $2,919 (reported on 33.1% of returns)
Here:
$2,919
State:
$4,303
(% of AGI for various income ranges: 0.7% for AGIs below $25k, 0.9% for AGIs $25k-50k, 1.5% for AGIs $50k-75k, 1.7% for AGIs $75k-100k, 1.8% for AGIs $100k-200k, 3.4% for AGIs over 200k)
Taxes paid: $8,610 (reported on 37.8% of returns)
41059:
$8,610
State:
$8,496
(% of AGI for various income ranges: 2.3% for AGIs below $25k, 2.6% for AGIs $25k-50k, 5.3% for AGIs $50k-75k, 6.0% for AGIs $75k-100k, 8.1% for AGIs $100k-200k, 7.1% for AGIs over 200k)
Earned income credit: $2,033 (reported on 14.2% of returns)
Here:
$2,033
State:
$2,273
(% of AGI for various income ranges: 5.3% for AGIs below $25k, 0.8% for AGIs $25k-50k)
Percentage of individuals using paid preparers for their 2012 taxes: 60.6%
Here:
61%
State:
60%
(% for various income ranges: 55.6% for AGIs below $25k, 63.3% for AGIs $25k-50k, 60.0% for AGIs $50k-75k, 64.3% for AGIs $75k-100k, 60.0% for AGIs $100k-200k, 100.0% for AGIs over 200k)
Averages for the 2004 tax year for zip code 41059, filed in 2005:
Average Adjusted Gross Income (AGI) in 2004: $44,019 (Individual Income Tax Returns)
Here:
$44,019
State:
$41,540
Salary/wage: $40,609 (reported on 88.4% of returns)
Here:
$40,609
State:
$36,432
(% of AGI for various income ranges: 130.5% for AGIs below $10k, 79.1% for AGIs $10k-25k, 83.1% for AGIs $25k-50k, 83.9% for AGIs $50k-75k, 90.3% for AGIs $75k-100k, 71.8% for AGIs over 100k)
Taxable interest for individuals: $807 (reported on 44.6% of returns)
This zip code:
$807
Kentucky:
$1,571
(% of AGI for various income ranges: 7.2% for AGIs below $10k, 2.1% for AGIs $10k-25k, 0.8% for AGIs $25k-50k, 0.5% for AGIs $50k-75k, 0.3% for AGIs $75k-100k, 0.7% for AGIs over 100k)
Taxable dividends: $2,232 (reported on 30.0% of returns)
Here:
$2,232
State:
$3,453
(% of AGI for various income ranges: 3.0% for AGIs below $10k, 1.4% for AGIs $10k-25k, 1.2% for AGIs $25k-50k, 0.7% for AGIs $50k-75k, 0.9% for AGIs $75k-100k, 2.7% for AGIs over 100k)
Net capital gain/loss: +$3,330 (reported on 18.0% of returns)
Here:
+$3,330
State:
+$9,663
(% of AGI for various income ranges: -2.1% for AGIs below $10k, -0.5% for AGIs $10k-25k, 0.4% for AGIs $25k-50k, -0.0% for AGIs $50k-75k, -0.1% for AGIs $75k-100k, 4.6% for AGIs over 100k)
Profit/loss from business: +$10,136 (reported on 13.8% of returns)
Here:
+$10,136
State:
+$9,233
(% of AGI for various income ranges: -1.4% for AGIs below $10k, 5.8% for AGIs $10k-25k, 2.3% for AGIs $25k-50k, 3.3% for AGIs $50k-75k, 0.5% for AGIs $75k-100k, 4.7% for AGIs over 100k)
IRA payment deduction: $2,739 (reported on 1.8% of returns)
41059:
$2,739
Kentucky:
$2,955
Total itemized deductions: $16,687 (22% of AGI, reported on 39.5% of returns)
Here:
$16,687
State:
$17,474
Here:
21.9% of AGI
State:
21.0% of AGI
(% of AGI for various income ranges: 28.4% for AGIs below $10k, 7.8% for AGIs $10k-25k, 13.0% for AGIs $25k-50k, 14.6% for AGIs $50k-75k, 18.0% for AGIs $75k-100k, 16.1% for AGIs over 100k)
Charity contributions deductions: $2,385 (3% of AGI, reported on 35.4% of returns)
Here:
$2,385
State:
$3,494
Here:
3.0% of AGI
State:
4.0% of AGI
(% of AGI for various income ranges: 1.4% for AGIs below $10k, 1.1% for AGIs $10k-25k, 1.8% for AGIs $25k-50k, 1.5% for AGIs $50k-75k, 2.2% for AGIs $75k-100k, 2.3% for AGIs over 100k)
Total tax: $5,579 (reported on 79.5% of returns)
41059:
$5,579
State:
$6,162
(% of AGI for various income ranges: 4.9% for AGIs below $10k, 4.8% for AGIs $10k-25k, 6.9% for AGIs $25k-50k, 9.0% for AGIs $50k-75k, 9.2% for AGIs $75k-100k, 15.3% for AGIs over 100k)
Earned income credit: $1,622 (reported on 10.6% of returns)
Here:
$1,622
State:
$1,723
Percentage of individuals using paid preparers for their 2004 taxes: 60.0%
Here:
60%
State:
66%
(% for various income ranges: 56.1% for AGIs below $10k, 60.6% for AGIs $10k-25k, 61.6% for AGIs $25k-50k, 61.1% for AGIs $50k-75k, 60.7% for AGIs $75k-100k, 59.8% for AGIs over 100k)
Household received Food Stamps/SNAP in the past 12 months: 32 Household did not receive Food Stamps/SNAP in the past 12 months: 1,271
Women who had a birth in the past 12 months: 4 (4 now married, 0 unmarried) Women who did not have a birth in the past 12 months: 720 (305 now married, 414 unmarried)
Housing units in zip code 41059 with a mortgage: 591 (65 second mortgage, 65 both second mortgage and home equity loan) Houses without a mortgage: 14
Median monthly owner costs for units with a mortgage: $1,479 Median monthly owner costs for units without a mortgage: $549
Residents with income below the poverty level in 2022:
This zip code:
11.6%
Whole state:
16.5%
Residents with income below 50% of the poverty level in 2022:
This zip code:
6.0%
Whole state:
9.0%
Median number of rooms in houses and condos:
Here:
6.3
State:
6.4
Median number of rooms in apartments:
Here:
2.7
State:
4.4
Notable locations in this zip code not listed on our city pages
Notable locations in zip code 41059: Campbell County Fire Protection District 1 Camp Springs Station (A), Fire Protection District 6 Melbourne Station (B). Display/hide their locations on the map
Churches in zip code 41059 include: Oakland Church (A), Saint Josephs Church (B), Saint Annes Convent (C), Saint Johns Church (D). Display/hide their locations on the map
In group quarters: 143 (-1 institutionalized population)
Size of family households: 341 2-persons, 126 3-persons, 125 4-persons, 49 5-persons, 64 6-persons, 12 7-or-more-persons
Size of nonfamily households: 463 1-person, 102 2-persons, 19 3-persons
564 married couples with children.
79 single-parent households (79 women).
99.6% of residents of 41059 zip code speak English at home.
0.1% of residents speak Spanish at home (100% very well).
0.3% of residents speak other Indo-European language at home (100% very well).
Foreign born population: 21 (0.7%) (0.0% of them are naturalized citizens)
:
0.7%
Whole state:
4.0%
87%France
9%Bhutan
56%German
12%American
11%English
5%Irish
2%European
1%Scottish
1%Scotch-Irish
Year of entry for the foreign-born population
22010 or later
42000 to 2009
01990 to 1999
19Before 1990
Major facilities with environmental interests located in this zip code:
PRESTRESS SERV OF MELBOURNE (MARY INGLES HWY KY HWY 8 in MELBOURNE, KY)
CRITERIA AND HAZARDOUS AIR POLLUTANT INVENTORY (Inventory of air pollution sources) National Pollutant Discharge Elimination System NON-MAJOR (Tracking pollutant discharge elimination systems) - permit Business SIC classification: CONCRETE PRODUCTS, EXCEPT BLOCK AND BRICK Organizations: PRESTRESS SERVICES INC (CONTACT/OWNER)
Alternative names: PRESTRESS SERV MELB INC
ALLENDER RESIDENCE (36 FOUR MILE RD in MELBOURNE, KY)
National Pollutant Discharge Elimination System NON-MAJOR (Tracking pollutant discharge elimination systems) - permit Business SIC classification: OPERATORS OF DWELLINGS OTHER THAN APARTMENT BUILDINGS
BACH RESIDENCE (2989 TEN MILE RD in CAMP SPRINGS, KY)
National Pollutant Discharge Elimination System NON-MAJOR (Tracking pollutant discharge elimination systems) - permit Business SIC classification: OPERATORS OF DWELLINGS OTHER THAN APARTMENT BUILDINGS
BERKEYMEYER RESIDENCE (6555 VINEYARD LN in MELBOURNE, KY)
National Pollutant Discharge Elimination System NON-MAJOR (Tracking pollutant discharge elimination systems) - permit Business SIC classification: OPERATORS OF DWELLINGS OTHER THAN APARTMENT BUILDINGS Organizations: BERKEMEYER RESIDENCE (CONTACT/OWNER)
Alternative names: BERKEMEYER RESIDENCE
BEZOLD RESIDENCE (2814 NINE MILE RD in MELBOURNE, KY)
National Pollutant Discharge Elimination System NON-MAJOR (Tracking pollutant discharge elimination systems) - permit Business SIC classification: OPERATORS OF DWELLINGS OTHER THAN APARTMENT BUILDINGS
BORN RESIDENCE (BOX 247-A FOUR MILE RD in MELBOURNE, KY)
National Pollutant Discharge Elimination System NON-MAJOR (Tracking pollutant discharge elimination systems) - permit Business SIC classification: OPERATORS OF DWELLINGS OTHER THAN APARTMENT BUILDINGS
CAMP SPRINGS TAVERN (218 FOUR & TWELVE MILE RD in MELBOURNE, KY)
National Pollutant Discharge Elimination System NON-MAJOR (Tracking pollutant discharge elimination systems) - permit Business SIC classification: DRINKING PLACES (ALCOHOLIC BEVERAGES)
CONNLEY RESIDENCE (213A FOUR & TWELVE MILE RD in CAMP SPRINGS, KY)
National Pollutant Discharge Elimination System NON-MAJOR (Tracking pollutant discharge elimination systems) - permit Business SIC classification: OPERATORS OF DWELLINGS OTHER THAN APARTMENT BUILDINGS
COUCH RESIDENCE (DARLINGTON RD in MELBOURNE, KY)
National Pollutant Discharge Elimination System NON-MAJOR (Tracking pollutant discharge elimination systems) - permit Business SIC classification: OPERATORS OF DWELLINGS OTHER THAN APARTMENT BUILDINGS
COX RESIDENCE (FOUR & TWELVE MILE RD in CAMP SPRINGS, KY)
National Pollutant Discharge Elimination System NON-MAJOR (Tracking pollutant discharge elimination systems) - permit Business SIC classification: OPERATORS OF DWELLINGS OTHER THAN APARTMENT BUILDINGS
MEYER RESIDENCE (FOUR MILE RD KY RT 547 in MELBOURNE, KY)
National Pollutant Discharge Elimination System NON-MAJOR (Tracking pollutant discharge elimination systems) - permit Business SIC classification: OPERATORS OF DWELLINGS OTHER THAN APARTMENT BUILDINGS
NORTHERN KENTUCKY SADDLE CLUB (200 POPLAR RIDGE ROAD in MELBOURNE, KY)
National Pollutant Discharge Elimination System NON-MAJOR (Tracking pollutant discharge elimination systems) - permit Business SIC classification: PROFESSIONAL SPORTS CLUBS AND PROMOTERS Organizations: NORTHERN KY SADDLE CLUB (CONTACT/OWNER)
PARNELL RESIDENCE (2942 EIGHT MILE RD in MELBOURNE, KY)
National Pollutant Discharge Elimination System NON-MAJOR (Tracking pollutant discharge elimination systems) - permit Business SIC classification: OPERATORS OF DWELLINGS OTHER THAN APARTMENT BUILDINGS
Housing units lacking complete plumbing facilities: 0.1% Housing units lacking complete kitchen facilities: 1.7%
59.4%Electricity
16.7%Bottled, tank, or LP gas
13.9%Fuel oil, kerosene, etc.
4.1%Utility gas
3.2%Wood
2.6%No fuel used
Population in 1990: 2,688.
Place of birth for U.S.-born residents:
This state: 1,916
Northeast: 34
Midwest: 1,025
South: 124
West: 63
73% of the 41059 zip code residents lived in the same house 5 years ago. Out of people who lived in different houses, 57% lived in this county. Out of people who lived in different counties, 50% lived in Kentucky.
94% of the 41059 zip code residents lived in the same house 1 year ago. Out of people who lived in different houses, 40% moved from this county. Out of people who lived in different houses, 40% moved from different county within same state. Out of people who lived in different houses, 23% moved from different state.
Private vs. public school enrollment:
Students in private schools in grades 1 to 8 (elementary and middle school): 171
Here:
35.6%
Kentucky:
17.2%
Students in private schools in grades 9 to 12 (high school): 83
Here:
41.1%
Kentucky:
15.2%
Students in private undergraduate colleges: 12
Here:
31.8%
Kentucky:
19.6%
Occupation by median earnings in the past 12 months ($)
245,881Health diagnosing and treating practitioners and other technical occupations
127,041Computer and mathematical occupations
104,674Sales and related occupations
91,648Management occupations
62,646Transportation occupations
61,400Health technologists and technicians
Top industries in this zip code by the number of employees in 2005:
Other Services (except Public Administration): Religious Organizations (20-49 employees: 1 establishment, 10-19 employees: 1 establishment, 1-4 employees: 1 establishment)
Construction: Framing Contractors (5-9: 1)
Construction: Residential Remodelers (1-4: 2)
Construction: Tile and Terrazzo Contractors (1-4: 2)
Accommodation and Food Services: Drinking Places (Alcoholic Beverages) (1-4: 2)
Construction: Site Preparation Contractors (1-4: 1)
Construction: Commercial and Institutional Building Construction (1-4: 1)
People in group quarters in 2010:
77 people in other noninstitutional facilities
People in group quarters in 2000:
79 people in religious group quarters
Fatal accident statistics in 2011:
Fatal accident count: 1
Vehicles involved in fatal accidents: 1
Fatal accidents caused by drunken drivers: 1
Fatalities: 1
Persons involved in fatal accidents: 1
Pedestrians involved in fatal accidents: 1
Home Mortgage Disclosure Act Aggregated Statistics For Year 2009 (Based on 4 partial tracts)
A) FHA, FSA/RHS & VA Home Purchase Loans
B) Conventional Home Purchase Loans
C) Refinancings
D) Home Improvement Loans
F) Non-occupant Loans on < 5 Family Dwellings (A B C & D)
G) Loans On Manufactured Home Dwelling (A B C & D)
Number
Average Value
Number
Average Value
Number
Average Value
Number
Average Value
Number
Average Value
Number
Average Value
LOANS ORIGINATED
45
$131,682
38
$141,189
301
$145,716
5
$94,568
5
$69,946
1
$24,760
APPLICATIONS APPROVED, NOT ACCEPTED
2
$127,545
2
$219,160
9
$184,660
0
$0
0
$0
0
$0
APPLICATIONS DENIED
3
$120,143
4
$89,432
87
$153,363
10
$44,799
2
$77,165
3
$95,367
APPLICATIONS WITHDRAWN
1
$98,210
4
$123,488
43
$150,930
0
$0
1
$116,150
1
$80,700
FILES CLOSED FOR INCOMPLETENESS
1
$173,200
1
$235,100
13
$142,860
0
$0
1
$237,850
0
$0
Aggregated Statistics For Year 2008 (Based on 4 partial tracts)
A) FHA, FSA/RHS & VA Home Purchase Loans
B) Conventional Home Purchase Loans
C) Refinancings
D) Home Improvement Loans
E) Loans on Dwellings For 5+ Families
F) Non-occupant Loans on < 5 Family Dwellings (A B C & D)
G) Loans On Manufactured Home Dwelling (A B C & D)
Number
Average Value
Number
Average Value
Number
Average Value
Number
Average Value
Number
Average Value
Number
Average Value
Number
Average Value
LOANS ORIGINATED
26
$139,285
41
$149,830
132
$147,980
7
$41,323
1
$302,610
6
$104,218
1
$43,100
APPLICATIONS APPROVED, NOT ACCEPTED
2
$84,785
4
$115,578
9
$122,089
0
$0
0
$0
0
$0
1
$44,670
APPLICATIONS DENIED
4
$145,758
7
$218,219
87
$162,046
14
$34,993
0
$0
7
$97,301
2
$102,705
APPLICATIONS WITHDRAWN
7
$120,013
5
$153,370
31
$144,351
1
$71,100
0
$0
1
$150,510
0
$0
FILES CLOSED FOR INCOMPLETENESS
0
$0
0
$0
6
$155,210
0
$0
0
$0
0
$0
0
$0
Aggregated Statistics For Year 2007 (Based on 4 partial tracts)
A) FHA, FSA/RHS & VA Home Purchase Loans
B) Conventional Home Purchase Loans
C) Refinancings
D) Home Improvement Loans
F) Non-occupant Loans on < 5 Family Dwellings (A B C & D)
G) Loans On Manufactured Home Dwelling (A B C & D)
Number
Average Value
Number
Average Value
Number
Average Value
Number
Average Value
Number
Average Value
Number
Average Value
LOANS ORIGINATED
23
$176,110
102
$139,497
144
$120,078
18
$28,839
14
$117,797
0
$0
APPLICATIONS APPROVED, NOT ACCEPTED
0
$0
8
$124,790
29
$122,503
10
$54,456
2
$93,220
1
$82,250
APPLICATIONS DENIED
4
$142,112
13
$82,322
117
$125,521
28
$70,440
5
$153,844
5
$33,450
APPLICATIONS WITHDRAWN
0
$0
7
$137,426
35
$124,137
4
$66,842
3
$78,763
0
$0
FILES CLOSED FOR INCOMPLETENESS
0
$0
0
$0
8
$119,764
1
$82,530
0
$0
0
$0
Aggregated Statistics For Year 2006 (Based on 4 partial tracts)
A) FHA, FSA/RHS & VA Home Purchase Loans
B) Conventional Home Purchase Loans
C) Refinancings
D) Home Improvement Loans
F) Non-occupant Loans on < 5 Family Dwellings (A B C & D)
G) Loans On Manufactured Home Dwelling (A B C & D)
Number
Average Value
Number
Average Value
Number
Average Value
Number
Average Value
Number
Average Value
Number
Average Value
LOANS ORIGINATED
19
$130,299
110
$135,277
139
$123,822
19
$41,880
15
$106,451
1
$103,620
APPLICATIONS APPROVED, NOT ACCEPTED
1
$39,430
8
$96,558
23
$119,944
4
$34,030
1
$95,070
1
$39,430
APPLICATIONS DENIED
4
$145,575
15
$118,243
84
$115,344
16
$28,811
3
$58,807
2
$72,855
APPLICATIONS WITHDRAWN
0
$0
9
$118,323
36
$122,437
6
$64,022
3
$68,843
1
$34,850
FILES CLOSED FOR INCOMPLETENESS
0
$0
1
$179,970
10
$110,209
1
$36,600
0
$0
0
$0
Aggregated Statistics For Year 2005 (Based on 4 partial tracts)
A) FHA, FSA/RHS & VA Home Purchase Loans
B) Conventional Home Purchase Loans
C) Refinancings
D) Home Improvement Loans
E) Loans on Dwellings For 5+ Families
F) Non-occupant Loans on < 5 Family Dwellings (A B C & D)
G) Loans On Manufactured Home Dwelling (A B C & D)
Number
Average Value
Number
Average Value
Number
Average Value
Number
Average Value
Number
Average Value
Number
Average Value
Number
Average Value
LOANS ORIGINATED
9
$121,442
114
$141,297
161
$112,894
21
$28,767
1
$725,700
15
$88,814
2
$113,935
APPLICATIONS APPROVED, NOT ACCEPTED
1
$239,610
16
$94,358
13
$92,415
2
$13,305
0
$0
0
$0
0
$0
APPLICATIONS DENIED
1
$106,920
14
$109,794
78
$110,978
17
$38,531
0
$0
2
$118,530
5
$65,926
APPLICATIONS WITHDRAWN
1
$134,800
7
$128,961
49
$135,603
1
$141,270
0
$0
3
$133,177
1
$55,020
FILES CLOSED FOR INCOMPLETENESS
0
$0
1
$99,950
10
$83,696
3
$95,960
0
$0
0
$0
0
$0
Aggregated Statistics For Year 2004 (Based on 4 partial tracts)
A) FHA, FSA/RHS & VA Home Purchase Loans
B) Conventional Home Purchase Loans
C) Refinancings
D) Home Improvement Loans
F) Non-occupant Loans on < 5 Family Dwellings (A B C & D)
G) Loans On Manufactured Home Dwelling (A B C & D)
Number
Average Value
Number
Average Value
Number
Average Value
Number
Average Value
Number
Average Value
Number
Average Value
LOANS ORIGINATED
25
$129,756
103
$132,847
216
$123,012
19
$22,410
12
$99,652
1
$117,080
APPLICATIONS APPROVED, NOT ACCEPTED
1
$172,230
11
$160,886
34
$110,259
5
$22,206
0
$0
1
$179,410
APPLICATIONS DENIED
3
$103,607
11
$107,397
91
$120,355
18
$37,803
2
$164,285
2
$46,920
APPLICATIONS WITHDRAWN
0
$0
11
$116,611
66
$131,986
3
$38,930
1
$123,850
0
$0
FILES CLOSED FOR INCOMPLETENESS
1
$120,130
3
$175,453
18
$117,943
1
$44,030
0
$0
0
$0
Aggregated Statistics For Year 2003 (Based on 4 partial tracts)
A) FHA, FSA/RHS & VA Home Purchase Loans
B) Conventional Home Purchase Loans
C) Refinancings
D) Home Improvement Loans
F) Non-occupant Loans on < 5 Family Dwellings (A B C & D)
Number
Average Value
Number
Average Value
Number
Average Value
Number
Average Value
Number
Average Value
LOANS ORIGINATED
30
$130,628
119
$118,547
540
$124,953
18
$43,736
15
$73,961
APPLICATIONS APPROVED, NOT ACCEPTED
4
$130,885
14
$96,675
50
$126,072
8
$25,765
4
$88,955
APPLICATIONS DENIED
2
$128,875
21
$88,887
92
$119,675
15
$32,891
1
$59,240
APPLICATIONS WITHDRAWN
0
$0
12
$142,960
59
$125,439
2
$12,840
1
$106,240
FILES CLOSED FOR INCOMPLETENESS
0
$0
3
$82,190
14
$125,441
1
$43,620
0
$0
Aggregated Statistics For Year 2002 (Based on 4 partial tracts)
A) FHA, FSA/RHS & VA Home Purchase Loans
B) Conventional Home Purchase Loans
C) Refinancings
D) Home Improvement Loans
F) Non-occupant Loans on < 5 Family Dwellings (A B C & D)
Number
Average Value
Number
Average Value
Number
Average Value
Number
Average Value
Number
Average Value
LOANS ORIGINATED
19
$106,272
81
$120,895
382
$121,498
11
$17,201
10
$80,303
APPLICATIONS APPROVED, NOT ACCEPTED
0
$0
16
$82,499
54
$115,044
7
$14,566
1
$77,410
APPLICATIONS DENIED
5
$85,888
15
$53,347
69
$112,399
14
$15,084
0
$0
APPLICATIONS WITHDRAWN
1
$108,210
4
$116,232
64
$112,292
3
$25,757
0
$0
FILES CLOSED FOR INCOMPLETENESS
0
$0
2
$210,450
18
$108,856
2
$20,475
0
$0
Aggregated Statistics For Year 2001 (Based on 4 partial tracts)
A) FHA, FSA/RHS & VA Home Purchase Loans
B) Conventional Home Purchase Loans
C) Refinancings
D) Home Improvement Loans
F) Non-occupant Loans on < 5 Family Dwellings (A B C & D)
Number
Average Value
Number
Average Value
Number
Average Value
Number
Average Value
Number
Average Value
LOANS ORIGINATED
19
$102,813
102
$115,489
322
$114,530
19
$16,095
8
$55,085
APPLICATIONS APPROVED, NOT ACCEPTED
0
$0
12
$114,127
33
$108,972
7
$16,420
0
$0
APPLICATIONS DENIED
2
$96,745
13
$72,521
82
$85,789
15
$13,137
5
$57,184
APPLICATIONS WITHDRAWN
2
$103,165
8
$116,571
50
$106,561
3
$15,740
0
$0
FILES CLOSED FOR INCOMPLETENESS
0
$0
2
$115,460
9
$136,659
1
$94,340
0
$0
Aggregated Statistics For Year 2000 (Based on 4 partial tracts)
A) FHA, FSA/RHS & VA Home Purchase Loans
B) Conventional Home Purchase Loans
C) Refinancings
D) Home Improvement Loans
F) Non-occupant Loans on < 5 Family Dwellings (A B C & D)
Number
Average Value
Number
Average Value
Number
Average Value
Number
Average Value
Number
Average Value
LOANS ORIGINATED
24
$99,161
73
$106,140
76
$107,002
42
$18,416
3
$77,087
APPLICATIONS APPROVED, NOT ACCEPTED
0
$0
7
$63,656
21
$70,100
18
$18,468
0
$0
APPLICATIONS DENIED
4
$85,235
8
$91,038
49
$86,252
18
$16,215
0
$0
APPLICATIONS WITHDRAWN
0
$0
8
$95,782
19
$86,895
2
$31,635
0
$0
FILES CLOSED FOR INCOMPLETENESS
0
$0
1
$100,870
6
$101,140
1
$17,420
0
$0
Aggregated Statistics For Year 1999 (Based on 2 partial tracts)
A) FHA, FSA/RHS & VA Home Purchase Loans
B) Conventional Home Purchase Loans
C) Refinancings
D) Home Improvement Loans
F) Non-occupant Loans on < 5 Family Dwellings (A B C & D)
Detailed PMIC statistics for the following Tracts:0519.01
, 0531.00
2002 - 2018 National Fire Incident Reporting System (NFIRS) incidents
Based on the data from the years 2002 - 2018 the average number of fire incidents per year is 14. The highest number of reported fires - 27 took place in 2014, and the least - 0 in 2006. The data has a declining trend.
When looking into fire subcategories, the most incidents belonged to: Structure Fires (41.2%), and Outside Fires (34.2%).
Fire incident types reported to NFIRS in Zip Code 41059


 Nearest zip codes: 41085, 45255, 45230, 45245, 41076, 45244.


 Based on the data from the years 2002 - 2018 the average number of fire incidents per year is 14. The highest number of reported fires - 27 took place in 2014, and the least - 0 in 2006. The data has a declining trend.
 When looking into fire subcategories, the most incidents belonged to: Structure Fires (41.2%), and Outside Fires (34.2%).