Estimated zip code population in 2022: 1,553 Zip code population in 2010: 1,849 Zip code population in 2000: 1,675
Houses and condos: 654 Renter-occupied apartments: 21
% of renters here:
3%
State:
31%
March 2022 cost of living index in zip code 41080: 78.2 (low, U.S. average is 100)
Land area: 28.3 sq. mi. Water area: 3.1 sq. mi.
Population density: 55 people per square mile
(very low).
OSM Map
General Map
Google Map
MSN Map
OSM Map
General Map
Google Map
MSN Map
OSM Map
General Map
Google Map
MSN Map
OSM Map
General Map
Google Map
MSN Map
Please wait while loading the map...
Real estate property taxes paid for housing units in 2022:
This zip code:
0.9% ($2,022)
Kentucky:
0.7% ($1,456)
Median real estate property taxes paid for housing units with mortgages in 2022: $2,491 (0.7%) Median real estate property taxes paid for housing units with no mortgage in 2022: $1,783 (1.1%)
Business Search- 14 Million verified businesses
Males: 767
(49.4%)
Females: 785
(50.6%)
For population 25 years and over in 41080:
High school or higher: 98.0%
Bachelor's degree or higher: 44.0%
Graduate or professional degree: 8.5%
Unemployed: 0.6%
Mean travel time to work (commute): 26.6 minutes
For population 15 years and over in 41080:
Never married: 38.1%
Now married: 54.0%
Separated: 0.0%
Widowed: 2.2%
Divorced: 5.7%
Zip code 41080 compared to state average:
Median household income above state average.
Unemployed percentage significantly below state average.
Black race population percentage significantly below state average.
Hispanic race population percentage significantly below state average.
Foreign-born population percentage significantly below state average.
Renting percentage significantly below state average.
Percentage of population with a bachelor's degree or higher above state average.
Estimated median house/condo value in 2022: $235,005
41080:
$235,005
Kentucky:
$196,300
According to our research of Kentucky and other state lists, there were 5 registered sex offenders living in 41080 zip code as of May 28, 2024. The ratio of all residents to sex offenders in zip code 41080 is 438 to 1. The ratio of registered sex offenders to all residents in this zip code is near the state average.
Median resident age:
This zip code:
42.0 years
Kentucky median age:
39.4 years
Average household size:
This zip code:
2.5 people
Kentucky:
2.4 people
Averages for the 2020 tax year for zip code 41080, filed in 2021:
Average Adjusted Gross Income (AGI) in 2020: $77,147 (Individual Income Tax Returns)
Here:
$77,147
State:
$61,342
Salary/wage: $62,067 (reported on 85.9% of returns)
Here:
$62,067
State:
$50,827
(% of AGI for various income ranges: 1217.6% for AGIs below $25k, 3933.1% for AGIs $25k-50k, 6881.0% for AGIs $50k-75k, 9178.6% for AGIs $75k-100k, 17705.0% for AGIs $100k-200k, 53280.0% for AGIs over 200k)
Taxable interest for individuals: $1,046 (reported on 28.2% of returns)
This zip code:
$1,046
Kentucky:
$1,441
(% of AGI for various income ranges: 8.8% for AGIs below $25k, 5.4% for AGIs $25k-50k, 36.0% for AGIs $50k-75k, 12.9% for AGIs $75k-100k, 102.5% for AGIs $100k-200k, 510.0% for AGIs over 200k)
Ordinary dividends: $5,012 (reported on 20.0% of returns)
Here:
$5,012
State:
$7,388
(% of AGI for various income ranges: 27.1% for AGIs below $25k, 173.0% for AGIs $50k-75k, 28.6% for AGIs $75k-100k, 323.8% for AGIs $100k-200k, 1770.0% for AGIs over 200k)
Net capital gain/loss in AGI: +$14,862 (reported on 18.8% of returns)
Here:
+$14,862
State:
+$19,475
(% of AGI for various income ranges: 20.0% for AGIs below $25k, 23.1% for AGIs $25k-50k, 121.0% for AGIs $50k-75k, 220.0% for AGIs $75k-100k, 555.0% for AGIs $100k-200k, 7975.0% for AGIs over 200k)
Profit/loss from business: +$8,845 (reported on 12.9% of returns)
Here:
+$8,845
State:
+$11,386
(% of AGI for various income ranges: 154.1% for AGIs below $25k, 287.0% for AGIs $50k-75k, 530.0% for AGIs $100k-200k)
Taxable individual retirement arrangement distribution: $17,178 (reported on 10.6% of returns)
41080:
$17,178
Kentucky:
$18,941
(% of AGI for various income ranges: 167.1% for AGIs below $25k, 600.0% for AGIs $50k-75k, 827.5% for AGIs $100k-200k)
Total itemized deductions: $29,914 (reported on 8.2% of returns)
Here:
$29,914
State:
$32,473
(% of AGI for various income ranges: 1474.3% for AGIs $75k-100k, 5310.0% for AGIs over 200k)
Charity contributions: $10,460 (reported on 5.9% of returns)
Here:
$10,460
State:
$13,472
(% of AGI for various income ranges: 152.0% for AGIs $50k-75k, 1855.0% for AGIs over 200k)
Taxes paid: $8,517 (reported on 7.1% of returns)
41080:
$8,517
State:
$7,830
(% of AGI for various income ranges: 415.7% for AGIs $75k-100k, 1100.0% for AGIs over 200k)
Earned income credit: $2,038 (reported on 9.4% of returns)
Here:
$2,038
State:
$2,336
(% of AGI for various income ranges: 64.1% for AGIs below $25k, 41.5% for AGIs $25k-50k)
Percentage of individuals using paid preparers for their 2020 taxes: 91.8%
Here:
92%
State:
94%
(% for various income ranges: 95.7% for AGIs below $25k, 94.1% for AGIs $25k-50k, 86.7% for AGIs $50k-75k, 90.0% for AGIs $75k-100k, 86.7% for AGIs $100k-200k, 100.0% for AGIs over 200k)
Averages for the 2012 tax year for zip code 41080, filed in 2013:
Average Adjusted Gross Income (AGI) in 2012: $54,995 (Individual Income Tax Returns)
Here:
$54,995
State:
$50,814
Salary/wage: $48,772 (reported on 87.7% of returns)
Here:
$48,772
State:
$42,723
(% of AGI for various income ranges: 75.6% for AGIs below $25k, 78.5% for AGIs $25k-50k, 84.3% for AGIs $50k-75k, 81.7% for AGIs $75k-100k, 73.3% for AGIs $100k-200k)
Taxable interest for individuals: $665 (reported on 32.1% of returns)
This zip code:
$665
Kentucky:
$1,381
(% of AGI for various income ranges: 0.5% for AGIs below $25k, 0.6% for AGIs $25k-50k, 0.3% for AGIs $50k-75k, 0.3% for AGIs $75k-100k, 0.4% for AGIs $100k-200k)
Ordinary dividends: $1,720 (reported on 18.5% of returns)
Here:
$1,720
State:
$6,239
(% of AGI for various income ranges: 1.8% for AGIs below $25k, 0.5% for AGIs $50k-75k, 0.2% for AGIs $75k-100k, 0.8% for AGIs $100k-200k)
Net capital gain/loss in AGI: +$3,309 (reported on 13.6% of returns)
Here:
+$3,309
State:
+$11,336
(% of AGI for various income ranges: 0.3% for AGIs $25k-50k, 0.8% for AGIs $75k-100k, 1.6% for AGIs $100k-200k)
Profit/loss from business: +$8,127 (reported on 13.6% of returns)
Here:
+$8,127
State:
+$10,862
(% of AGI for various income ranges: 7.3% for AGIs below $25k, 2.8% for AGIs $25k-50k, 4.8% for AGIs $50k-75k, 0.8% for AGIs $100k-200k)
Taxable individual retirement arrangement distribution: $10,743 (reported on 8.6% of returns)
41080:
$10,743
Kentucky:
$14,296
Total itemized deductions: $20,177 (21% of AGI, reported on 37.0% of returns)
Here:
$20,177
State:
$21,160
Here:
21.1% of AGI
State:
20.0% of AGI
(% of AGI for various income ranges: 16.5% for AGIs $25k-50k, 9.8% for AGIs $50k-75k, 14.9% for AGIs $75k-100k, 16.0% for AGIs $100k-200k)
Charity contributions: $3,691 (reported on 27.2% of returns)
Here:
$3,691
State:
$4,303
(% of AGI for various income ranges: 1.1% for AGIs $25k-50k, 1.6% for AGIs $50k-75k, 1.8% for AGIs $75k-100k, 2.5% for AGIs $100k-200k)
Taxes paid: $8,076 (reported on 35.8% of returns)
41080:
$8,076
State:
$8,496
(% of AGI for various income ranges: 4.3% for AGIs $25k-50k, 3.5% for AGIs $50k-75k, 6.0% for AGIs $75k-100k, 6.8% for AGIs $100k-200k)
Earned income credit: $2,240 (reported on 12.3% of returns)
Here:
$2,240
State:
$2,273
(% of AGI for various income ranges: 5.1% for AGIs below $25k, 0.7% for AGIs $25k-50k)
Percentage of individuals using paid preparers for their 2012 taxes: 54.3%
Here:
54%
State:
60%
(% for various income ranges: 50.0% for AGIs below $25k, 50.0% for AGIs $25k-50k, 63.6% for AGIs $50k-75k, 50.0% for AGIs $75k-100k, 66.7% for AGIs $100k-200k)
Averages for the 2004 tax year for zip code 41080, filed in 2005:
Average Adjusted Gross Income (AGI) in 2004: $47,561 (Individual Income Tax Returns)
Here:
$47,561
State:
$41,540
Salary/wage: $42,945 (reported on 87.1% of returns)
Here:
$42,945
State:
$36,432
(% of AGI for various income ranges: 98.6% for AGIs below $10k, 77.9% for AGIs $10k-25k, 86.4% for AGIs $25k-50k, 87.1% for AGIs $50k-75k, 87.4% for AGIs $75k-100k, 63.2% for AGIs over 100k)
Taxable interest for individuals: $850 (reported on 40.0% of returns)
This zip code:
$850
Kentucky:
$1,571
(% of AGI for various income ranges: 4.9% for AGIs below $10k, 2.4% for AGIs $10k-25k, 0.9% for AGIs $25k-50k, 0.2% for AGIs $50k-75k, 0.4% for AGIs $75k-100k, 0.6% for AGIs over 100k)
Taxable dividends: $1,281 (reported on 20.9% of returns)
Here:
$1,281
State:
$3,453
(% of AGI for various income ranges: 2.4% for AGIs below $10k, 0.9% for AGIs $10k-25k, 0.3% for AGIs $25k-50k, 0.2% for AGIs $50k-75k, 0.4% for AGIs $75k-100k, 0.9% for AGIs over 100k)
Net capital gain/loss: +$10,207 (reported on 14.2% of returns)
Here:
+$10,207
State:
+$9,663
(% of AGI for various income ranges: -2.5% for AGIs below $10k, -0.5% for AGIs $10k-25k, 0.4% for AGIs $25k-50k, 0.1% for AGIs $50k-75k, 0.1% for AGIs $75k-100k, 9.2% for AGIs over 100k)
Profit/loss from business: +$7,000 (reported on 15.8% of returns)
Here:
+$7,000
State:
+$9,233
(% of AGI for various income ranges: 10.3% for AGIs below $10k, 5.3% for AGIs $10k-25k, 4.6% for AGIs $25k-50k, 3.7% for AGIs $50k-75k, -0.6% for AGIs $75k-100k, 0.3% for AGIs over 100k)
IRA payment deduction: $1,545 (reported on 1.3% of returns)
41080:
$1,545
Kentucky:
$2,955
Total itemized deductions: $16,444 (20% of AGI, reported on 41.4% of returns)
Here:
$16,444
State:
$17,474
Here:
20.4% of AGI
State:
21.0% of AGI
(% of AGI for various income ranges: 25.6% for AGIs below $10k, 7.0% for AGIs $10k-25k, 12.7% for AGIs $25k-50k, 15.6% for AGIs $50k-75k, 18.8% for AGIs $75k-100k, 13.3% for AGIs over 100k)
Charity contributions deductions: $2,431 (3% of AGI, reported on 35.5% of returns)
Here:
$2,431
State:
$3,494
Here:
2.9% of AGI
State:
4.0% of AGI
(% of AGI for various income ranges: 6.6% for AGIs below $10k, 1.3% for AGIs $25k-50k, 1.6% for AGIs $50k-75k, 2.1% for AGIs $75k-100k, 2.3% for AGIs over 100k)
Total tax: $6,567 (reported on 77.7% of returns)
41080:
$6,567
State:
$6,162
(% of AGI for various income ranges: 5.3% for AGIs below $10k, 4.8% for AGIs $10k-25k, 6.5% for AGIs $25k-50k, 8.6% for AGIs $50k-75k, 9.8% for AGIs $75k-100k, 16.7% for AGIs over 100k)
Earned income credit: $1,616 (reported on 13.7% of returns)
Here:
$1,616
State:
$1,723
Percentage of individuals using paid preparers for their 2004 taxes: 62.4%
Here:
62%
State:
66%
(% for various income ranges: 53.8% for AGIs below $10k, 63.3% for AGIs $10k-25k, 69.9% for AGIs $25k-50k, 60.0% for AGIs $50k-75k, 68.7% for AGIs $75k-100k, 58.3% for AGIs over 100k)
Household received Food Stamps/SNAP in the past 12 months: 0 Household did not receive Food Stamps/SNAP in the past 12 months: 628
Women who did not have a birth in the past 12 months: 439 (177 now married, 262 unmarried)
Housing units in zip code 41080 with a mortgage: 386 (39 second mortgage, 39 both second mortgage and home equity loan) Median monthly owner costs for units with a mortgage: $1,526 Median monthly owner costs for units without a mortgage: $482
Median number of rooms in houses and condos:
Here:
6.7
State:
6.4
Notable locations in this zip code not listed on our city pages
Streams, rivers, and creeks: Woolper Creek (A), Ashbys Fork (B), Taylor Creek (C), Steep Creek (D), Second Creek (E), Peaks Branch (F). Display/hide their locations on the map
Size of family households: 172 2-persons, 117 3-persons, 86 4-persons, 63 5-persons, 7 6-persons
Size of nonfamily households: 184 1-person
235 married couples with children.
80 single-parent households (80 men).
99.5% of residents of 41080 zip code speak English at home.
Foreign born population: 0 (0.0%)
:
0.0%
Whole state:
4.0%
33%German
31%English
22%American
4%Scottish
1%Czechoslovakian
1%European
Facilities with environmental interests located in this zip code:
NORTHERN KY AGGREGATES (3743 BELLVIEW ROAD in PETERSBURG, KY)
AIR MINOR (AIRS/AFS) CRITERIA AND HAZARDOUS AIR POLLUTANT INVENTORY (Inventory of air pollution sources) National Pollutant Discharge Elimination System NON-MAJOR (Tracking pollutant discharge elimination systems) - permit Business SIC classification: CRUSHED AND BROKEN LIMESTONE; CONSTRUCTION SAND AND GRAVEL Business NAICS classification: CONSTRUCTION SAND AND GRAVEL MINING. Alternative names: NORTH KY AGGREGATES, NORTHERN KY AGGREGATES IN
National Pollutant Discharge Elimination System NON-MAJOR (Tracking pollutant discharge elimination systems) - permit National Pollutant Discharge Elimination System NON-MAJOR (Tracking pollutant discharge elimination systems) - permit Business SIC classification: CRUSHED AND BROKEN LIMESTONE; CONSTRUCTION SAND AND GRAVEL
MARTIN MARIETTA AGGREGATES (3503 BELLVIEW ROAD in PETERSBURG, KY)
AIR MINOR (AIRS/AFS) CRITERIA AND HAZARDOUS AIR POLLUTANT INVENTORY (Inventory of air pollution sources) National Pollutant Discharge Elimination System NON-MAJOR (Tracking pollutant discharge elimination systems) - permit Business SIC and NAICS classification: CONSTRUCTION SAND AND GRAVEL
MONROE RESIDENCE (2973 ANSON LN in PETERSBURG, KY)
National Pollutant Discharge Elimination System NON-MAJOR (Tracking pollutant discharge elimination systems) - permit Business SIC classification: OPERATORS OF DWELLINGS OTHER THAN APARTMENT BUILDINGS Alternative names: ZEINNER BUILDER / MONROE RES
MORGAN RESIDENCE (2937 SECOND CREEK RD in PETERSBURG, KY)
National Pollutant Discharge Elimination System NON-MAJOR (Tracking pollutant discharge elimination systems) - permit Business SIC classification: OPERATORS OF DWELLINGS OTHER THAN APARTMENT BUILDINGS
PREMIUM PROCESSING INC (HIGHWAY 535 in FONDEE, KY)
AIR MINOR (AIRS/AFS)
Housing units lacking complete plumbing facilities: 6.2% Housing units lacking complete kitchen facilities: 1.5%
40.4%Bottled, tank, or LP gas
25.5%Electricity
21.2%Fuel oil, kerosene, etc.
10.2%Wood
1.8%Utility gas
1.2%No fuel used
Population in 1990: 1,219. Population change in the 1990s: +456 (+37.4%).
Place of birth for U.S.-born residents:
This state: 1,116
Northeast: 33
Midwest: 293
South: 62
West: 45
75% of the 41080 zip code residents lived in the same house 5 years ago. Out of people who lived in different houses, 60% lived in this county. Out of people who lived in different counties, 50% lived in Kentucky.
95% of the 41080 zip code residents lived in the same house 1 year ago. Out of people who lived in different houses, 42% moved from this county. Out of people who lived in different houses, 38% moved from different county within same state. Out of people who lived in different houses, 18% moved from different state.
Private vs. public school enrollment:
Students in private schools in grades 1 to 8 (elementary and middle school):
Here:
0.0%
Kentucky:
17.2%
Students in private schools in grades 9 to 12 (high school):
Here:
0.0%
Kentucky:
15.2%
Students in private undergraduate colleges: 13
Here:
40.8%
Kentucky:
19.6%
Occupation by median earnings in the past 12 months ($)
81,448Management occupations
63,963Production occupations
59,196Business and financial operations occupations
58,237Construction and extraction occupations
47,561Education, training, and library occupations
41,928Installation, maintenance, and repair occupations
Top industries in this zip code by the number of employees in 2005:
Mining: Construction Sand and Gravel Mining (10-19 employees: 2 establishments, 1-4 employees: 1 establishment)
Construction: Poured Concrete Foundation and Structure Contractors (5-9: 2, 1-4: 1)
Construction: Site Preparation Contractors (5-9: 1)
Construction: New Single-Family Housing Construction (except Operative Builders) (5-9: 1)
Other Services (except Public Administration): Religious Organizations (1-4: 2)
Other Services (except Public Administration): Automotive Body, Paint, and Interior Repair and Maintenance (1-4: 2)
Other Services (except Public Administration): Other Social Advocacy Organizations (1-4: 1)
Construction: Plumbing, Heating, and Air-Conditioning Contractors (1-4: 1)
Fatal accident statistics in 2014:
Fatal accident count: 1
Vehicles involved in fatal accidents: 2
Fatal accidents caused by drunken drivers: 0
Fatalities: 1
Persons involved in fatal accidents: 2
Pedestrians involved in fatal accidents: 0
Fatal accident statistics in 2011:
Fatal accident count: 1
Vehicles involved in fatal accidents: 1
Fatal accidents caused by drunken drivers: 1
Fatalities: 1
Persons involved in fatal accidents: 1
Pedestrians involved in fatal accidents: 0
Home Mortgage Disclosure Act Aggregated Statistics For Year 2009 (Based on 4 partial tracts)
A) FHA, FSA/RHS & VA Home Purchase Loans
B) Conventional Home Purchase Loans
C) Refinancings
D) Home Improvement Loans
F) Non-occupant Loans on < 5 Family Dwellings (A B C & D)
G) Loans On Manufactured Home Dwelling (A B C & D)
Number
Average Value
Number
Average Value
Number
Average Value
Number
Average Value
Number
Average Value
Number
Average Value
LOANS ORIGINATED
53
$143,538
32
$135,528
254
$161,330
5
$28,332
14
$110,631
0
$0
APPLICATIONS APPROVED, NOT ACCEPTED
2
$128,755
3
$153,613
17
$148,319
1
$44,900
1
$63,100
0
$0
APPLICATIONS DENIED
7
$135,706
2
$121,425
93
$170,976
9
$42,121
2
$140,545
2
$46,910
APPLICATIONS WITHDRAWN
2
$218,730
4
$194,082
38
$166,157
3
$67,140
0
$0
0
$0
FILES CLOSED FOR INCOMPLETENESS
1
$177,200
1
$186,120
11
$156,214
0
$0
0
$0
0
$0
Aggregated Statistics For Year 2008 (Based on 4 partial tracts)
A) FHA, FSA/RHS & VA Home Purchase Loans
B) Conventional Home Purchase Loans
C) Refinancings
D) Home Improvement Loans
F) Non-occupant Loans on < 5 Family Dwellings (A B C & D)
G) Loans On Manufactured Home Dwelling (A B C & D)
Number
Average Value
Number
Average Value
Number
Average Value
Number
Average Value
Number
Average Value
Number
Average Value
LOANS ORIGINATED
43
$148,676
56
$146,491
131
$156,976
10
$22,807
15
$93,517
6
$75,333
APPLICATIONS APPROVED, NOT ACCEPTED
0
$0
4
$196,645
15
$150,245
0
$0
1
$40,790
1
$37,610
APPLICATIONS DENIED
10
$117,176
16
$94,423
89
$157,638
11
$32,830
9
$112,144
5
$95,222
APPLICATIONS WITHDRAWN
7
$123,486
4
$132,708
24
$163,037
1
$7,650
2
$99,700
0
$0
FILES CLOSED FOR INCOMPLETENESS
0
$0
1
$80,310
7
$192,189
1
$191,220
0
$0
0
$0
Aggregated Statistics For Year 2007 (Based on 4 partial tracts)
A) FHA, FSA/RHS & VA Home Purchase Loans
B) Conventional Home Purchase Loans
C) Refinancings
D) Home Improvement Loans
F) Non-occupant Loans on < 5 Family Dwellings (A B C & D)
G) Loans On Manufactured Home Dwelling (A B C & D)
Number
Average Value
Number
Average Value
Number
Average Value
Number
Average Value
Number
Average Value
Number
Average Value
LOANS ORIGINATED
19
$140,078
137
$141,690
150
$149,182
22
$43,279
31
$124,408
2
$48,525
APPLICATIONS APPROVED, NOT ACCEPTED
2
$127,450
18
$114,727
30
$141,766
4
$40,352
2
$126,085
2
$62,390
APPLICATIONS DENIED
4
$118,970
15
$127,117
131
$134,863
24
$48,367
5
$113,330
2
$56,075
APPLICATIONS WITHDRAWN
2
$115,275
16
$117,317
49
$145,572
4
$78,132
3
$84,090
0
$0
FILES CLOSED FOR INCOMPLETENESS
1
$170,820
3
$140,227
9
$152,808
1
$19,120
1
$9,560
0
$0
Aggregated Statistics For Year 2006 (Based on 4 partial tracts)
A) FHA, FSA/RHS & VA Home Purchase Loans
B) Conventional Home Purchase Loans
C) Refinancings
D) Home Improvement Loans
F) Non-occupant Loans on < 5 Family Dwellings (A B C & D)
G) Loans On Manufactured Home Dwelling (A B C & D)
Number
Average Value
Number
Average Value
Number
Average Value
Number
Average Value
Number
Average Value
Number
Average Value
LOANS ORIGINATED
26
$154,957
178
$127,756
160
$123,365
25
$43,861
36
$115,462
3
$78,677
APPLICATIONS APPROVED, NOT ACCEPTED
2
$142,460
17
$104,524
34
$131,079
3
$83,827
3
$122,363
2
$65,955
APPLICATIONS DENIED
3
$140,867
30
$117,206
116
$127,649
24
$53,373
5
$119,308
2
$70,585
APPLICATIONS WITHDRAWN
2
$135,130
15
$136,843
59
$127,553
0
$0
1
$63,100
1
$13,390
FILES CLOSED FOR INCOMPLETENESS
1
$100,070
2
$90,300
15
$144,804
0
$0
0
$0
0
$0
Aggregated Statistics For Year 2005 (Based on 4 partial tracts)
A) FHA, FSA/RHS & VA Home Purchase Loans
B) Conventional Home Purchase Loans
C) Refinancings
D) Home Improvement Loans
F) Non-occupant Loans on < 5 Family Dwellings (A B C & D)
G) Loans On Manufactured Home Dwelling (A B C & D)
Number
Average Value
Number
Average Value
Number
Average Value
Number
Average Value
Number
Average Value
Number
Average Value
LOANS ORIGINATED
29
$141,177
195
$117,561
196
$140,431
27
$40,170
31
$119,743
9
$94,718
APPLICATIONS APPROVED, NOT ACCEPTED
2
$164,835
18
$99,710
36
$123,410
4
$40,400
1
$50,350
1
$120,690
APPLICATIONS DENIED
4
$129,590
30
$90,036
134
$126,846
24
$40,368
4
$95,432
8
$72,110
APPLICATIONS WITHDRAWN
2
$106,350
17
$109,692
55
$133,023
6
$221,945
5
$112,990
2
$107,275
FILES CLOSED FOR INCOMPLETENESS
1
$89,240
5
$159,784
15
$140,799
1
$108,360
0
$0
0
$0
Aggregated Statistics For Year 2004 (Based on 4 partial tracts)
A) FHA, FSA/RHS & VA Home Purchase Loans
B) Conventional Home Purchase Loans
C) Refinancings
D) Home Improvement Loans
F) Non-occupant Loans on < 5 Family Dwellings (A B C & D)
G) Loans On Manufactured Home Dwelling (A B C & D)
Number
Average Value
Number
Average Value
Number
Average Value
Number
Average Value
Number
Average Value
Number
Average Value
LOANS ORIGINATED
26
$143,787
148
$123,796
243
$126,281
24
$24,135
28
$113,527
3
$81,643
APPLICATIONS APPROVED, NOT ACCEPTED
3
$120,470
19
$125,148
45
$127,061
3
$67,633
1
$69,480
2
$65,030
APPLICATIONS DENIED
6
$114,298
23
$93,705
111
$121,247
23
$32,948
3
$78,827
5
$46,042
APPLICATIONS WITHDRAWN
5
$161,152
22
$129,128
76
$132,893
4
$47,475
3
$181,607
2
$113,860
FILES CLOSED FOR INCOMPLETENESS
1
$157,440
2
$70,270
19
$133,585
2
$33,830
0
$0
0
$0
Aggregated Statistics For Year 2003 (Based on 4 partial tracts)
A) FHA, FSA/RHS & VA Home Purchase Loans
B) Conventional Home Purchase Loans
C) Refinancings
D) Home Improvement Loans
F) Non-occupant Loans on < 5 Family Dwellings (A B C & D)
Number
Average Value
Number
Average Value
Number
Average Value
Number
Average Value
Number
Average Value
LOANS ORIGINATED
40
$131,634
130
$122,548
523
$126,398
16
$41,329
34
$93,731
APPLICATIONS APPROVED, NOT ACCEPTED
1
$168,910
11
$131,075
68
$117,197
4
$44,102
4
$100,072
APPLICATIONS DENIED
3
$112,183
16
$102,077
128
$119,726
15
$25,412
5
$134,022
APPLICATIONS WITHDRAWN
4
$107,548
9
$124,191
64
$128,240
1
$127,480
2
$114,910
FILES CLOSED FOR INCOMPLETENESS
2
$105,810
1
$9,560
19
$137,745
0
$0
1
$59,920
Aggregated Statistics For Year 2002 (Based on 2 partial tracts)
A) FHA, FSA/RHS & VA Home Purchase Loans
B) Conventional Home Purchase Loans
C) Refinancings
D) Home Improvement Loans
F) Non-occupant Loans on < 5 Family Dwellings (A B C & D)
Number
Average Value
Number
Average Value
Number
Average Value
Number
Average Value
Number
Average Value
LOANS ORIGINATED
7
$95,960
19
$133,881
103
$122,487
7
$22,729
5
$138,794
APPLICATIONS APPROVED, NOT ACCEPTED
1
$182,800
5
$134,054
12
$95,954
1
$52,710
0
$0
APPLICATIONS DENIED
1
$160,070
8
$103,671
22
$143,695
5
$20,214
0
$0
APPLICATIONS WITHDRAWN
0
$0
3
$106,713
16
$129,998
0
$0
0
$0
FILES CLOSED FOR INCOMPLETENESS
1
$156,690
0
$0
7
$146,047
1
$48,360
0
$0
Aggregated Statistics For Year 2001 (Based on 2 partial tracts)
A) FHA, FSA/RHS & VA Home Purchase Loans
B) Conventional Home Purchase Loans
C) Refinancings
D) Home Improvement Loans
F) Non-occupant Loans on < 5 Family Dwellings (A B C & D)
Number
Average Value
Number
Average Value
Number
Average Value
Number
Average Value
Number
Average Value
LOANS ORIGINATED
2
$119,935
24
$112,679
68
$122,955
10
$18,812
3
$78,020
APPLICATIONS APPROVED, NOT ACCEPTED
0
$0
4
$61,660
12
$116,104
0
$0
0
$0
APPLICATIONS DENIED
0
$0
10
$48,989
29
$97,654
7
$17,893
1
$28,530
APPLICATIONS WITHDRAWN
0
$0
2
$72,055
15
$99,654
0
$0
0
$0
FILES CLOSED FOR INCOMPLETENESS
1
$94,790
1
$76,410
4
$150,762
0
$0
0
$0
Aggregated Statistics For Year 2000 (Based on 2 partial tracts)
A) FHA, FSA/RHS & VA Home Purchase Loans
B) Conventional Home Purchase Loans
C) Refinancings
D) Home Improvement Loans
F) Non-occupant Loans on < 5 Family Dwellings (A B C & D)
Number
Average Value
Number
Average Value
Number
Average Value
Number
Average Value
Number
Average Value
LOANS ORIGINATED
4
$113,405
19
$129,605
33
$102,318
13
$28,048
3
$101,073
APPLICATIONS APPROVED, NOT ACCEPTED
0
$0
5
$68,188
14
$87,531
3
$15,797
0
$0
APPLICATIONS DENIED
0
$0
8
$55,191
20
$102,475
7
$16,719
0
$0
APPLICATIONS WITHDRAWN
0
$0
3
$90,273
9
$72,648
1
$39,660
0
$0
FILES CLOSED FOR INCOMPLETENESS
0
$0
0
$0
4
$98,050
0
$0
0
$0
Aggregated Statistics For Year 1999 (Based on 2 partial tracts)
A) FHA, FSA/RHS & VA Home Purchase Loans
B) Conventional Home Purchase Loans
C) Refinancings
D) Home Improvement Loans
F) Non-occupant Loans on < 5 Family Dwellings (A B C & D)

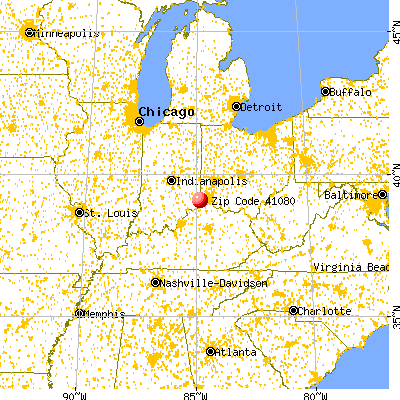


 Nearest zip codes: 41005, 45052, 47025, 41048, 45033, 45001.


