Estimated zip code population in 2022: 2,746 Zip code population in 2010: 2,869 Zip code population in 2000: 2,331
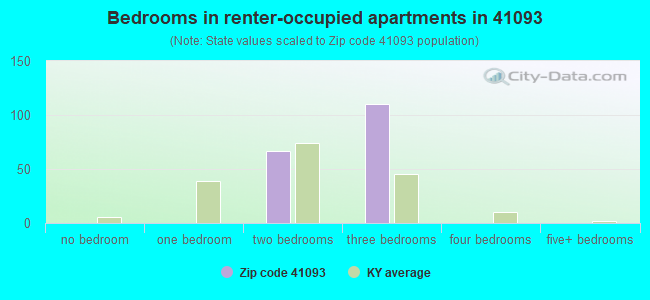
Houses and condos: 1,317 Renter-occupied apartments: 184
% of renters here:
18%
State:
31%
March 2022 cost of living index in zip code 41093: 81.6 (low, U.S. average is 100)
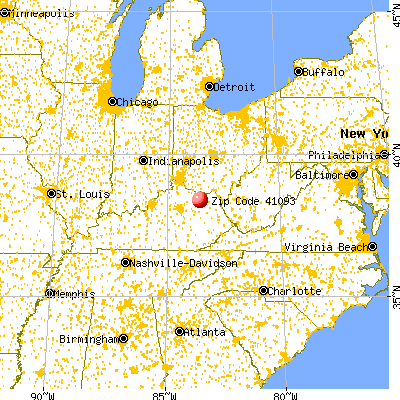
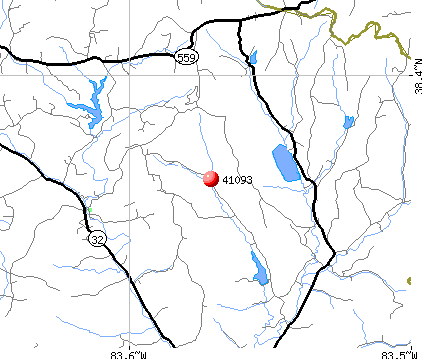
Land area: 108.5 sq. mi. Water area: 0.5 sq. mi.
Population density: 25 people per square mile
(very low).
OSM Map
General Map
Google Map
MSN Map
OSM Map
General Map
Google Map
MSN Map
OSM Map
General Map
Google Map
MSN Map
OSM Map
General Map
Google Map
MSN Map
Please wait while loading the map...
Real estate property taxes paid for housing units in 2022:
This zip code:
0.7% ($739)
Kentucky:
0.7% ($1,456)
Median real estate property taxes paid for housing units with mortgages in 2022: $825 (0.7%) Median real estate property taxes paid for housing units with no mortgage in 2022: $428 (0.6%)
Business Search- 14 Million verified businesses
Males: 1,278
(46.5%)
Females: 1,468
(53.5%)
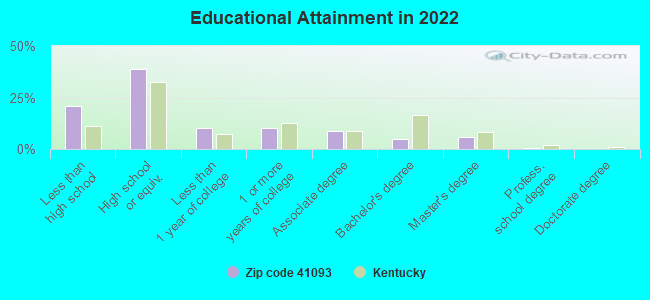
For population 25 years and over in 41093:
High school or higher: 77.4%
Bachelor's degree or higher: 10.7%
Graduate or professional degree: 5.9%
Unemployed: 6.2%
Mean travel time to work (commute): 32.4 minutes
For population 15 years and over in 41093:
Never married: 19.6%
Now married: 62.2%
Separated: 3.5%
Widowed: 4.7%
Divorced: 10.1%
Zip code 41093 compared to state average:
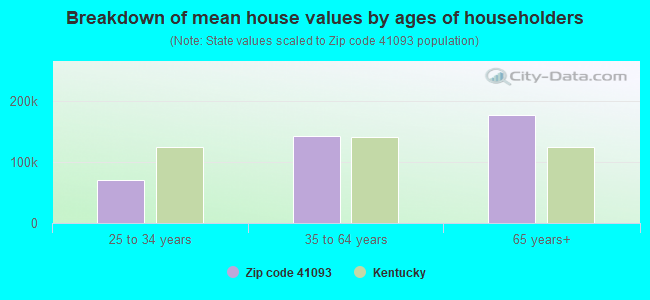
Median house value below state average.
Black race population percentage significantly below state average.
Hispanic race population percentage significantly below state average.
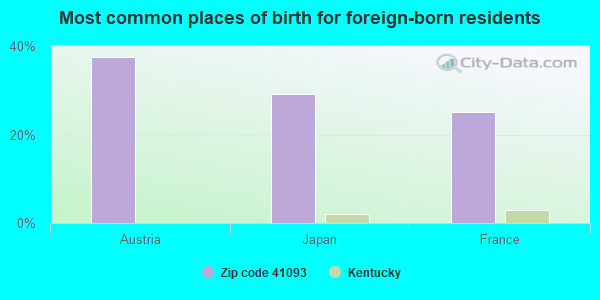
Foreign-born population percentage significantly below state average.
Renting percentage below state average.
Number of college students significantly below state average.
Percentage of population with a bachelor's degree or higher significantly below state average.
Averages for the 2020 tax year for zip code 41093, filed in 2021:
Average Adjusted Gross Income (AGI) in 2020: $44,921 (Individual Income Tax Returns)
Here:
$44,921
State:
$61,342
Salary/wage: $39,507 (reported on 78.1% of returns)
Here:
$39,507
State:
$50,827
(% of AGI for various income ranges: 989.3% for AGIs below $25k, 3884.0% for AGIs $25k-50k, 6614.2% for AGIs $50k-75k, 8727.1% for AGIs $75k-100k, 15426.0% for AGIs $100k-200k)
Taxable interest for individuals: $1,277 (reported on 21.0% of returns)
This zip code:
$1,277
Kentucky:
$1,441
(% of AGI for various income ranges: 15.5% for AGIs below $25k, 12.0% for AGIs $25k-50k, 143.3% for AGIs $50k-75k, 14.3% for AGIs $75k-100k, 60.0% for AGIs $100k-200k)
Ordinary dividends: $1,062 (reported on 7.6% of returns)
Here:
$1,062
State:
$7,388
(% of AGI for various income ranges: 29.5% for AGIs $25k-50k, 37.1% for AGIs $75k-100k)
Net capital gain/loss in AGI: +$4,456 (reported on 8.6% of returns)
Here:
+$4,456
State:
+$19,475
(% of AGI for various income ranges: 25.2% for AGIs below $25k, 27.5% for AGIs $25k-50k, 66.7% for AGIs $50k-75k, 275.7% for AGIs $75k-100k)
Profit/loss from business: +$12,424 (reported on 23.8% of returns)
Here:
+$12,424
State:
+$11,386
(% of AGI for various income ranges: 226.6% for AGIs below $25k, 634.5% for AGIs $25k-50k, 699.2% for AGIs $50k-75k, 682.0% for AGIs $100k-200k)
Taxable individual retirement arrangement distribution: $11,700 (reported on 6.7% of returns)
41093:
$11,700
Kentucky:
$18,941
(% of AGI for various income ranges: 109.0% for AGIs below $25k, 419.2% for AGIs $50k-75k)
Earned income credit: $2,368 (reported on 23.8% of returns)
Here:
$2,368
State:
$2,336
(% of AGI for various income ranges: 137.2% for AGIs below $25k, 97.0% for AGIs $25k-50k)
Percentage of individuals using paid preparers for their 2020 taxes: 94.3%
Here:
94%
State:
94%
(% for various income ranges: 95.1% for AGIs below $25k, 92.9% for AGIs $25k-50k, 94.4% for AGIs $50k-75k, 100.0% for AGIs $75k-100k, 88.9% for AGIs $100k-200k)
Averages for the 2012 tax year for zip code 41093, filed in 2013:
Average Adjusted Gross Income (AGI) in 2012: $33,639 (Individual Income Tax Returns)
Here:
$33,639
State:
$50,814
Salary/wage: $31,797 (reported on 80.0% of returns)
Here:
$31,797
State:
$42,723
(% of AGI for various income ranges: 70.8% for AGIs below $25k, 81.3% for AGIs $25k-50k, 79.0% for AGIs $50k-75k, 80.5% for AGIs $75k-100k, 60.7% for AGIs $100k-200k)
Taxable interest for individuals: $931 (reported on 27.4% of returns)
This zip code:
$931
Kentucky:
$1,381
(% of AGI for various income ranges: 1.7% for AGIs below $25k, 0.6% for AGIs $25k-50k, 0.5% for AGIs $50k-75k, 0.8% for AGIs $75k-100k)
Ordinary dividends: $1,071 (reported on 7.4% of returns)
Here:
$1,071
State:
$6,239
Net capital gain/loss in AGI: +$2,770 (reported on 10.5% of returns)
Here:
+$2,770
State:
+$11,336
(% of AGI for various income ranges: 0.9% for AGIs below $25k, 1.0% for AGIs $25k-50k, 1.7% for AGIs $50k-75k)
Profit/loss from business: +$7,191 (reported on 24.2% of returns)
Here:
+$7,191
State:
+$10,862
(% of AGI for various income ranges: 17.2% for AGIs below $25k, 4.5% for AGIs $25k-50k, 1.9% for AGIs $50k-75k, 0.7% for AGIs $75k-100k)
Taxable individual retirement arrangement distribution: $10,950 (reported on 6.3% of returns)
41093:
$10,950
Kentucky:
$14,296
Total itemized deductions: $18,707 (29% of AGI, reported on 14.7% of returns)
Here:
$18,707
State:
$21,160
Here:
28.8% of AGI
State:
20.0% of AGI
(% of AGI for various income ranges: 5.7% for AGIs below $25k, 5.3% for AGIs $25k-50k, 11.7% for AGIs $50k-75k, 9.5% for AGIs $75k-100k, 10.2% for AGIs $100k-200k)
Charity contributions: $2,180 (reported on 10.5% of returns)
Here:
$2,180
State:
$4,303
(% of AGI for various income ranges: 0.8% for AGIs below $25k, 0.8% for AGIs $50k-75k, 2.2% for AGIs $75k-100k)
Taxes paid: $4,600 (reported on 14.7% of returns)
41093:
$4,600
State:
$8,496
(% of AGI for various income ranges: 0.6% for AGIs below $25k, 1.1% for AGIs $25k-50k, 2.7% for AGIs $50k-75k, 3.0% for AGIs $75k-100k, 3.7% for AGIs $100k-200k)
Earned income credit: $2,272 (reported on 33.7% of returns)
Here:
$2,272
State:
$2,273
(% of AGI for various income ranges: 8.7% for AGIs below $25k, 2.0% for AGIs $25k-50k)
Percentage of individuals using paid preparers for their 2012 taxes: 73.7%
Here:
74%
State:
60%
(% for various income ranges: 71.4% for AGIs below $25k, 76.0% for AGIs $25k-50k, 75.0% for AGIs $50k-75k, 83.3% for AGIs $75k-100k, 66.7% for AGIs $100k-200k)
Averages for the 2004 tax year for zip code 41093, filed in 2005:
Average Adjusted Gross Income (AGI) in 2004: $26,273 (Individual Income Tax Returns)
Here:
$26,273
State:
$41,540
Salary/wage: $26,071 (reported on 83.7% of returns)
Here:
$26,071
State:
$36,432
(% of AGI for various income ranges: 109.2% for AGIs below $10k, 77.9% for AGIs $10k-25k, 84.6% for AGIs $25k-50k, 92.2% for AGIs $50k-75k, 75.3% for AGIs $75k-100k, 57.7% for AGIs over 100k)
Taxable interest for individuals: $1,082 (reported on 33.3% of returns)
This zip code:
$1,082
Kentucky:
$1,571
(% of AGI for various income ranges: 11.7% for AGIs below $10k, 1.3% for AGIs $10k-25k, 1.2% for AGIs $25k-50k, 0.8% for AGIs $50k-75k, 1.0% for AGIs $75k-100k)
Taxable dividends: $451 (reported on 7.4% of returns)
Here:
$451
State:
$3,453
(% of AGI for various income ranges: 0.9% for AGIs below $10k, 0.1% for AGIs $10k-25k, 0.2% for AGIs $25k-50k, 0.1% for AGIs $50k-75k)
Net capital gain/loss: +$3,563 (reported on 9.1% of returns)
Here:
+$3,563
State:
+$9,663
(% of AGI for various income ranges: 2.2% for AGIs below $10k, 2.4% for AGIs $10k-25k, 0.8% for AGIs $25k-50k, 1.4% for AGIs $50k-75k)
Profit/loss from business: +$5,085 (reported on 24.7% of returns)
Here:
+$5,085
State:
+$9,233
(% of AGI for various income ranges: 36.5% for AGIs below $10k, 8.5% for AGIs $10k-25k, 4.0% for AGIs $25k-50k, 1.0% for AGIs $50k-75k)
IRA payment deduction: $2,652 (reported on 2.4% of returns)
41093:
$2,652
Kentucky:
$2,955
Total itemized deductions: $13,791 (28% of AGI, reported on 16.5% of returns)
Here:
$13,791
State:
$17,474
Here:
27.6% of AGI
State:
21.0% of AGI
(% of AGI for various income ranges: 6.1% for AGIs $10k-25k, 8.0% for AGIs $25k-50k, 11.2% for AGIs $50k-75k, 25.5% for AGIs $75k-100k)
Charity contributions deductions: $2,212 (4% of AGI, reported on 10.4% of returns)
Here:
$2,212
State:
$3,494
Here:
4.1% of AGI
State:
4.0% of AGI
(% of AGI for various income ranges: 0.3% for AGIs $10k-25k, 0.8% for AGIs $25k-50k, 1.8% for AGIs $50k-75k, 1.5% for AGIs $75k-100k)
Total tax: $2,594 (reported on 68.3% of returns)
41093:
$2,594
State:
$6,162
(% of AGI for various income ranges: 6.0% for AGIs below $10k, 3.7% for AGIs $10k-25k, 5.6% for AGIs $25k-50k, 7.5% for AGIs $50k-75k, 9.2% for AGIs $75k-100k, 17.4% for AGIs over 100k)
Earned income credit: $1,776 (reported on 30.8% of returns)
Here:
$1,776
State:
$1,723
Percentage of individuals using paid preparers for their 2004 taxes: 78.7%
Here:
79%
State:
66%
(% for various income ranges: 73.1% for AGIs below $10k, 80.6% for AGIs $10k-25k, 81.5% for AGIs $25k-50k, 76.3% for AGIs $50k-75k, 81.0% for AGIs $75k-100k, 92.3% for AGIs over 100k)
Household received Food Stamps/SNAP in the past 12 months: 252 Household did not receive Food Stamps/SNAP in the past 12 months: 791
Women who had a birth in the past 12 months: 91 (9 now married, 85 unmarried) Women who did not have a birth in the past 12 months: 433 (258 now married, 177 unmarried)
Housing units in zip code 41093 with a mortgage: 515 (15 second mortgage, 18 home equity loan) Houses without a mortgage: 20
Median monthly owner costs for units with a mortgage: $799 Median monthly owner costs for units without a mortgage: $313
Residents with income below the poverty level in 2022:
This zip code:
27.0%
Whole state:
16.5%
Residents with income below 50% of the poverty level in 2022:
This zip code:
16.7%
Whole state:
9.0%
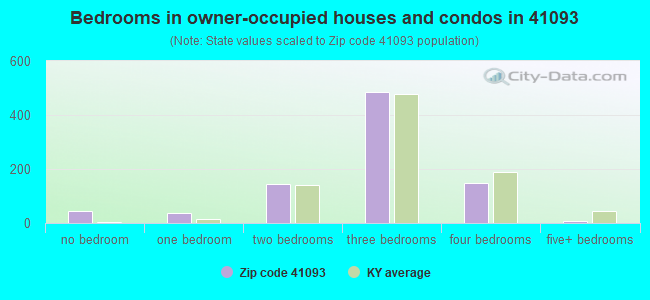
Median number of rooms in houses and condos:
Here:
6.1
State:
6.4
Median number of rooms in apartments:
Here:
5.1
State:
4.4
Notable locations in this zip code not listed on our city pages
Notable locations in zip code 41093: Belle Grove Springs (A), Mountain Lake Manor (B), Muses Mill (C), Carpenter Corners (D), Muses Mill Volunteer Fire Department (E), Mount Carmel Volunteer Fire Department (F). Display/hide their locations on the map
Churches in zip code 41093 include: Crane Creek Church (A), Muses Mills Christian Church (B), Fox Valley Community Church (C), Goddard United Methodist Church (D), Foxport Baptist Church (E), Church of Christ in Union (F), Pea Ridge Church (G), Pleasant Valley Church (H), Shiloh Church (I). Display/hide their locations on the map
Cemeteries: Point Pleasant Cemetery (1), Thorp Cemetery (2), Martin Cemetery (3), Mount Vernon Cemetery (4), Million Cemetery (5), Muses Mills Church Cemetery (6), Esham Cemetery (7). Display/hide their locations on the map
In group quarters: 16 (-1 institutionalized population)
Size of family households: 341 2-persons, 145 3-persons, 190 4-persons, 127 5-persons, 6 6-persons
Size of nonfamily households: 176 1-person, 50 2-persons
485 married couples with children.
166 single-parent households (67 men, 99 women).
98.2% of residents of 41093 zip code speak English at home.
0.4% of residents speak Spanish at home (100% very well).
1.2% of residents speak other Indo-European language at home (100% very well).
0.4% of residents speak Asian or Pacific Island language at home (100% well).
Foreign born population: 22 (0.8%) (0.0% of them are naturalized citizens)
:
0.8%
Whole state:
4.0%
38%Austria
29%Japan
25%France
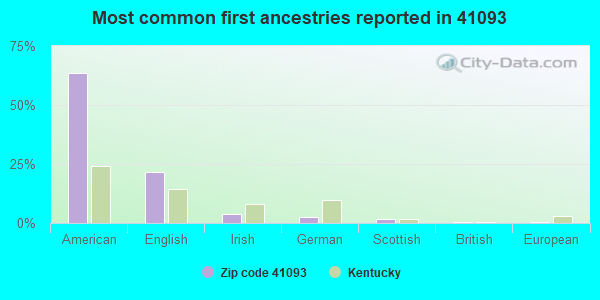
64%American
22%English
4%Irish
3%German
2%Scottish
1%British
0%European
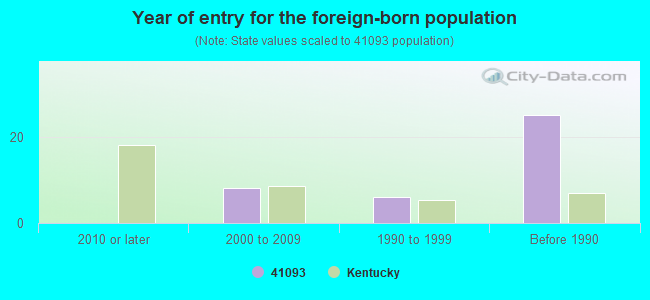
Year of entry for the foreign-born population
02010 or later
82000 to 2009
61990 to 1999
25Before 1990
Facilities with environmental interests located in this zip code:
FOX VALLEY RECREATION AREA (JAMES RD in WALLINGFORD, KY)
National Pollutant Discharge Elimination System NON-MAJOR (Tracking pollutant discharge elimination systems) - permit Business SIC classification: SPORTING AND RECREATIONAL CAMPS
Housing units lacking complete plumbing facilities: 3.8% Housing units lacking complete kitchen facilities: 3.8%
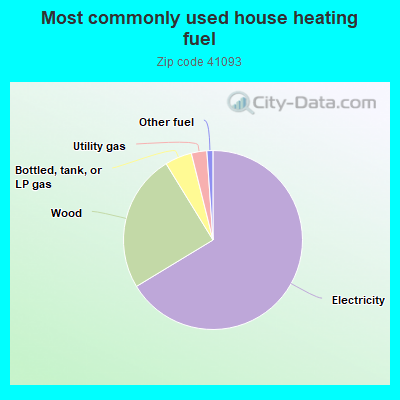
66.6%Electricity
25.0%Wood
4.9%Bottled, tank, or LP gas
2.8%Utility gas
1.1%Other fuel
Population in 1990: 1,366. Population change in the 1990s: +965 (+70.6%).
Place of birth for U.S.-born residents:
This state: 2,070
Northeast: 116
Midwest: 363
South: 126
West: 15
75% of the 41093 zip code residents lived in the same house 5 years ago. Out of people who lived in different houses, 67% lived in this county. Out of people who lived in different counties, 50% lived in Kentucky.
93% of the 41093 zip code residents lived in the same house 1 year ago. Out of people who lived in different houses, 67% moved from this county. Out of people who lived in different houses, 29% moved from different county within same state.
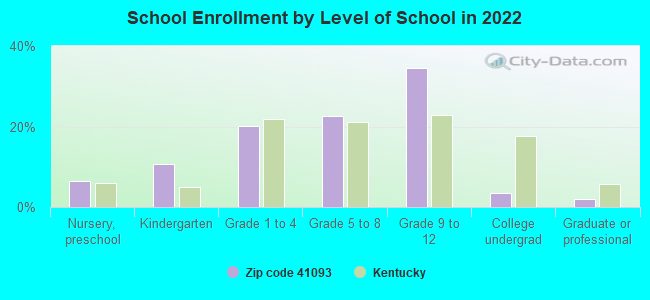
Private vs. public school enrollment:
Students in private schools in grades 1 to 8 (elementary and middle school): 24
Here:
10.3%
Kentucky:
17.2%
Students in private schools in grades 9 to 12 (high school): 15
Here:
8.1%
Kentucky:
15.2%
Students in private undergraduate colleges:
Here:
0.0%
Kentucky:
19.6%
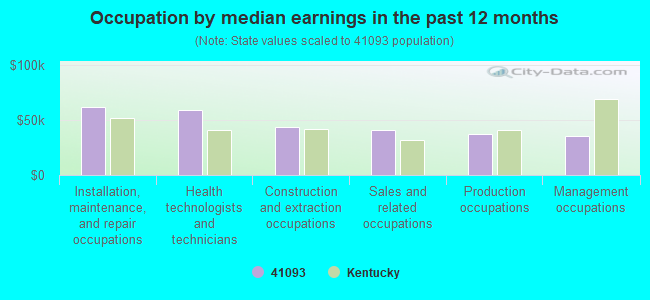
Occupation by median earnings in the past 12 months ($)
61,622Installation, maintenance, and repair occupations
58,973Health technologists and technicians
43,493Construction and extraction occupations
40,697Sales and related occupations
36,974Production occupations
35,311Management occupations
Companies with federal contracts located in this zip code:
JAMES HILTERBRAND (RUR RTE 6 BOX 96 in WALLINGFORD, KY; small business) : $18,000 in 2 contractsin 2002
$9,000 with Forest Service (disused code: now 12C2) for Other Natural Resources and Conservation Services. Signed on 2002-01-15. Completion date: 2002-02-15.
$9,000, same as above.Signed on 2002-01-15. Completion date: 2002-02-15.
Top industries in this zip code by the number of employees in 2005:
Health Care and Social Assistance: Home Health Care Services (10-19 employees: 1 establishment)
Construction: Poured Concrete Foundation and Structure Contractors (5-9: 1)
Arts, Entertainment, and Recreation: Fitness and Recreational Sports Centers (1-4: 1)
Construction: New Multifamily Housing Construction (except Operative Builders) (1-4: 1)
People in group quarters in 2010:
3 people in group homes intended for adults
People in group quarters in 2000:
9 people in other nonhousehold living situations
2 people in nursing homes
Fatal accident statistics in 2011:
Fatal accident count: 2
Vehicles involved in fatal accidents: 2
Fatal accidents caused by drunken drivers: 2
Fatalities: 2
Persons involved in fatal accidents: 3
Pedestrians involved in fatal accidents: 0
2002 - 2018 National Fire Incident Reporting System (NFIRS) incidents
According to the data from the years 2002 - 2018 the average number of fire incidents per year is 8. The highest number of reported fires - 23 took place in 2010, and the least - 0 in 2003. The data has a rising trend.
When looking into fire subcategories, the most incidents belonged to: Structure Fires (49.6%), and Outside Fires (32.1%).
Fire incident types reported to NFIRS in Zip Code 41093


 Nearest zip codes: 41049, 41189, 41041, 40351, 41179, 41135.


 According to the data from the years 2002 - 2018 the average number of fire incidents per year is 8. The highest number of reported fires - 23 took place in 2010, and the least - 0 in 2003. The data has a rising trend.
 When looking into fire subcategories, the most incidents belonged to: Structure Fires (49.6%), and Outside Fires (32.1%).