Estimated zip code population in 2022: 1,393 Zip code population in 2010: 1,355 Zip code population in 2000: 1,215
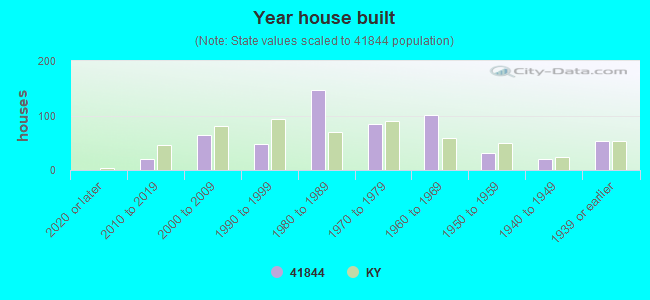
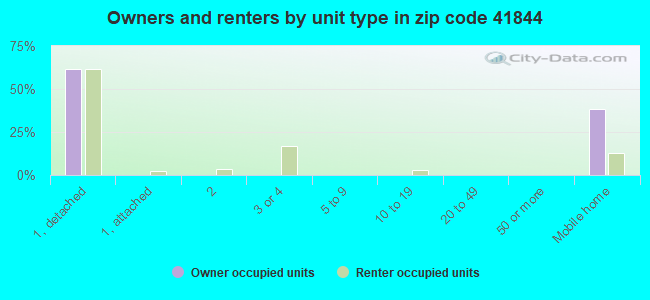
Houses and condos: 577 Renter-occupied apartments: 258
% of renters here:
51%
State:
31%
March 2022 cost of living index in zip code 41844: 80.1 (low, U.S. average is 100)
Land area: 13.3 sq. mi. Water area: 0.0 sq. mi.
Population density: 105 people per square mile
(very low).
OSM Map
General Map
Google Map
MSN Map
OSM Map
General Map
Google Map
MSN Map
OSM Map
General Map
Google Map
MSN Map
OSM Map
General Map
Google Map
MSN Map
Please wait while loading the map...
Median real estate property taxes paid for housing units with mortgages in 2022: $1,302 (0.9%) Median real estate property taxes paid for housing units with no mortgage in 2022: $270 (0.5%)
Business Search- 14 Million verified businesses
Males: 672
(48.3%)
Females: 721
(51.7%)
For population 25 years and over in 41844:
High school or higher: 79.3%
Bachelor's degree or higher: 29.1%
Graduate or professional degree: 12.2%
Unemployed: 15.8%
Mean travel time to work (commute): 22.4 minutes
For population 15 years and over in 41844:
Never married: 47.1%
Now married: 28.7%
Separated: 0.6%
Widowed: 4.1%
Divorced: 19.5%
Zip code 41844 compared to state average:
Median household income below state average.
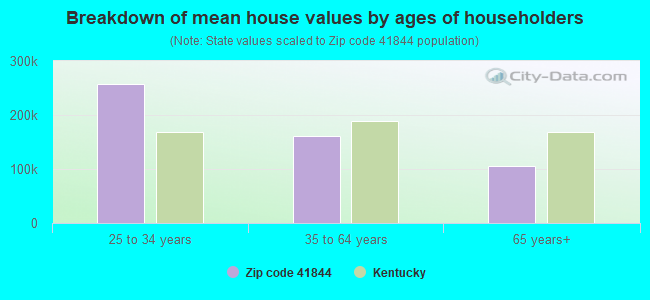
Median house value significantly below state average.
Unemployed percentage significantly above state average.
Black race population percentage significantly below state average.
Hispanic race population percentage below state average.
Median age significantly below state average.
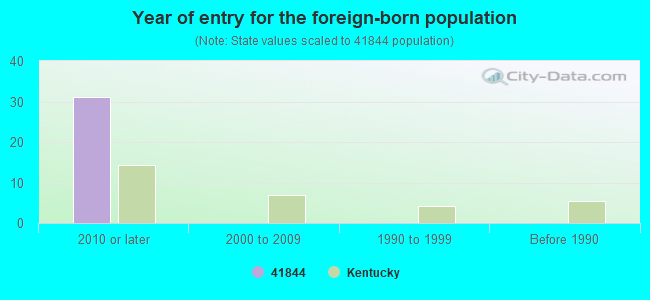
Foreign-born population percentage significantly below state average.
Renting percentage above state average.
Length of stay since moving in significantly above state average.
Number of college students significantly above state average.
Estimated median house/condo value in 2022: $67,319
41844:
$67,319
Kentucky:
$196,300
Median resident age:
This zip code:
27.3 years
Kentucky median age:
39.4 years
Average household size:
This zip code:
1.9 people
Kentucky:
2.4 people
Averages for the 2020 tax year for zip code 41844, filed in 2021:
Average Adjusted Gross Income (AGI) in 2020: $45,030 (Individual Income Tax Returns)
Here:
$45,030
State:
$61,342
Salary/wage: $37,629 (reported on 80.0% of returns)
Here:
$37,629
State:
$50,827
(% of AGI for various income ranges: 1093.0% for AGIs below $25k, 3024.3% for AGIs $25k-50k)
Taxable interest for individuals: $371 (reported on 23.3% of returns)
This zip code:
$371
Kentucky:
$1,441
(% of AGI for various income ranges: 8.0% for AGIs below $25k)
Profit/loss from business: +$6,650 (reported on 13.3% of returns)
Here:
+$6,650
State:
+$11,386
(% of AGI for various income ranges: 266.0% for AGIs below $25k)
Earned income credit: $2,689 (reported on 30.0% of returns)
Here:
$2,689
State:
$2,336
(% of AGI for various income ranges: 184.0% for AGIs below $25k, 82.9% for AGIs $25k-50k)
Percentage of individuals using paid preparers for their 2020 taxes: 96.7%
Here:
97%
State:
94%
(% for various income ranges: 93.3% for AGIs below $25k, 100.0% for AGIs $25k-50k, 100.0% for AGIs $50k-75k, 100.0% for AGIs $75k-100k, 100.0% for AGIs $100k-200k)
Averages for the 2012 tax year for zip code 41844, filed in 2013:
Average Adjusted Gross Income (AGI) in 2012: $34,992 (Individual Income Tax Returns)
Here:
$34,992
State:
$50,814
Salary/wage: $29,217 (reported on 83.3% of returns)
Here:
$29,217
State:
$42,723
(% of AGI for various income ranges: 70.2% for AGIs below $25k, 72.0% for AGIs $25k-50k, 120.0% for AGIs $50k-75k, 62.7% for AGIs $100k-200k)
Taxable interest for individuals: $311 (reported on 25.0% of returns)
This zip code:
$311
Kentucky:
$1,381
(% of AGI for various income ranges: 0.4% for AGIs $25k-50k, 0.9% for AGIs $75k-100k)
Profit/loss from business: +$7,860 (reported on 13.9% of returns)
Here:
+$7,860
State:
+$10,862
Total itemized deductions: $15,425 (17% of AGI, reported on 11.1% of returns)
Here:
$15,425
State:
$21,160
Here:
17.3% of AGI
State:
20.0% of AGI
Charity contributions: $3,450 (reported on 5.6% of returns)
Here:
$3,450
State:
$4,303
Taxes paid: $5,600 (reported on 11.1% of returns)
41844:
$5,600
State:
$8,496
Earned income credit: $1,936 (reported on 38.9% of returns)
Here:
$1,936
State:
$2,273
(% of AGI for various income ranges: 13.3% for AGIs below $25k)
Percentage of individuals using paid preparers for their 2012 taxes: 61.1%
Here:
61%
State:
60%
(% for various income ranges: 55.0% for AGIs below $25k, 71.4% for AGIs $25k-50k, 100.0% for AGIs $50k-75k, 66.7% for AGIs $100k-200k)
Averages for the 2004 tax year for zip code 41844, filed in 2005:
Average Adjusted Gross Income (AGI) in 2004: $30,029 (Individual Income Tax Returns)
Here:
$30,029
State:
$41,540
Salary/wage: $26,034 (reported on 87.3% of returns)
Here:
$26,034
State:
$36,432
(% of AGI for various income ranges: 95.1% for AGIs below $10k, 86.8% for AGIs $10k-25k, 83.2% for AGIs $25k-50k, 83.8% for AGIs $50k-75k, 72.1% for AGIs $75k-100k, 43.1% for AGIs over 100k)
Taxable interest for individuals: $790 (reported on 31.0% of returns)
This zip code:
$790
Kentucky:
$1,571
(% of AGI for various income ranges: 0.6% for AGIs below $10k, 0.4% for AGIs $10k-25k, 1.0% for AGIs $25k-50k, 0.3% for AGIs $50k-75k, 2.8% for AGIs $75k-100k)
Taxable dividends: $857 (reported on 4.1% of returns)
Here:
$857
State:
$3,453
Net capital gain/loss: +$3,700 (reported on 2.9% of returns)
Here:
+$3,700
State:
+$9,663
Profit/loss from business: +$3,556 (reported on 13.3% of returns)
Here:
+$3,556
State:
+$9,233
Total itemized deductions: $13,933 (17% of AGI, reported on 8.8% of returns)
Here:
$13,933
State:
$17,474
Here:
16.6% of AGI
State:
21.0% of AGI
Charity contributions deductions: $3,150 (3% of AGI, reported on 5.9% of returns)
Here:
$3,150
State:
$3,494
Here:
3.4% of AGI
State:
4.0% of AGI
Total tax: $4,364 (reported on 60.8% of returns)
41844:
$4,364
State:
$6,162
(% of AGI for various income ranges: 3.7% for AGIs below $10k, 3.3% for AGIs $10k-25k, 6.2% for AGIs $25k-50k, 8.7% for AGIs $50k-75k, 12.4% for AGIs $75k-100k, 16.4% for AGIs over 100k)
Earned income credit: $1,327 (reported on 33.3% of returns)
Here:
$1,327
State:
$1,723
Percentage of individuals using paid preparers for their 2004 taxes: 72.3%
Here:
72%
State:
66%
(% for various income ranges: 77.1% for AGIs below $10k, 62.1% for AGIs $10k-25k, 71.4% for AGIs $25k-50k, 80.6% for AGIs $50k-75k, 62.5% for AGIs $75k-100k, 100.0% for AGIs over 100k)
Household received Food Stamps/SNAP in the past 12 months: 148 Household did not receive Food Stamps/SNAP in the past 12 months: 360
Women who did not have a birth in the past 12 months: 414 (88 now married, 324 unmarried)
Housing units in zip code 41844 with a mortgage: 28 Median monthly owner costs for units with a mortgage: $1,213 Median monthly owner costs for units without a mortgage: $262
Residents with income below the poverty level in 2022:
This zip code:
29.1%
Whole state:
16.5%
Residents with income below 50% of the poverty level in 2022:
This zip code:
22.8%
Whole state:
9.0%
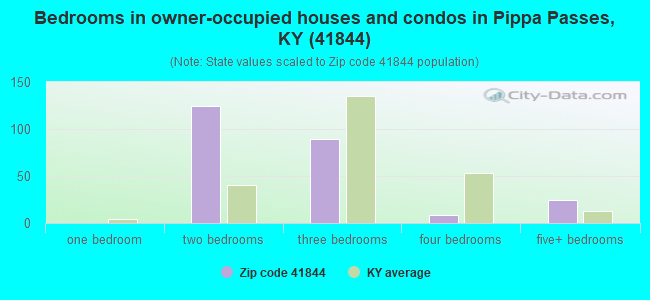
Median number of rooms in houses and condos:
Here:
5.2
State:
6.4
Median number of rooms in apartments:
Here:
5.0
State:
4.4
Notable locations in this zip code not listed on our city pages
Churches in zip code 41844 include: Hollybush Church (A), Mount Olive Old Regular Baptist Church (B), Holly Bush Old Regular Baptist Church (C), Reynolds Fork Church (D). Display/hide their locations on the map
Streams, rivers, and creeks: Bloomer Branch (A), Watkins Branch (B), Cottonpatch Branch (C), Trace Fork (D), Pigman Branch (E), Calfpen Branch (F), Buzzer Branch (G), Spicewood Branch (H), Sparkman Branch (I). Display/hide their locations on the map
In group quarters: 399 (-1 institutionalized population)
Size of family households: 113 2-persons, 95 3-persons, 24 4-persons, 5 5-persons, 10 6-persons, 7 7-or-more-persons
Size of nonfamily households: 234 1-person, 19 2-persons
129 married couples with children.
33 single-parent households (33 women).
96.5% of residents of 41844 zip code speak English at home.
2.1% of residents speak Spanish at home (82% very well, 18% well).
0.6% of residents speak Asian or Pacific Island language at home (100% very well).
0.5% of residents speak other language at home (100% well).
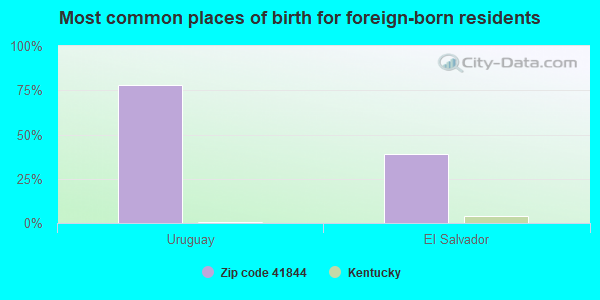
Foreign born population: 17 (1.2%) (0.0% of them are naturalized citizens)
:
1.2%
Whole state:
4.0%
78%Uruguay
39%El Salvador
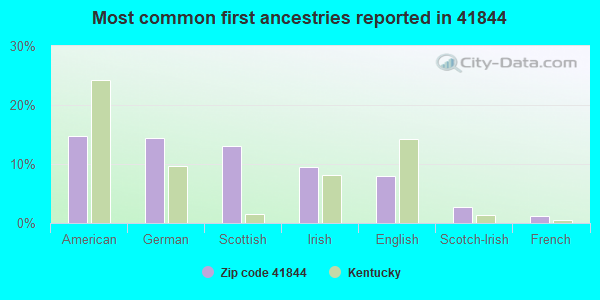
15%American
14%German
13%Scottish
10%Irish
8%English
3%Scotch-Irish
1%French
Year of entry for the foreign-born population
312010 or later
02000 to 2009
01990 to 1999
0Before 1990
Facilities with environmental interests located in this zip code:
CANEY CREEK ELEMENTARY SCHOOL (6740 HWY 899 in PIPPA PASSES, KY)
(National Center for Education Statistics) - STATE ID-060295090 Organizations: KNOTT COUNTY (SCHOOL DISTRICT)
KNOTT CO MINING CO (CR 1108 WITH KY HWY 899 in HOLLYBUSH, KY)
National Pollutant Discharge Elimination System NON-MAJOR (Tracking pollutant discharge elimination systems) - permit Business SIC classification: BITUMINOUS COAL AND LIGNITE SURFACE MINING
KNOTT CO WATER & SEWER DIST (100 PURPOSE RD in PIPPA PASSES, KY)
COMPLIANCE ACTIVITY (Tracking inspections of insecticide, fungicide, and rodenticide, and toxic substances) National Pollutant Discharge Elimination System NON-MAJOR (Tracking pollutant discharge elimination systems) - permit Business SIC classification: SEWERAGE SYSTEMS Alternative names: CANEY CREEK COMMUNITY CENTER, CANEY CREEK WATER DIST STP
CONSOL OF KY INC (KY 899 JCT W/SLONE BRANCH RD in PIPPA PASSES, KY)
National Pollutant Discharge Elimination System NON-MAJOR (Tracking pollutant discharge elimination systems) - permit Business SIC classification: BITUMINOUS COAL AND LIGNITE SURFACE MINING
MASON COAL INC (HOLLYBUSH RD in HOLLYBUSH, KY)
National Pollutant Discharge Elimination System NON-MAJOR (Tracking pollutant discharge elimination systems) - permit Business SIC classification: BITUMINOUS COAL AND LIGNITE SURFACE MINING
Housing units lacking complete plumbing facilities: 6.3% Housing units lacking complete kitchen facilities: 4.6%
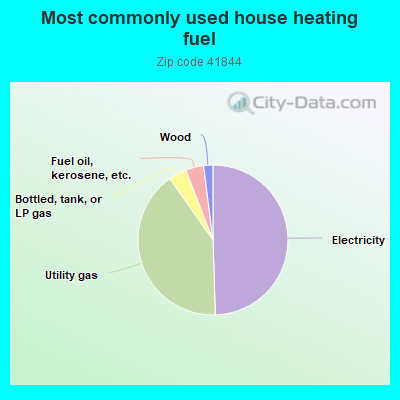
49.7%Electricity
40.9%Utility gas
3.9%Bottled, tank, or LP gas
3.9%Fuel oil, kerosene, etc.
2.0%Wood
Population in 1990: 197. Population change in the 1990s: +1,018 (+516.8%).
Place of birth for U.S.-born residents:
This state: 988
Northeast: 20
Midwest: 132
South: 220
49% of the 41844 zip code residents lived in the same house 5 years ago. Out of people who lived in different houses, 35% lived in this county. Out of people who lived in different counties, 50% lived in Kentucky.
82% of the 41844 zip code residents lived in the same house 1 year ago. Out of people who lived in different houses, 29% moved from this county. Out of people who lived in different houses, 47% moved from different county within same state. Out of people who lived in different houses, 23% moved from different state.
Private vs. public school enrollment:
Students in private schools in grades 1 to 8 (elementary and middle school): 25
Here:
33.1%
Kentucky:
17.2%
Students in private schools in grades 9 to 12 (high school): 19
Here:
73.3%
Kentucky:
15.2%
Students in private undergraduate colleges: 208
Here:
51.8%
Kentucky:
19.6%
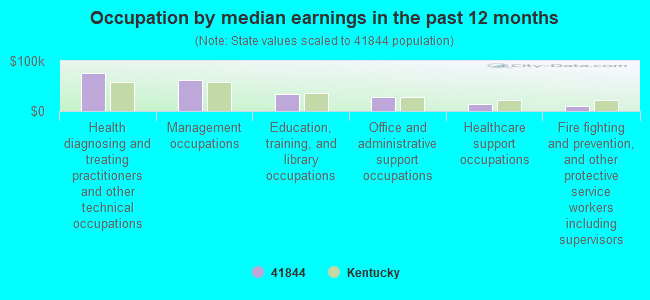
Occupation by median earnings in the past 12 months ($)
76,781Health diagnosing and treating practitioners and other technical occupations
61,875Management occupations
33,674Education, training, and library occupations
28,130Office and administrative support occupations
13,808Healthcare support occupations
9,891Fire fighting and prevention, and other protective service workers including supervisors
Top industries in this zip code by the number of employees in 2005:
Health Care and Social Assistance: Residential Mental Retardation Facilities (100-249 employees: 1 establishment)
Educational Services: Colleges, Universities, and Professional Schools (100-249: 1)
Accommodation and Food Services: Food Service Contractors (20-49: 1)
Construction: Masonry Contractors (10-19: 1)
Other Services (except Public Administration): Religious Organizations (1-4: 1)
Professional, Scientific, and Technical Services: Offices of Certified Public Accountants (1-4: 1)
People in group quarters in 2010:
393 people in college/university student housing
73 people in nursing facilities/skilled-nursing facilities
46 people in workers' group living quarters and job corps centers
People in group quarters in 2000:
329 people in college dormitories (includes college quarters off campus)
72 people in homes for the mentally ill
Most common first names in zip code 41844 among deceased individuals
Name
Count
Lived (average)
John
5
82.6 years
James
4
67.5 years
David
3
65.6 years
Curtis
3
71.3 years
Sarah
3
83.7 years
Alice
2
81.5 years
Odis
2
80.5 years
Cora
2
74.0 years
Hattie
2
79.5 years
Dora
2
73.0 years
Most common last names in zip code 41844 among deceased individuals
Last name
Count
Lived (average)
Slone
82
70.3 years
Jacobs
41
66.4 years
Sparkman
13
77.8 years
Watson
8
67.1 years
Huff
6
74.7 years
Gibson
6
72.8 years
Hall
6
79.2 years
Thornsberry
6
77.3 years
Caudill
4
68.2 years
Smith
4
68.5 years
Discuss Pippa Passes, Kentucky (KY) on our hugely popular Kentucky forum.

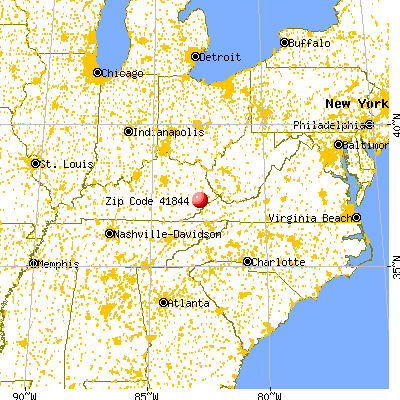


 Nearest zip codes: 41843, 41817, 41836, 41828, 41839, 41862.