Estimated zip code population in 2022: 803 Zip code population in 2010: 1,068 Zip code population in 2000: 973
Houses and condos: 350 Renter-occupied apartments: 51
% of renters here:
15%
State:
31%
March 2022 cost of living index in zip code 42035: 80.5 (low, U.S. average is 100)
Land area: 28.1 sq. mi. Water area: 0.3 sq. mi.
Population density: 29 people per square mile
(very low).
OSM Map
General Map
Google Map
MSN Map
OSM Map
General Map
Google Map
MSN Map
OSM Map
General Map
Google Map
MSN Map
OSM Map
General Map
Google Map
MSN Map
Please wait while loading the map...
Real estate property taxes paid for housing units in 2022:
This zip code:
0.9% ($883)
Kentucky:
0.7% ($1,456)
Median real estate property taxes paid for housing units with mortgages in 2022: $695 (0.4%) Median real estate property taxes paid for housing units with no mortgage in 2022: $1,045 (0.8%)
Business Search- 14 Million verified businesses
Males: 373
(46.5%)
Females: 429
(53.5%)
For population 25 years and over in 42035:
High school or higher: 86.2%
Bachelor's degree or higher: 18.4%
Graduate or professional degree: 9.5%
Unemployed: 3.0%
Mean travel time to work (commute): 24.2 minutes
For population 15 years and over in 42035:
Never married: 27.1%
Now married: 40.0%
Separated: 0.0%
Widowed: 15.1%
Divorced: 17.8%
Zip code 42035 compared to state average:
Median house value below state average.
Black race population percentage significantly below state average.
Foreign-born population percentage significantly below state average.
Renting percentage below state average.
Length of stay since moving in significantly below state average.
Percentage of population with a bachelor's degree or higher below state average.
Averages for the 2020 tax year for zip code 42035, filed in 2021:
Average Adjusted Gross Income (AGI) in 2020: $74,416 (Individual Income Tax Returns)
Here:
$74,416
State:
$61,342
Salary/wage: $49,584 (reported on 72.7% of returns)
Here:
$49,584
State:
$50,827
(% of AGI for various income ranges: 1048.8% for AGIs below $25k, 3308.8% for AGIs $25k-50k, 5844.0% for AGIs $50k-75k, 9066.7% for AGIs $75k-100k, 16847.5% for AGIs $100k-200k)
Taxable interest for individuals: $3,638 (reported on 29.5% of returns)
This zip code:
$3,638
Kentucky:
$1,441
(% of AGI for various income ranges: 56.2% for AGIs below $25k, 32.0% for AGIs $50k-75k, 1030.0% for AGIs $100k-200k)
Ordinary dividends: $1,020 (reported on 11.4% of returns)
Here:
$1,020
State:
$7,388
(% of AGI for various income ranges: 27.5% for AGIs $25k-50k, 72.5% for AGIs $100k-200k)
Net capital gain/loss in AGI: +$7,650 (reported on 13.6% of returns)
Here:
+$7,650
State:
+$19,475
(% of AGI for various income ranges: 41.2% for AGIs below $25k, 1065.0% for AGIs $100k-200k)
Profit/loss from business: +$8,100 (reported on 22.7% of returns)
Here:
+$8,100
State:
+$11,386
(% of AGI for various income ranges: 267.5% for AGIs below $25k, 573.8% for AGIs $25k-50k, 456.7% for AGIs $75k-100k)
Taxable individual retirement arrangement distribution: $8,833 (reported on 6.8% of returns)
42035:
$8,833
Kentucky:
$18,941
(% of AGI for various income ranges: 331.2% for AGIs $25k-50k)
Total itemized deductions: $38,467 (reported on 6.8% of returns)
Here:
$38,467
State:
$32,473
(% of AGI for various income ranges: 2885.0% for AGIs $100k-200k)
Charity contributions: $37,400 (reported on 4.5% of returns)
Here:
$37,400
State:
$13,472
(% of AGI for various income ranges: 1870.0% for AGIs $100k-200k)
Taxes paid: $6,733 (reported on 6.8% of returns)
42035:
$6,733
State:
$7,830
(% of AGI for various income ranges: 505.0% for AGIs $100k-200k)
Earned income credit: $2,700 (reported on 15.9% of returns)
Here:
$2,700
State:
$2,336
(% of AGI for various income ranges: 125.0% for AGIs below $25k, 111.2% for AGIs $25k-50k)
Percentage of individuals using paid preparers for their 2020 taxes: 100.0%
Here:
100%
State:
94%
(% for various income ranges: 100.0% for AGIs below $25k, 100.0% for AGIs $25k-50k, 100.0% for AGIs $50k-75k, 100.0% for AGIs $75k-100k, 100.0% for AGIs $100k-200k)
Averages for the 2012 tax year for zip code 42035, filed in 2013:
Average Adjusted Gross Income (AGI) in 2012: $60,289 (Individual Income Tax Returns)
Here:
$60,289
State:
$50,814
Salary/wage: $40,735 (reported on 73.9% of returns)
Here:
$40,735
State:
$42,723
(% of AGI for various income ranges: 65.8% for AGIs below $25k, 59.8% for AGIs $25k-50k, 74.8% for AGIs $50k-75k, 70.8% for AGIs $75k-100k, 28.6% for AGIs $100k-200k)
Taxable interest for individuals: $3,624 (reported on 37.0% of returns)
This zip code:
$3,624
Kentucky:
$1,381
(% of AGI for various income ranges: 1.6% for AGIs below $25k, 1.6% for AGIs $25k-50k, 0.7% for AGIs $50k-75k, 0.7% for AGIs $75k-100k, 3.6% for AGIs $100k-200k)
Ordinary dividends: $800 (reported on 17.4% of returns)
Here:
$800
State:
$6,239
(% of AGI for various income ranges: 1.3% for AGIs below $25k, 0.3% for AGIs $50k-75k, 0.2% for AGIs $100k-200k)
Net capital gain/loss in AGI: +$2,600 (reported on 17.4% of returns)
Here:
+$2,600
State:
+$11,336
(% of AGI for various income ranges: 0.2% for AGIs below $25k, 3.7% for AGIs $25k-50k, 1.4% for AGIs $75k-100k)
Profit/loss from business: +$7,436 (reported on 23.9% of returns)
Here:
+$7,436
State:
+$10,862
(% of AGI for various income ranges: 14.2% for AGIs below $25k, 9.5% for AGIs $25k-50k, 2.4% for AGIs $50k-75k)
Taxable individual retirement arrangement distribution: $5,780 (reported on 10.9% of returns)
42035:
$5,780
Kentucky:
$14,296
Total itemized deductions: $21,793 (18% of AGI, reported on 30.4% of returns)
Here:
$21,793
State:
$21,160
Here:
18.2% of AGI
State:
20.0% of AGI
(% of AGI for various income ranges: 16.3% for AGIs $25k-50k, 11.5% for AGIs $50k-75k, 11.1% for AGIs $75k-100k, 11.2% for AGIs $100k-200k)
Charity contributions: $8,692 (reported on 28.3% of returns)
Here:
$8,692
State:
$4,303
(% of AGI for various income ranges: 5.0% for AGIs below $25k, 3.3% for AGIs $50k-75k, 3.7% for AGIs $75k-100k, 5.5% for AGIs $100k-200k)
Taxes paid: $6,000 (reported on 30.4% of returns)
42035:
$6,000
State:
$8,496
(% of AGI for various income ranges: 2.4% for AGIs $25k-50k, 3.3% for AGIs $50k-75k, 3.9% for AGIs $75k-100k, 3.4% for AGIs $100k-200k)
Earned income credit: $2,080 (reported on 21.7% of returns)
Here:
$2,080
State:
$2,273
(% of AGI for various income ranges: 5.1% for AGIs below $25k, 2.2% for AGIs $25k-50k)
Percentage of individuals using paid preparers for their 2012 taxes: 71.7%
Here:
72%
State:
60%
(% for various income ranges: 66.7% for AGIs below $25k, 72.7% for AGIs $25k-50k, 85.7% for AGIs $50k-75k, 60.0% for AGIs $75k-100k, 80.0% for AGIs $100k-200k)
Averages for the 2004 tax year for zip code 42035, filed in 2005:
Average Adjusted Gross Income (AGI) in 2004: $38,232 (Individual Income Tax Returns)
Here:
$38,232
State:
$41,540
Salary/wage: $35,650 (reported on 73.2% of returns)
Here:
$35,650
State:
$36,432
(% of AGI for various income ranges: 77.7% for AGIs below $10k, 57.1% for AGIs $10k-25k, 69.9% for AGIs $25k-50k, 73.3% for AGIs $50k-75k, 74.3% for AGIs $75k-100k, 59.7% for AGIs over 100k)
Taxable interest for individuals: $1,303 (reported on 54.0% of returns)
This zip code:
$1,303
Kentucky:
$1,571
(% of AGI for various income ranges: 10.5% for AGIs below $10k, 5.3% for AGIs $10k-25k, 1.9% for AGIs $25k-50k, 1.1% for AGIs $50k-75k, 0.4% for AGIs $75k-100k, 1.1% for AGIs over 100k)
Taxable dividends: $467 (reported on 21.3% of returns)
Here:
$467
State:
$3,453
(% of AGI for various income ranges: 1.2% for AGIs $10k-25k, 0.1% for AGIs $25k-50k, 0.2% for AGIs $50k-75k, 0.2% for AGIs over 100k)
Net capital gain/loss: +$667 (reported on 14.2% of returns)
Here:
+$667
State:
+$9,663
(% of AGI for various income ranges: 0.5% for AGIs $10k-25k, 0.1% for AGIs $25k-50k, 0.5% for AGIs $50k-75k, 0.2% for AGIs $75k-100k)
Profit/loss from business: +$10,301 (reported on 24.4% of returns)
Here:
+$10,301
State:
+$9,233
(% of AGI for various income ranges: 13.4% for AGIs below $10k, 14.4% for AGIs $10k-25k, 10.2% for AGIs $25k-50k, 3.2% for AGIs $50k-75k, 6.9% for AGIs $75k-100k)
Total itemized deductions: $15,417 (25% of AGI, reported on 32.9% of returns)
Here:
$15,417
State:
$17,474
Here:
24.6% of AGI
State:
21.0% of AGI
(% of AGI for various income ranges: 19.5% for AGIs $10k-25k, 9.6% for AGIs $25k-50k, 12.1% for AGIs $50k-75k, 16.5% for AGIs $75k-100k, 14.3% for AGIs over 100k)
Charity contributions deductions: $5,540 (8% of AGI, reported on 29.9% of returns)
Here:
$5,540
State:
$3,494
Here:
8.4% of AGI
State:
4.0% of AGI
(% of AGI for various income ranges: 4.0% for AGIs $10k-25k, 2.8% for AGIs $25k-50k, 4.8% for AGIs $50k-75k, 6.4% for AGIs $75k-100k, 4.5% for AGIs over 100k)
Total tax: $4,652 (reported on 78.2% of returns)
42035:
$4,652
State:
$6,162
(% of AGI for various income ranges: 4.6% for AGIs below $10k, 4.7% for AGIs $10k-25k, 7.1% for AGIs $25k-50k, 8.5% for AGIs $50k-75k, 10.8% for AGIs $75k-100k, 16.3% for AGIs over 100k)
Earned income credit: $1,569 (reported on 17.1% of returns)
Here:
$1,569
State:
$1,723
Percentage of individuals using paid preparers for their 2004 taxes: 79.1%
Here:
79%
State:
66%
(% for various income ranges: 70.9% for AGIs below $10k, 84.5% for AGIs $10k-25k, 82.2% for AGIs $25k-50k, 76.7% for AGIs $50k-75k, 79.4% for AGIs $75k-100k, 71.4% for AGIs over 100k)
Household received Food Stamps/SNAP in the past 12 months: 24 Household did not receive Food Stamps/SNAP in the past 12 months: 308
Women who had a birth in the past 12 months: 10 (10 now married, 0 unmarried) Women who did not have a birth in the past 12 months: 144 (49 now married, 95 unmarried)
Housing units in zip code 42035 with a mortgage: 106 (7 second mortgage, 7 both second mortgage and home equity loan) Median monthly owner costs for units with a mortgage: $1,468 Median monthly owner costs for units without a mortgage: $472
Residents with income below the poverty level in 2022:
This zip code:
10.7%
Whole state:
16.5%
Residents with income below 50% of the poverty level in 2022:
This zip code:
10.1%
Whole state:
9.0%
Median number of rooms in houses and condos:
Here:
6.0
State:
6.4
Median number of rooms in apartments:
Here:
4.1
State:
4.4
Notable locations in this zip code not listed on our city pages
Streams, rivers, and creeks: Barn Branch (A), Billington Creek (B), Brush Creek (C), Wilson Creek (D), Sugar Creek (E), Buckler Creek (F), Lick Creek (G), Heflin Creek (H), Goose Creek (I). Display/hide their locations on the map
Size of family households: 101 2-persons, 87 3-persons, 7 4-persons, 10 5-persons, 15 7-or-more-persons
Size of nonfamily households: 99 1-person, 12 2-persons
98 married couples with children.
59 single-parent households (5 men, 54 women).
98.7% of residents of 42035 zip code speak English at home.
1.4% of residents speak Spanish at home (100% very well).
Foreign born population: 0 (0.0%)
:
0.0%
Whole state:
4.0%
83%English
14%Irish
3%German
2%American
2%Scottish
2%Italian
1%European
Facilities with environmental interests located in this zip code:
CERAMICS DESIGNS INCORPORATED (HIGHWAY 62 EAST in CUNNINGHAM, KY)
National Pollutant Discharge Elimination System NON-MAJOR (Tracking pollutant discharge elimination systems) - permit Business SIC classification: POTTERY PRODUCTS
PRESSON TRUCKING (HWY 121 in CUNNINGHAM, KY)
National Pollutant Discharge Elimination System NON-MAJOR (Tracking pollutant discharge elimination systems) - permit Business SIC classification: CRUSHED AND BROKEN LIMESTONE
CERAMICS DESIGNS (BOX 455 HWY 62 in CUNNINGHAM, KY)
CRITERIA AND HAZARDOUS AIR POLLUTANT INVENTORY (Inventory of air pollution sources) Business SIC classification: POTTERY PRODUCTS Business NAICS classification: VITREOUS CHINA, FINE EARTHENWARE, AND OTHER POTTERY PRODUCT MANUFACTURING. Alternative names: NATIONAL CERAMICS INC
38.9%Electricity
31.1%Utility gas
30.2%Bottled, tank, or LP gas
Population in 1990: 1,501.
Place of birth for U.S.-born residents:
This state: 542
Midwest: 164
South: 56
West: 42
57% of the 42035 zip code residents lived in the same house 5 years ago. Out of people who lived in different houses, 42% lived in this county. Out of people who lived in different counties, 50% lived in Kentucky.
93% of the 42035 zip code residents lived in the same house 1 year ago. Out of people who lived in different houses, 92% moved from this county.
Private vs. public school enrollment:
Students in private schools in grades 1 to 8 (elementary and middle school):
Here:
0.0%
Kentucky:
17.2%
Students in private schools in grades 9 to 12 (high school): 16
Here:
35.4%
Kentucky:
15.2%
Students in private undergraduate colleges:
Here:
0.0%
Kentucky:
19.6%
Occupation by median earnings in the past 12 months ($)
78,365Construction and extraction occupations
67,407Production occupations
12,852Building and grounds cleaning and maintenance occupations
Companies with federal contracts located in this zip code:
TERRY LAND DEVELOPMENT INC (HIGHWAY 62 & 307 in CUNNINGHAM, KY; small business) : $4,732,907 in 102 contractsfrom 2000 to 2006
Contracts for Landscaping/Groundskeeping Services, Maintenance, Repair or Alteration of Real Property -- Sewage and Waste Facilities, Maintenance, Repair or Alteration of Real Property -- Unimproved Real Property (Land), Construction of Structures and Facilities -- Highways, Roads, Streets, Bridges, and Railways (includes resurfacing), and moreby Army, U.S. Fish and Wildlife Service Signed by year:2000: $1,374,311; 2001: $77,834; 2002: $760,560; 2003: $134,803; 2004: $998,772; 2005: $1,383,733; 2006: $2,894.
Biggest contracts:
$1,014,545 with Army for Landscaping/Groundskeeping Services. Signed on 2004-02-24. Completion date: 2004-03-15.
$864,583 with Army for Maintenance, Repair or Alteration of Real Property -- Sewage and Waste Facilities. Signed on 2000-06-06. Completion date: 2000-10-23.
$350,773 with Army for Landscaping/Groundskeeping Services. Signed on 2005-06-20. Completion date: 2004-03-15.
$286,988, same as above.Signed on 2005-04-21. Completion date: 2004-03-15.
Top industries in this zip code by the number of employees in 2005:
Administrative and Support and Waste Management and Remediation Services: Janitorial Services (10-19 employees: 1 establishment)
Wholesale Trade: Wholesale Trade Agents and Brokers (5-9: 1)
Construction: New Single-Family Housing Construction (except Operative Builders) (5-9: 1)
Construction: New Housing Operative Builders (5-9: 1)
Construction: Site Preparation Contractors (1-4: 2)
Other Services (except Public Administration): Religious Organizations (1-4: 1)
22 people in other noninstitutional group quarters
Fatal accident statistics in 2011:
Fatal accident count: 1
Vehicles involved in fatal accidents: 1
Fatal accidents caused by drunken drivers: 0
Fatalities: 1
Persons involved in fatal accidents: 23
Pedestrians involved in fatal accidents: 0
Fatal accident statistics in 2010:
Fatal accident count: 1
Vehicles involved in fatal accidents: 2
Fatal accidents caused by drunken drivers: 1
Fatalities: 1
Persons involved in fatal accidents: 3
Pedestrians involved in fatal accidents: 0
2002 - 2018 National Fire Incident Reporting System (NFIRS) incidents
Based on the data from the years 2002 - 2018 the average number of fires per year is 9. The highest number of fires - 28 took place in 2006, and the least - 2 in 2009. The data has a declining trend.
When looking into fire subcategories, the most incidents belonged to: Outside Fires (47.7%), and Structure Fires (35.6%).
Fire incident types reported to NFIRS in Zip Code 42035

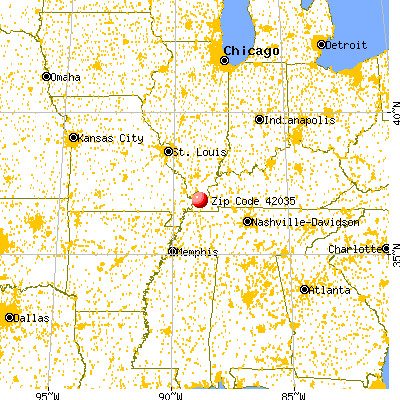


 Nearest zip codes: 42060, 42061, 42069, 42039, 42023, 42087.


 Based on the data from the years 2002 - 2018 the average number of fires per year is 9. The highest number of fires - 28 took place in 2006, and the least - 2 in 2009. The data has a declining trend.
 When looking into fire subcategories, the most incidents belonged to: Outside Fires (47.7%), and Structure Fires (35.6%).