Estimated zip code population in 2022: 2,327 Zip code population in 2010: 2,314 Zip code population in 2000: 2,654
Houses and condos: 1,002 Renter-occupied apartments: 184
% of renters here:
21%
State:
31%
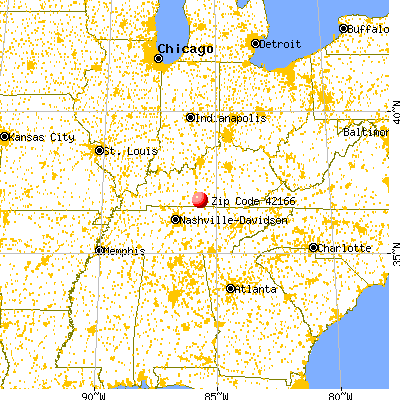
March 2022 cost of living index in zip code 42166: 80.6 (low, U.S. average is 100)
Land area: 71.7 sq. mi. Water area: 0.2 sq. mi.
Population density: 32 people per square mile
(very low).
OSM Map
General Map
Google Map
MSN Map
OSM Map
General Map
Google Map
MSN Map
OSM Map
General Map
Google Map
MSN Map
OSM Map
General Map
Google Map
MSN Map
Please wait while loading the map...
Real estate property taxes paid for housing units in 2022:
This zip code:
0.5% ($614)
Kentucky:
0.7% ($1,456)
Median real estate property taxes paid for housing units with mortgages in 2022: $882 (0.7%) Median real estate property taxes paid for housing units with no mortgage in 2022: $509 (0.4%)
Business Search- 14 Million verified businesses
Males: 1,054
(45.3%)
Females: 1,273
(54.7%)
For population 25 years and over in 42166:
High school or higher: 87.4%
Bachelor's degree or higher: 15.2%
Graduate or professional degree: 4.8%
Mean travel time to work (commute): 29.6 minutes
For population 15 years and over in 42166:
Never married: 21.4%
Now married: 60.6%
Separated: 0.2%
Widowed: 4.3%
Divorced: 13.5%
Zip code 42166 compared to state average:
Median house value below state average.
Unemployed percentage significantly below state average.
Black race population percentage significantly below state average.
Hispanic race population percentage significantly below state average.
Foreign-born population percentage significantly below state average.
Renting percentage below state average.
Length of stay since moving in significantly above state average.
Number of college students significantly below state average.
Percentage of population with a bachelor's degree or higher below state average.
Estimated median house/condo value in 2022: $115,673
42166:
$115,673
Kentucky:
$196,300
According to our research of Kentucky and other state lists, there were 8 registered sex offenders living in 42166 zip code as of May 28, 2024. The ratio of all residents to sex offenders in zip code 42166 is 370 to 1. The ratio of registered sex offenders to all residents in this zip code is near the state average.
Median resident age:
This zip code:
38.8 years
Kentucky median age:
39.4 years
Average household size:
This zip code:
2.6 people
Kentucky:
2.4 people
Averages for the 2020 tax year for zip code 42166, filed in 2021:
Average Adjusted Gross Income (AGI) in 2020: $39,546 (Individual Income Tax Returns)
Here:
$39,546
State:
$61,342
Salary/wage: $38,201 (reported on 78.9% of returns)
Here:
$38,201
State:
$50,827
(% of AGI for various income ranges: 1207.6% for AGIs below $25k, 3531.8% for AGIs $25k-50k, 6093.3% for AGIs $50k-75k, 8288.0% for AGIs $75k-100k, 14807.5% for AGIs $100k-200k)
Taxable interest for individuals: $888 (reported on 25.3% of returns)
This zip code:
$888
Kentucky:
$1,441
(% of AGI for various income ranges: 33.8% for AGIs below $25k, 19.5% for AGIs $25k-50k, 27.5% for AGIs $50k-75k, 26.0% for AGIs $75k-100k, 65.0% for AGIs $100k-200k)
Ordinary dividends: $1,312 (reported on 8.4% of returns)
Here:
$1,312
State:
$7,388
(% of AGI for various income ranges: 29.0% for AGIs below $25k, 17.5% for AGIs $50k-75k)
Net capital gain/loss in AGI: +$7,478 (reported on 9.5% of returns)
Here:
+$7,478
State:
+$19,475
(% of AGI for various income ranges: 34.5% for AGIs below $25k, 71.8% for AGIs $25k-50k, 830.0% for AGIs $75k-100k)
Profit/loss from business: +$5,711 (reported on 18.9% of returns)
Here:
+$5,711
State:
+$11,386
(% of AGI for various income ranges: 208.6% for AGIs below $25k, 149.5% for AGIs $25k-50k, 288.0% for AGIs $75k-100k)
Taxable individual retirement arrangement distribution: $14,243 (reported on 7.4% of returns)
42166:
$14,243
Kentucky:
$18,941
(% of AGI for various income ranges: 99.0% for AGIs below $25k, 591.7% for AGIs $50k-75k)
Earned income credit: $2,696 (reported on 24.2% of returns)
Here:
$2,696
State:
$2,336
(% of AGI for various income ranges: 149.3% for AGIs below $25k, 85.0% for AGIs $25k-50k)
Percentage of individuals using paid preparers for their 2020 taxes: 96.8%
Here:
97%
State:
94%
(% for various income ranges: 95.2% for AGIs below $25k, 96.3% for AGIs $25k-50k, 100.0% for AGIs $50k-75k, 100.0% for AGIs $75k-100k, 100.0% for AGIs $100k-200k)
Averages for the 2012 tax year for zip code 42166, filed in 2013:
Average Adjusted Gross Income (AGI) in 2012: $32,684 (Individual Income Tax Returns)
Here:
$32,684
State:
$50,814
Salary/wage: $32,274 (reported on 79.3% of returns)
Here:
$32,274
State:
$42,723
(% of AGI for various income ranges: 72.3% for AGIs below $25k, 84.0% for AGIs $25k-50k, 83.2% for AGIs $50k-75k, 83.5% for AGIs $75k-100k, 59.7% for AGIs $100k-200k)
Taxable interest for individuals: $773 (reported on 32.6% of returns)
This zip code:
$773
Kentucky:
$1,381
(% of AGI for various income ranges: 1.8% for AGIs below $25k, 0.7% for AGIs $25k-50k, 0.4% for AGIs $50k-75k, 0.3% for AGIs $75k-100k, 0.6% for AGIs $100k-200k)
Ordinary dividends: $1,300 (reported on 7.6% of returns)
Here:
$1,300
State:
$6,239
Net capital gain/loss in AGI: +$4,460 (reported on 16.3% of returns)
Here:
+$4,460
State:
+$11,336
(% of AGI for various income ranges: 4.0% for AGIs below $25k, 1.8% for AGIs $25k-50k, 1.2% for AGIs $50k-75k, 4.2% for AGIs $75k-100k)
Profit/loss from business: +$5,278 (reported on 19.6% of returns)
Here:
+$5,278
State:
+$10,862
(% of AGI for various income ranges: 13.4% for AGIs below $25k, 1.6% for AGIs $25k-50k, 0.7% for AGIs $50k-75k)
Taxable individual retirement arrangement distribution: $9,350 (reported on 6.5% of returns)
42166:
$9,350
Kentucky:
$14,296
Total itemized deductions: $16,623 (29% of AGI, reported on 14.1% of returns)
Here:
$16,623
State:
$21,160
Here:
29.2% of AGI
State:
20.0% of AGI
(% of AGI for various income ranges: 6.8% for AGIs below $25k, 5.3% for AGIs $25k-50k, 8.3% for AGIs $50k-75k, 15.7% for AGIs $75k-100k)
Charity contributions: $2,178 (reported on 9.8% of returns)
Here:
$2,178
State:
$4,303
(% of AGI for various income ranges: 0.6% for AGIs $25k-50k, 0.6% for AGIs $50k-75k, 2.1% for AGIs $75k-100k)
Taxes paid: $4,246 (reported on 14.1% of returns)
42166:
$4,246
State:
$8,496
(% of AGI for various income ranges: 0.5% for AGIs below $25k, 1.2% for AGIs $25k-50k, 2.0% for AGIs $50k-75k, 6.0% for AGIs $75k-100k)
Earned income credit: $2,200 (reported on 31.5% of returns)
Here:
$2,200
State:
$2,273
(% of AGI for various income ranges: 8.6% for AGIs below $25k, 1.7% for AGIs $25k-50k)
Percentage of individuals using paid preparers for their 2012 taxes: 81.5%
Here:
82%
State:
60%
(% for various income ranges: 78.7% for AGIs below $25k, 84.0% for AGIs $25k-50k, 81.8% for AGIs $50k-75k, 83.3% for AGIs $75k-100k, 100.0% for AGIs $100k-200k)
Averages for the 2004 tax year for zip code 42166, filed in 2005:
Average Adjusted Gross Income (AGI) in 2004: $26,101 (Individual Income Tax Returns)
Here:
$26,101
State:
$41,540
Salary/wage: $28,627 (reported on 80.8% of returns)
Here:
$28,627
State:
$36,432
(% of AGI for various income ranges: 112.3% for AGIs below $10k, 84.7% for AGIs $10k-25k, 93.1% for AGIs $25k-50k, 94.1% for AGIs $50k-75k, 111.0% for AGIs $75k-100k)
Taxable interest for individuals: $870 (reported on 37.2% of returns)
This zip code:
$870
Kentucky:
$1,571
(% of AGI for various income ranges: 11.7% for AGIs below $10k, 1.8% for AGIs $10k-25k, 0.7% for AGIs $25k-50k, 0.6% for AGIs $50k-75k, 0.4% for AGIs $75k-100k)
Taxable dividends: $430 (reported on 8.5% of returns)
Here:
$430
State:
$3,453
(% of AGI for various income ranges: 0.2% for AGIs below $10k, 0.4% for AGIs $10k-25k, 0.1% for AGIs $25k-50k, 0.1% for AGIs $75k-100k)
Net capital gain/loss: +$5,584 (reported on 10.9% of returns)
Here:
+$5,584
State:
+$9,663
(% of AGI for various income ranges: 12.7% for AGIs below $10k, 2.3% for AGIs $10k-25k, 0.3% for AGIs $25k-50k, 1.3% for AGIs $50k-75k, 8.4% for AGIs $75k-100k)
Profit/loss from business: +$2,898 (reported on 17.8% of returns)
Here:
+$2,898
State:
+$9,233
(% of AGI for various income ranges: 9.2% for AGIs below $10k, 5.4% for AGIs $10k-25k, 1.2% for AGIs $25k-50k, 0.2% for AGIs $50k-75k)
IRA payment deduction: $2,800 (reported on 2.2% of returns)
42166:
$2,800
Kentucky:
$2,955
Total itemized deductions: $12,831 (24% of AGI, reported on 13.3% of returns)
Here:
$12,831
State:
$17,474
Here:
23.6% of AGI
State:
21.0% of AGI
(% of AGI for various income ranges: 3.5% for AGIs $10k-25k, 6.5% for AGIs $25k-50k, 8.5% for AGIs $50k-75k, 14.2% for AGIs $75k-100k)
Charity contributions deductions: $1,876 (3% of AGI, reported on 10.4% of returns)
Here:
$1,876
State:
$3,494
Here:
3.3% of AGI
State:
4.0% of AGI
(% of AGI for various income ranges: 0.5% for AGIs $10k-25k, 0.7% for AGIs $25k-50k, 1.1% for AGIs $50k-75k, 1.3% for AGIs $75k-100k)
Total tax: $2,522 (reported on 69.4% of returns)
42166:
$2,522
State:
$6,162
(% of AGI for various income ranges: 5.8% for AGIs below $10k, 4.0% for AGIs $10k-25k, 5.5% for AGIs $25k-50k, 7.3% for AGIs $50k-75k, 9.8% for AGIs $75k-100k, 15.9% for AGIs over 100k)
Earned income credit: $1,680 (reported on 26.6% of returns)
Here:
$1,680
State:
$1,723
Percentage of individuals using paid preparers for their 2004 taxes: 85.5%
Here:
85%
State:
66%
(% for various income ranges: 84.5% for AGIs below $10k, 84.0% for AGIs $10k-25k, 91.6% for AGIs $25k-50k, 79.8% for AGIs $50k-75k, 102.9% for AGIs $75k-100k)
Household received Food Stamps/SNAP in the past 12 months: 86 Household did not receive Food Stamps/SNAP in the past 12 months: 804
Women who had a birth in the past 12 months: 14 (14 now married, 0 unmarried) Women who did not have a birth in the past 12 months: 550 (243 now married, 306 unmarried)
Housing units in zip code 42166 with a mortgage: 202 (3 second mortgage, 3 both second mortgage and home equity loan) Median monthly owner costs for units with a mortgage: $846 Median monthly owner costs for units without a mortgage: $381
Residents with income below the poverty level in 2022:
This zip code:
27.5%
Whole state:
16.5%
Residents with income below 50% of the poverty level in 2022:
This zip code:
18.7%
Whole state:
9.0%
Median number of rooms in houses and condos:
Here:
5.8
State:
6.4
Median number of rooms in apartments:
Here:
6.9
State:
4.4
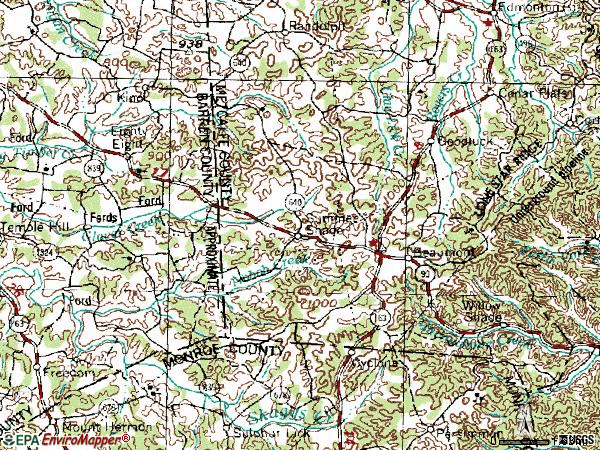
Notable locations in this zip code not listed on our city pages
Churches in zip code 42166 include: Hickory College Church (A), Mount Moriah Church (B), Randolph Church (C), Antioch Church (D), Words Chapel (E), Corinth Church (F), Union Number 2 Church (G). Display/hide their locations on the map
Size of family households: 377 2-persons, 103 3-persons, 133 4-persons, 107 5-persons, 2 7-or-more-persons
Size of nonfamily households: 103 1-person, 57 2-persons
331 married couples with children.
197 single-parent households (76 men, 121 women).
98.4% of residents of 42166 zip code speak English at home.
0.9% of residents speak Spanish at home (100% very well).
0.8% of residents speak other Indo-European language at home (100% very well).
Foreign born population: 0 (0.0%)
:
0.0%
Whole state:
4.0%
40%American
26%German
16%English
5%Irish
2%European
Year of entry for the foreign-born population
02010 or later
02000 to 2009
191990 to 1999
21Before 1990
Facilities with environmental interests located in this zip code:
AIR SYNTHETIC MINOR (AIRS/AFS) (Integrated Compliance Information System) - ICIS-04-2002-5038, FORMAL ENFORCEMENT ACTION CRITERIA AND HAZARDOUS AIR POLLUTANT INVENTORY (Inventory of air pollution sources) National Pollutant Discharge Elimination System NON-MAJOR (Tracking pollutant discharge elimination systems) - permit National Pollutant Discharge Elimination System NON-MAJOR (Tracking pollutant discharge elimination systems) - permit National Pollutant Discharge Elimination System NON-MAJOR (Tracking pollutant discharge elimination systems) - permit TRI REPORTER (Tracking of toxic chemicals releasing facilities) Business SIC classification: GUM AND WOOD CHEMICALS; INDUSTRIAL MACHINERY AND EQUIPMENT; MANAGEMENT SERVICES Business NAICS classification: GUM AND WOOD CHEMICAL MANUFACTURING. Organizations: KINGSFORD MFG CO SUMMER SHADE (CONTACT/OWNER)
, KINGSFORD MANUFACTURING CO (CONTACT/OWNER)
Alternative names: KINGSFORD MANUFACTURING CO, KINGSFORD MFG CO SUMMER SHADE, KINGSFORD MFG. CO.
Housing units lacking complete plumbing facilities: 1.8% Housing units lacking complete kitchen facilities: 4.8%
60.3%Electricity
19.6%Utility gas
9.5%Wood
8.8%Bottled, tank, or LP gas
2.1%Fuel oil, kerosene, etc.
Population in 1990: 2,281. Population change in the 1990s: +373 (+16.4%).
Place of birth for U.S.-born residents:
This state: 1,816
Northeast: 190
Midwest: 103
South: 143
West: 26
69% of the 42166 zip code residents lived in the same house 5 years ago. Out of people who lived in different houses, 46% lived in this county. Out of people who lived in different counties, 50% lived in Kentucky.
93% of the 42166 zip code residents lived in the same house 1 year ago. Out of people who lived in different houses, 23% moved from different county within same state. Out of people who lived in different houses, 88% moved from different state.
Private vs. public school enrollment:
Students in private schools in grades 1 to 8 (elementary and middle school): 8
Here:
4.0%
Kentucky:
17.2%
Students in private schools in grades 9 to 12 (high school): 16
Here:
12.0%
Kentucky:
15.2%
Students in private undergraduate colleges: 24
Here:
100.0%
Kentucky:
19.6%
Occupation by median earnings in the past 12 months ($)
141,062Health diagnosing and treating practitioners and other technical occupations
83,876Sales and related occupations
77,076Architecture and engineering occupations
44,352Installation, maintenance, and repair occupations
33,130Production occupations
29,036Business and financial operations occupations
Top industries in this zip code by the number of employees in 2005:
Accommodation and Food Services: Full-Service Restaurants (20-49 employees: 1 establishment)
Accommodation and Food Services: Limited-Service Restaurants (10-19: 1, 5-9: 1)
Finance and Insurance: Commercial Banking (5-9: 1)
Arts, Entertainment, and Recreation: Golf Courses and Country Clubs (1-4: 1)
Construction: Site Preparation Contractors (1-4: 1)
Fatal accident statistics in 2014:
Fatal accident count: 3
Vehicles involved in fatal accidents: 6
Fatal accidents caused by drunken drivers: 1
Fatalities: 3
Persons involved in fatal accidents: 9
Pedestrians involved in fatal accidents: 0
Fatal accident statistics in 2013:
Fatal accident count: 3
Vehicles involved in fatal accidents: 5
Fatal accidents caused by drunken drivers: 1
Fatalities: 3
Persons involved in fatal accidents: 9
Pedestrians involved in fatal accidents: 0
2002 - 2018 National Fire Incident Reporting System (NFIRS) incidents
According to the data from the years 2002 - 2018 the average number of fire incidents per year is 13. The highest number of fire incidents - 25 took place in 2016, and the least - 2 in 2005. The data has an increasing trend.
When looking into fire subcategories, the most incidents belonged to: Structure Fires (47.0%), and Outside Fires (32.4%).
Fire incident types reported to NFIRS in Zip Code 42166


 Nearest zip codes: 42124, 42130, 42157, 42731, 42167, 42154.


 According to the data from the years 2002 - 2018 the average number of fire incidents per year is 13. The highest number of fire incidents - 25 took place in 2016, and the least - 2 in 2005. The data has an increasing trend.
 When looking into fire subcategories, the most incidents belonged to: Structure Fires (47.0%), and Outside Fires (32.4%).