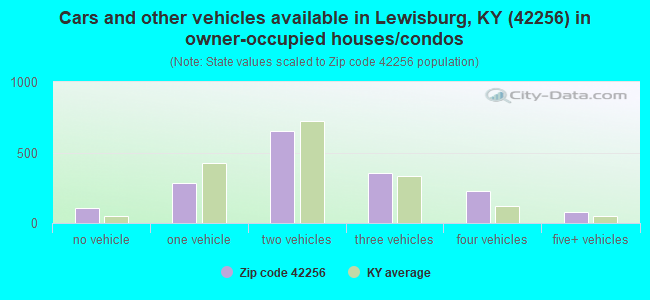
Estimated zip code population in 2022: 4,620 Zip code population in 2010: 5,028 Zip code population in 2000: 5,036
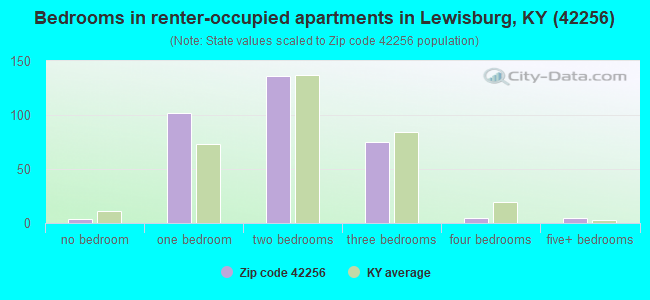
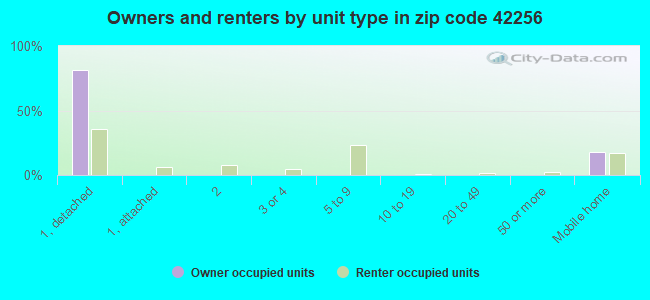
Houses and condos: 2,907 Renter-occupied apartments: 323
% of renters here:
16%
State:
31%
March 2022 cost of living index in zip code 42256: 80.6 (low, U.S. average is 100)
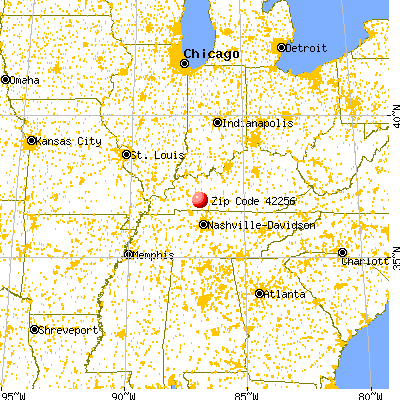
Land area: 191.0 sq. mi. Water area: 2.7 sq. mi.
Population density: 24 people per square mile
(very low).
OSM Map
General Map
Google Map
MSN Map
OSM Map
General Map
Google Map
MSN Map
OSM Map
General Map
Google Map
MSN Map
OSM Map
General Map
Google Map
MSN Map
Please wait while loading the map...
Real estate property taxes paid for housing units in 2022:
This zip code:
0.5% ($667)
Kentucky:
0.7% ($1,456)
Median real estate property taxes paid for housing units with mortgages in 2022: $979 (0.5%) Median real estate property taxes paid for housing units with no mortgage in 2022: $492 (0.6%)
Business Search- 14 Million verified businesses
Males: 2,250
(48.7%)
Females: 2,370
(51.3%)
For population 25 years and over in 42256:
High school or higher: 80.9%
Bachelor's degree or higher: 15.2%
Graduate or professional degree: 4.6%
Unemployed: 2.1%
Mean travel time to work (commute): 30.6 minutes
For population 15 years and over in 42256:
Never married: 20.1%
Now married: 57.8%
Separated: 0.8%
Widowed: 8.0%
Divorced: 13.3%
Zip code 42256 compared to state average:
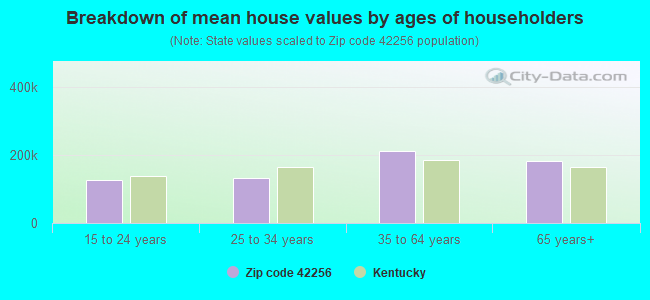
Median house value below state average.
Unemployed percentage below state average.
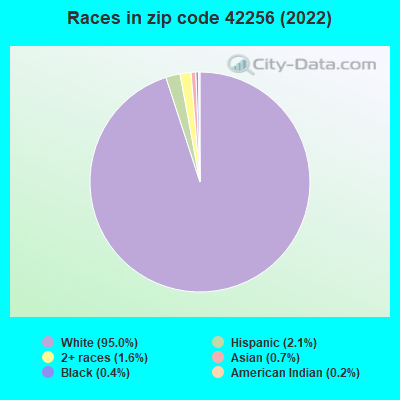
Black race population percentage significantly below state average.
Hispanic race population percentage below state average.
Median age significantly above state average.
Foreign-born population percentage significantly below state average.
Renting percentage below state average.
Length of stay since moving in significantly above state average.
Percentage of population with a bachelor's degree or higher below state average.
Averages for the 2020 tax year for zip code 42256, filed in 2021:
Average Adjusted Gross Income (AGI) in 2020: $50,713 (Individual Income Tax Returns)
Here:
$50,713
State:
$61,342
Salary/wage: $44,012 (reported on 77.8% of returns)
Here:
$44,012
State:
$50,827
(% of AGI for various income ranges: 1188.7% for AGIs below $25k, 3420.2% for AGIs $25k-50k, 6153.5% for AGIs $50k-75k, 9145.3% for AGIs $75k-100k, 14210.8% for AGIs $100k-200k)
Taxable interest for individuals: $1,012 (reported on 24.2% of returns)
This zip code:
$1,012
Kentucky:
$1,441
(% of AGI for various income ranges: 19.6% for AGIs below $25k, 15.1% for AGIs $25k-50k, 75.7% for AGIs $50k-75k, 60.0% for AGIs $75k-100k, 32.3% for AGIs $100k-200k)
Ordinary dividends: $3,592 (reported on 12.1% of returns)
Here:
$3,592
State:
$7,388
(% of AGI for various income ranges: 14.1% for AGIs below $25k, 20.2% for AGIs $25k-50k, 24.3% for AGIs $50k-75k, 94.7% for AGIs $75k-100k, 416.2% for AGIs $100k-200k)
Net capital gain/loss in AGI: +$9,996 (reported on 12.6% of returns)
Here:
+$9,996
State:
+$19,475
(% of AGI for various income ranges: 18.3% for AGIs below $25k, 21.5% for AGIs $25k-50k, 59.1% for AGIs $50k-75k, 142.7% for AGIs $75k-100k, 1586.2% for AGIs $100k-200k)
Profit/loss from business: +$17,074 (reported on 15.0% of returns)
Here:
+$17,074
State:
+$11,386
(% of AGI for various income ranges: 144.8% for AGIs below $25k, 257.1% for AGIs $25k-50k, 230.4% for AGIs $50k-75k, 309.3% for AGIs $75k-100k, 1894.6% for AGIs $100k-200k)
Taxable individual retirement arrangement distribution: $16,200 (reported on 10.1% of returns)
42256:
$16,200
Kentucky:
$18,941
(% of AGI for various income ranges: 47.2% for AGIs below $25k, 121.0% for AGIs $25k-50k, 264.3% for AGIs $50k-75k, 404.7% for AGIs $75k-100k, 1104.6% for AGIs $100k-200k)
Total itemized deductions: $26,083 (reported on 2.9% of returns)
Here:
$26,083
State:
$32,473
(% of AGI for various income ranges: 165.6% for AGIs $25k-50k, 681.5% for AGIs $100k-200k)
Charity contributions: $10,675 (reported on 1.9% of returns)
Here:
$10,675
State:
$13,472
(% of AGI for various income ranges: 328.5% for AGIs $100k-200k)
Taxes paid: $5,850 (reported on 2.9% of returns)
42256:
$5,850
State:
$7,830
(% of AGI for various income ranges: 28.5% for AGIs $25k-50k, 180.0% for AGIs $100k-200k)
Earned income credit: $2,310 (reported on 19.3% of returns)
Here:
$2,310
State:
$2,336
(% of AGI for various income ranges: 101.1% for AGIs below $25k, 92.2% for AGIs $25k-50k)
Percentage of individuals using paid preparers for their 2020 taxes: 94.2%
Here:
94%
State:
94%
(% for various income ranges: 93.4% for AGIs below $25k, 94.2% for AGIs $25k-50k, 93.9% for AGIs $50k-75k, 95.5% for AGIs $75k-100k, 95.2% for AGIs $100k-200k, 100.0% for AGIs over 200k)
Averages for the 2012 tax year for zip code 42256, filed in 2013:
Average Adjusted Gross Income (AGI) in 2012: $40,999 (Individual Income Tax Returns)
Here:
$40,999
State:
$50,814
Salary/wage: $37,843 (reported on 79.1% of returns)
Here:
$37,843
State:
$42,723
(% of AGI for various income ranges: 69.8% for AGIs below $25k, 74.0% for AGIs $25k-50k, 77.6% for AGIs $50k-75k, 77.8% for AGIs $75k-100k, 65.5% for AGIs $100k-200k)
Taxable interest for individuals: $1,056 (reported on 35.3% of returns)
This zip code:
$1,056
Kentucky:
$1,381
(% of AGI for various income ranges: 1.8% for AGIs below $25k, 0.9% for AGIs $25k-50k, 1.1% for AGIs $50k-75k, 0.6% for AGIs $75k-100k, 0.5% for AGIs $100k-200k)
Ordinary dividends: $2,280 (reported on 13.4% of returns)
Here:
$2,280
State:
$6,239
(% of AGI for various income ranges: 1.0% for AGIs below $25k, 0.4% for AGIs $25k-50k, 0.9% for AGIs $50k-75k, 1.1% for AGIs $75k-100k, 0.5% for AGIs $100k-200k)
Net capital gain/loss in AGI: +$5,800 (reported on 16.0% of returns)
Here:
+$5,800
State:
+$11,336
(% of AGI for various income ranges: 1.1% for AGIs below $25k, 0.9% for AGIs $25k-50k, 1.4% for AGIs $50k-75k, 2.5% for AGIs $75k-100k, 5.1% for AGIs $100k-200k)
Profit/loss from business: +$8,281 (reported on 17.1% of returns)
Here:
+$8,281
State:
+$10,862
(% of AGI for various income ranges: 10.0% for AGIs below $25k, 4.6% for AGIs $25k-50k, 1.8% for AGIs $50k-75k, 1.6% for AGIs $75k-100k, 1.7% for AGIs $100k-200k)
Taxable individual retirement arrangement distribution: $11,144 (reported on 8.6% of returns)
42256:
$11,144
Kentucky:
$14,296
(% of AGI for various income ranges: 3.5% for AGIs below $25k, 2.5% for AGIs $25k-50k, 1.9% for AGIs $50k-75k, 4.8% for AGIs $75k-100k)
Total itemized deductions: $17,334 (22% of AGI, reported on 20.3% of returns)
Here:
$17,334
State:
$21,160
Here:
22.2% of AGI
State:
20.0% of AGI
(% of AGI for various income ranges: 5.7% for AGIs below $25k, 6.2% for AGIs $25k-50k, 7.9% for AGIs $50k-75k, 9.9% for AGIs $75k-100k, 12.3% for AGIs $100k-200k)
Charity contributions: $4,924 (reported on 15.5% of returns)
Here:
$4,924
State:
$4,303
(% of AGI for various income ranges: 1.5% for AGIs $25k-50k, 1.3% for AGIs $50k-75k, 2.2% for AGIs $75k-100k, 3.6% for AGIs $100k-200k)
Taxes paid: $5,716 (reported on 19.8% of returns)
42256:
$5,716
State:
$8,496
(% of AGI for various income ranges: 0.5% for AGIs below $25k, 1.4% for AGIs $25k-50k, 2.3% for AGIs $50k-75k, 3.8% for AGIs $75k-100k, 5.1% for AGIs $100k-200k)
Earned income credit: $2,005 (reported on 22.5% of returns)
Here:
$2,005
State:
$2,273
(% of AGI for various income ranges: 6.3% for AGIs below $25k, 1.2% for AGIs $25k-50k)
Percentage of individuals using paid preparers for their 2012 taxes: 68.4%
Here:
68%
State:
60%
(% for various income ranges: 64.2% for AGIs below $25k, 72.9% for AGIs $25k-50k, 70.0% for AGIs $50k-75k, 75.0% for AGIs $75k-100k, 66.7% for AGIs $100k-200k)
Averages for the 2004 tax year for zip code 42256, filed in 2005:
Average Adjusted Gross Income (AGI) in 2004: $33,689 (Individual Income Tax Returns)
Here:
$33,689
State:
$41,540
Salary/wage: $31,161 (reported on 80.2% of returns)
Here:
$31,161
State:
$36,432
(% of AGI for various income ranges: 100.7% for AGIs below $10k, 71.4% for AGIs $10k-25k, 83.4% for AGIs $25k-50k, 85.2% for AGIs $50k-75k, 78.1% for AGIs $75k-100k, 32.6% for AGIs over 100k)
Taxable interest for individuals: $1,374 (reported on 40.6% of returns)
This zip code:
$1,374
Kentucky:
$1,571
(% of AGI for various income ranges: 8.9% for AGIs below $10k, 3.4% for AGIs $10k-25k, 1.7% for AGIs $25k-50k, 1.1% for AGIs $50k-75k, 0.6% for AGIs $75k-100k, 1.0% for AGIs over 100k)
Taxable dividends: $2,000 (reported on 13.2% of returns)
Here:
$2,000
State:
$3,453
(% of AGI for various income ranges: 2.4% for AGIs below $10k, 0.6% for AGIs $10k-25k, 0.3% for AGIs $25k-50k, 0.3% for AGIs $50k-75k, 0.2% for AGIs $75k-100k, 3.2% for AGIs over 100k)
Net capital gain/loss: +$22,529 (reported on 12.6% of returns)
Here:
+$22,529
State:
+$9,663
(% of AGI for various income ranges: 4.1% for AGIs below $10k, 0.8% for AGIs $10k-25k, 1.1% for AGIs $25k-50k, 1.6% for AGIs $50k-75k, 4.3% for AGIs $75k-100k, 45.8% for AGIs over 100k)
Profit/loss from business: +$6,179 (reported on 19.6% of returns)
Here:
+$6,179
State:
+$9,233
(% of AGI for various income ranges: 14.7% for AGIs below $10k, 7.9% for AGIs $10k-25k, 4.0% for AGIs $25k-50k, 1.6% for AGIs $50k-75k, 4.5% for AGIs $75k-100k)
IRA payment deduction: $3,031 (reported on 1.7% of returns)
42256:
$3,031
Kentucky:
$2,955
Total itemized deductions: $14,193 (22% of AGI, reported on 19.6% of returns)
Here:
$14,193
State:
$17,474
Here:
21.7% of AGI
State:
21.0% of AGI
(% of AGI for various income ranges: 11.1% for AGIs below $10k, 5.3% for AGIs $10k-25k, 6.2% for AGIs $25k-50k, 9.1% for AGIs $50k-75k, 13.7% for AGIs $75k-100k, 8.0% for AGIs over 100k)
Charity contributions deductions: $3,659 (6% of AGI, reported on 15.9% of returns)
Here:
$3,659
State:
$3,494
Here:
5.6% of AGI
State:
4.0% of AGI
(% of AGI for various income ranges: 0.8% for AGIs $10k-25k, 1.3% for AGIs $25k-50k, 1.9% for AGIs $50k-75k, 3.3% for AGIs $75k-100k, 1.9% for AGIs over 100k)
Total tax: $4,005 (reported on 70.7% of returns)
42256:
$4,005
State:
$6,162
(% of AGI for various income ranges: 6.4% for AGIs below $10k, 3.9% for AGIs $10k-25k, 6.2% for AGIs $25k-50k, 8.2% for AGIs $50k-75k, 10.7% for AGIs $75k-100k, 15.3% for AGIs over 100k)
Earned income credit: $1,717 (reported on 20.3% of returns)
Here:
$1,717
State:
$1,723
Percentage of individuals using paid preparers for their 2004 taxes: 73.2%
Here:
73%
State:
66%
(% for various income ranges: 72.0% for AGIs below $10k, 70.0% for AGIs $10k-25k, 76.2% for AGIs $25k-50k, 72.6% for AGIs $50k-75k, 76.9% for AGIs $75k-100k, 84.1% for AGIs over 100k)
Household received Food Stamps/SNAP in the past 12 months: 146 Household did not receive Food Stamps/SNAP in the past 12 months: 1,873
Women who had a birth in the past 12 months: 38 (34 now married, 3 unmarried) Women who did not have a birth in the past 12 months: 793 (432 now married, 363 unmarried)
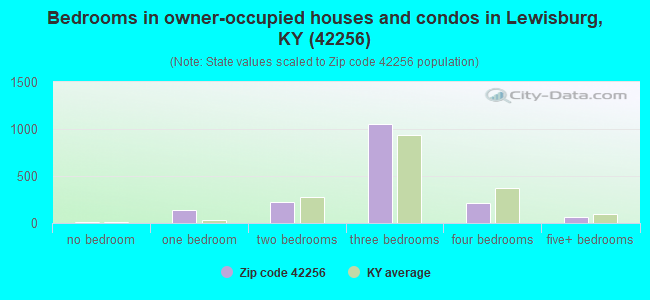
Housing units in zip code 42256 with a mortgage: 764 (20 second mortgage, 13 both second mortgage and home equity loan) Median monthly owner costs for units with a mortgage: $1,105 Median monthly owner costs for units without a mortgage: $373
Residents with income below the poverty level in 2022:
This zip code:
14.8%
Whole state:
16.5%
Residents with income below 50% of the poverty level in 2022:
This zip code:
9.0%
Whole state:
9.0%
Median number of rooms in houses and condos:
Here:
6.4
State:
6.4
Median number of rooms in apartments:
Here:
4.1
State:
4.4
Notable locations in this zip code not listed on our city pages
Notable locations in zip code 42256: Forgys Mill (A), Lewisburg Volunteer Fire Department (B), Second District Fire Department (C). Display/hide their locations on the map
Churches in zip code 42256 include: Greenridge Church (A), Hickory Grove Church (B), Mount Vernon Church of Christ (C), New Harmony Baptist Church (D), Wiley Chapel (E), Antioch Church (F), Bibbtown Church (G), Lewisburg United Methodist Church (H), Sand Spring Church (I). Display/hide their locations on the map
Cemeteries: Blake Cemetery (1), Tunstill Cemetery (2), Carneal Cemetery (3), Vaughn Cemetery (4), Currence Cemetery (5), Duncan Cemetery (6), Oak Grove Cemetery (7). Display/hide their locations on the map
Streams, rivers, and creeks: Duck Lick Creek (A), Flat Rock Branch (B), Alum Lick Creek (C), Big Branch (D), Biggerstaff Creek (E), Boston Lick Creek (F), Dead Creek (G), Dallam Creek (H), Wolf Lick Creek (I). Display/hide their locations on the map
Size of family households: 774 2-persons, 346 3-persons, 149 4-persons, 117 5-persons, 18 6-persons, 10 7-or-more-persons
Size of nonfamily households: 521 1-person, 86 2-persons
664 married couples with children.
203 single-parent households (124 men, 79 women).
95.9% of residents of 42256 zip code speak English at home.
0.3% of residents speak Spanish at home (100% very well).
3.2% of residents speak other Indo-European language at home (45% very well, 54% well, 1% not at all).
0.6% of residents speak Asian or Pacific Island language at home (56% very well, 44% well).
0.1% of residents speak other language at home (100% well).
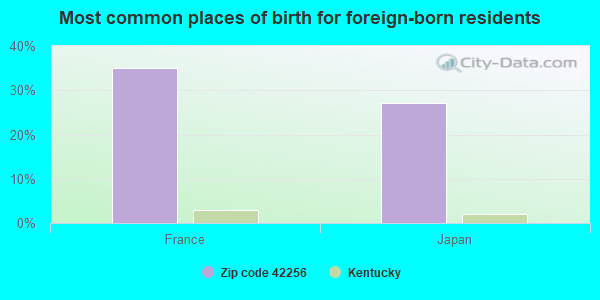
Foreign born population: 36 (0.8%) (53.5% of them are naturalized citizens)
This zip code:
0.8%
Whole state:
4.0%
35%France
27%Japan
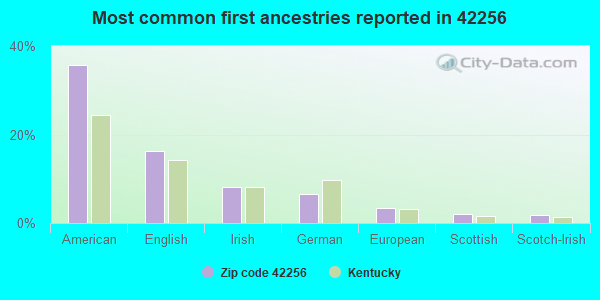
36%American
16%English
8%Irish
7%German
3%European
2%Scottish
2%Scotch-Irish
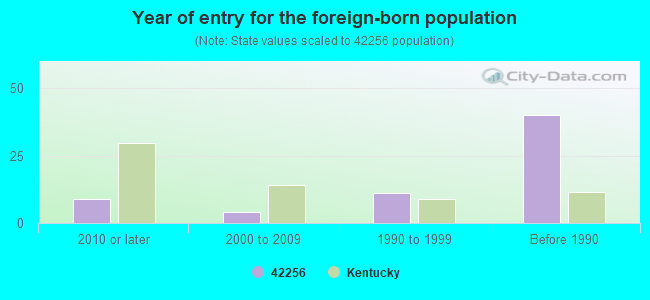
Year of entry for the foreign-born population
92010 or later
42000 to 2009
111990 to 1999
40Before 1990
Facilities with environmental interests located in this zip code:
LEWISBURG ELEMENTARY SCHOOL (750 STACKER ST in LEWISBURG, KY)
(National Center for Education Statistics) - STATE ID-071351014 Organizations: LOGAN COUNTY (SCHOOL DISTRICT)
OIL SPILL (TRANSKENTUCKY TRANSPORTATION RAILROAD, INC) (W OF KY 3170; 1 MILE S OF K 3178 in LEWISBURG, KY)
(Integrated Compliance Information System) - ICIS-04-2004-5054, FORMAL ENFORCEMENT ACTION
KIRBY AND SONS DOZING (4647 HUNTSVILLE QUALITY ROAD in QUALITY, KY)
(Integrated Compliance Information System) - ICIS-04-1989-0043, FORMAL ENFORCEMENT ACTION, ICIS-04-1989-0042, ICIS-04-2000-0878, ICIS-04-2000-0876, ICIS-04-2000-0877, Business SIC classification: CRUDE PETROLEUM AND NATURAL GAS
NELSON CO OF KY (601 N 3RD ST in LEWISBURG, KY)
CRITERIA AND HAZARDOUS AIR POLLUTANT INVENTORY (Inventory of air pollution sources) National Pollutant Discharge Elimination System NON-MAJOR (Tracking pollutant discharge elimination systems) - permit Business SIC classification: WOOD PALLETS AND SKIDS
LEWISBURG STP (460 WOODLAWN AVE in LEWISBURG, KY)
National Pollutant Discharge Elimination System NON-MAJOR (Tracking pollutant discharge elimination systems) - permit Business SIC classification: SEWERAGE SYSTEMS
LEWISBURG WTP (HWY 431 in LEWISBURG, KY)
National Pollutant Discharge Elimination System NON-MAJOR (Tracking pollutant discharge elimination systems) - permit Business SIC classification: WATER SUPPLY
Housing units lacking complete plumbing facilities: 5.9% Housing units lacking complete kitchen facilities: 5.1%
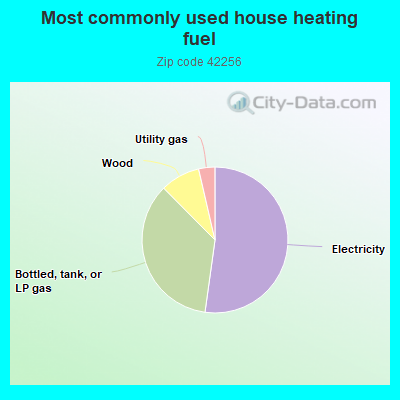
52.2%Electricity
35.4%Bottled, tank, or LP gas
8.8%Wood
3.6%Utility gas
Population in 1990: 3,241. Population change in the 1990s: +1,795 (+55.4%).
Place of birth for U.S.-born residents:
This state: 3,386
Northeast: 43
Midwest: 359
South: 704
West: 45
62% of the 42256 zip code residents lived in the same house 5 years ago. Out of people who lived in different houses, 53% lived in this county. Out of people who lived in different counties, 50% lived in Kentucky.
95% of the 42256 zip code residents lived in the same house 1 year ago. Out of people who lived in different houses, 79% moved from this county. Out of people who lived in different houses, 2% moved from different county within same state. Out of people who lived in different houses, 18% moved from different state.
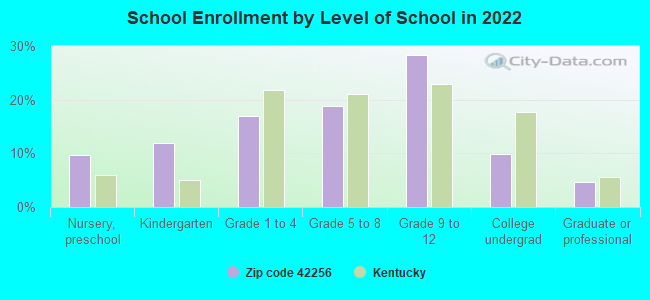
Private vs. public school enrollment:
Students in private schools in grades 1 to 8 (elementary and middle school): 45
Here:
15.3%
Kentucky:
17.2%
Students in private schools in grades 9 to 12 (high school):
Here:
0.0%
Kentucky:
15.2%
Students in private undergraduate colleges:
Here:
0.0%
Kentucky:
19.6%
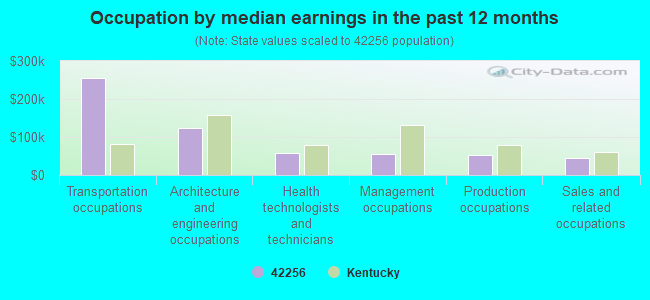
Occupation by median earnings in the past 12 months ($)
254,544Transportation occupations
122,477Architecture and engineering occupations
56,810Health technologists and technicians
55,719Management occupations
51,594Production occupations
45,153Sales and related occupations
Top industries in this zip code by the number of employees in 2005:
Accommodation and Food Services: Full-Service Restaurants (10-19: 1, 1-4: 1)
Other Services (except Public Administration): Religious Organizations (5-9: 1, 1-4: 5)
Finance and Insurance: Commercial Banking (10-19: 1)
Administrative and Support and Waste Management and Remediation Services: Landscaping Services (5-9: 1, 1-4: 1)
Fatal accident statistics in 2014:
Fatal accident count: 1
Vehicles involved in fatal accidents: 1
Fatal accidents caused by drunken drivers: 0
Fatalities: 1
Persons involved in fatal accidents: 1
Pedestrians involved in fatal accidents: 0
Fatal accident statistics in 2013:
Fatal accident count: 2
Vehicles involved in fatal accidents: 2
Fatal accidents caused by drunken drivers: 0
Fatalities: 3
Persons involved in fatal accidents: 4
Pedestrians involved in fatal accidents: 0
2002 - 2018 National Fire Incident Reporting System (NFIRS) incidents
Based on the data from the years 2002 - 2018 the average number of fire incidents per year is 16. The highest number of fire incidents - 43 took place in 2007, and the least - 3 in 2003. The data has a dropping trend.
When looking into fire subcategories, the most incidents belonged to: Outside Fires (43.1%), and Structure Fires (41.6%).
Fire incident types reported to NFIRS in Zip Code 42256


 Nearest zip codes: 42339, 42324, 42276, 42280, 42337, 42323.


 Based on the data from the years 2002 - 2018 the average number of fire incidents per year is 16. The highest number of fire incidents - 43 took place in 2007, and the least - 3 in 2003. The data has a dropping trend.
 When looking into fire subcategories, the most incidents belonged to: Outside Fires (43.1%), and Structure Fires (41.6%).