Estimated zip code population in 2022: 2,424 Zip code population in 2010: 3,555 Zip code population in 2000: 2,721
Houses and condos: 1,105 Renter-occupied apartments: 181
% of renters here:
18%
State:
31%
March 2022 cost of living index in zip code 42406: 80.3 (low, U.S. average is 100)
Land area: 106.0 sq. mi. Water area: 0.9 sq. mi.
Population density: 23 people per square mile
(very low).
OSM Map
General Map
Google Map
MSN Map
OSM Map
General Map
Google Map
MSN Map
OSM Map
General Map
Google Map
MSN Map
OSM Map
General Map
Google Map
MSN Map
Please wait while loading the map...
Real estate property taxes paid for housing units in 2022:
This zip code:
0.7% ($1,257)
Kentucky:
0.7% ($1,456)
Median real estate property taxes paid for housing units with mortgages in 2022: $1,630 (0.8%) Median real estate property taxes paid for housing units with no mortgage in 2022: $600 (0.5%)
Business Search- 14 Million verified businesses
Males: 1,237
(51.1%)
Females: 1,186
(48.9%)
For population 25 years and over in 42406:
High school or higher: 81.3%
Bachelor's degree or higher: 14.9%
Graduate or professional degree: 7.6%
Unemployed: 3.2%
Mean travel time to work (commute): 24.6 minutes
For population 15 years and over in 42406:
Never married: 18.2%
Now married: 69.5%
Separated: 0.9%
Widowed: 4.5%
Divorced: 6.9%
Zip code 42406 compared to state average:
Hispanic race population percentage significantly below state average.
Median age above state average.
Foreign-born population percentage significantly below state average.
Renting percentage below state average.
Length of stay since moving in significantly above state average.
Number of college students significantly below state average.
Percentage of population with a bachelor's degree or higher below state average.
Estimated median house/condo value in 2022: $186,873
42406:
$186,873
Kentucky:
$196,300
According to our research of Kentucky and other state lists, there were 8 registered sex offenders living in 42406 zip code as of May 28, 2024. The ratio of all residents to sex offenders in zip code 42406 is 431 to 1. The ratio of registered sex offenders to all residents in this zip code is near the state average.
Median resident age:
This zip code:
46.2 years
Kentucky median age:
39.4 years
Average household size:
This zip code:
2.4 people
Kentucky:
2.4 people
Averages for the 2020 tax year for zip code 42406, filed in 2021:
Average Adjusted Gross Income (AGI) in 2020: $55,609 (Individual Income Tax Returns)
Here:
$55,609
State:
$61,342
Salary/wage: $47,967 (reported on 85.0% of returns)
Here:
$47,967
State:
$50,827
(% of AGI for various income ranges: 1152.6% for AGIs below $25k, 3468.8% for AGIs $25k-50k, 5914.7% for AGIs $50k-75k, 8617.3% for AGIs $75k-100k, 17955.0% for AGIs $100k-200k)
Taxable interest for individuals: $846 (reported on 23.3% of returns)
This zip code:
$846
Kentucky:
$1,441
(% of AGI for various income ranges: 5.6% for AGIs below $25k, 12.1% for AGIs $25k-50k, 18.2% for AGIs $50k-75k, 41.8% for AGIs $75k-100k, 116.0% for AGIs $100k-200k)
Ordinary dividends: $2,035 (reported on 14.2% of returns)
Here:
$2,035
State:
$7,388
(% of AGI for various income ranges: 11.5% for AGIs below $25k, 4.2% for AGIs $25k-50k, 34.1% for AGIs $50k-75k, 91.8% for AGIs $75k-100k, 146.0% for AGIs $100k-200k)
Net capital gain/loss in AGI: +$6,136 (reported on 11.7% of returns)
Here:
+$6,136
State:
+$19,475
(% of AGI for various income ranges: 48.5% for AGIs below $25k, 48.2% for AGIs $50k-75k, 144.5% for AGIs $75k-100k, 487.0% for AGIs $100k-200k)
Profit/loss from business: +$7,075 (reported on 13.3% of returns)
Here:
+$7,075
State:
+$11,386
(% of AGI for various income ranges: 80.0% for AGIs below $25k, 30.0% for AGIs $25k-50k, 103.5% for AGIs $50k-75k, 200.9% for AGIs $75k-100k, 447.0% for AGIs $100k-200k)
Taxable individual retirement arrangement distribution: $17,175 (reported on 10.0% of returns)
42406:
$17,175
Kentucky:
$18,941
(% of AGI for various income ranges: 127.0% for AGIs below $25k, 210.6% for AGIs $50k-75k, 520.0% for AGIs $75k-100k, 788.0% for AGIs $100k-200k)
Total itemized deductions: $19,000 (reported on 2.5% of returns)
Here:
$19,000
State:
$32,473
(% of AGI for various income ranges: 237.5% for AGIs $25k-50k)
Taxes paid: $6,000 (reported on 1.7% of returns)
42406:
$6,000
State:
$7,830
(% of AGI for various income ranges: 44.4% for AGIs below $25k)
Earned income credit: $2,316 (reported on 15.8% of returns)
Here:
$2,316
State:
$2,336
(% of AGI for various income ranges: 96.3% for AGIs below $25k, 75.0% for AGIs $25k-50k)
Percentage of individuals using paid preparers for their 2020 taxes: 98.3%
Here:
98%
State:
94%
(% for various income ranges: 100.0% for AGIs below $25k, 96.4% for AGIs $25k-50k, 100.0% for AGIs $50k-75k, 93.8% for AGIs $75k-100k, 100.0% for AGIs $100k-200k)
Averages for the 2012 tax year for zip code 42406, filed in 2013:
Average Adjusted Gross Income (AGI) in 2012: $48,379 (Individual Income Tax Returns)
Here:
$48,379
State:
$50,814
Salary/wage: $41,415 (reported on 86.9% of returns)
Here:
$41,415
State:
$42,723
(% of AGI for various income ranges: 76.5% for AGIs below $25k, 76.6% for AGIs $25k-50k, 80.8% for AGIs $50k-75k, 83.3% for AGIs $75k-100k, 61.5% for AGIs $100k-200k)
Taxable interest for individuals: $784 (reported on 25.4% of returns)
This zip code:
$784
Kentucky:
$1,381
(% of AGI for various income ranges: 0.4% for AGIs below $25k, 0.5% for AGIs $25k-50k, 0.3% for AGIs $50k-75k, 0.7% for AGIs $100k-200k)
Ordinary dividends: $1,353 (reported on 13.9% of returns)
Here:
$1,353
State:
$6,239
(% of AGI for various income ranges: 0.5% for AGIs below $25k, 0.3% for AGIs $25k-50k, 0.2% for AGIs $50k-75k, 0.7% for AGIs $100k-200k)
Net capital gain/loss in AGI: +$6,067 (reported on 12.3% of returns)
Here:
+$6,067
State:
+$11,336
(% of AGI for various income ranges: 0.6% for AGIs below $25k, 0.4% for AGIs $25k-50k, 0.4% for AGIs $50k-75k, 4.4% for AGIs $100k-200k)
Profit/loss from business: +$5,071 (reported on 11.5% of returns)
Here:
+$5,071
State:
+$10,862
(% of AGI for various income ranges: 2.8% for AGIs below $25k, 2.3% for AGIs $25k-50k, 0.2% for AGIs $50k-75k, 1.5% for AGIs $75k-100k, 0.6% for AGIs $100k-200k)
Taxable individual retirement arrangement distribution: $11,050 (reported on 9.8% of returns)
42406:
$11,050
Kentucky:
$14,296
(% of AGI for various income ranges: 2.1% for AGIs below $25k, 4.8% for AGIs $25k-50k, 3.8% for AGIs $75k-100k, 1.2% for AGIs $100k-200k)
Total itemized deductions: $17,156 (20% of AGI, reported on 22.1% of returns)
Here:
$17,156
State:
$21,160
Here:
19.6% of AGI
State:
20.0% of AGI
(% of AGI for various income ranges: 5.3% for AGIs below $25k, 5.6% for AGIs $25k-50k, 6.0% for AGIs $50k-75k, 9.1% for AGIs $75k-100k, 10.5% for AGIs $100k-200k)
Charity contributions: $3,532 (reported on 18.0% of returns)
Here:
$3,532
State:
$4,303
(% of AGI for various income ranges: 1.3% for AGIs $25k-50k, 0.7% for AGIs $50k-75k, 1.4% for AGIs $75k-100k, 2.1% for AGIs $100k-200k)
Taxes paid: $5,737 (reported on 22.1% of returns)
42406:
$5,737
State:
$8,496
(% of AGI for various income ranges: 0.6% for AGIs below $25k, 1.1% for AGIs $25k-50k, 2.0% for AGIs $50k-75k, 3.0% for AGIs $75k-100k, 4.4% for AGIs $100k-200k)
Earned income credit: $2,079 (reported on 19.7% of returns)
Here:
$2,079
State:
$2,273
(% of AGI for various income ranges: 6.5% for AGIs below $25k, 1.2% for AGIs $25k-50k)
Percentage of individuals using paid preparers for their 2012 taxes: 68.9%
Here:
69%
State:
60%
(% for various income ranges: 58.7% for AGIs below $25k, 73.3% for AGIs $25k-50k, 70.0% for AGIs $50k-75k, 78.6% for AGIs $75k-100k, 83.3% for AGIs $100k-200k)
Averages for the 2004 tax year for zip code 42406, filed in 2005:
Average Adjusted Gross Income (AGI) in 2004: $37,946 (Individual Income Tax Returns)
Here:
$37,946
State:
$41,540
Salary/wage: $35,231 (reported on 88.9% of returns)
Here:
$35,231
State:
$36,432
(% of AGI for various income ranges: 100.2% for AGIs below $10k, 78.9% for AGIs $10k-25k, 83.3% for AGIs $25k-50k, 87.3% for AGIs $50k-75k, 90.7% for AGIs $75k-100k, 64.7% for AGIs over 100k)
Taxable interest for individuals: $1,037 (reported on 38.1% of returns)
This zip code:
$1,037
Kentucky:
$1,571
(% of AGI for various income ranges: 4.3% for AGIs below $10k, 1.2% for AGIs $10k-25k, 0.7% for AGIs $25k-50k, 0.9% for AGIs $50k-75k, 0.2% for AGIs $75k-100k, 2.0% for AGIs over 100k)
Taxable dividends: $532 (reported on 14.4% of returns)
Here:
$532
State:
$3,453
(% of AGI for various income ranges: 0.6% for AGIs below $10k, 0.2% for AGIs $10k-25k, 0.2% for AGIs $25k-50k, 0.2% for AGIs $50k-75k, 0.0% for AGIs $75k-100k, 0.4% for AGIs over 100k)
Net capital gain/loss: +$2,444 (reported on 9.7% of returns)
Here:
+$2,444
State:
+$9,663
(% of AGI for various income ranges: -1.6% for AGIs below $10k, -0.0% for AGIs $10k-25k, 0.3% for AGIs $25k-50k, 0.3% for AGIs $50k-75k, 3.2% for AGIs over 100k)
Profit/loss from business: +$5,094 (reported on 13.1% of returns)
Here:
+$5,094
State:
+$9,233
(% of AGI for various income ranges: 5.1% for AGIs below $10k, 3.6% for AGIs $10k-25k, 3.9% for AGIs $25k-50k, 0.5% for AGIs $50k-75k, -0.2% for AGIs $75k-100k, 0.5% for AGIs over 100k)
IRA payment deduction: $3,000 (reported on 1.2% of returns)
42406:
$3,000
Kentucky:
$2,955
Total itemized deductions: $13,948 (19% of AGI, reported on 22.1% of returns)
Here:
$13,948
State:
$17,474
Here:
19.3% of AGI
State:
21.0% of AGI
(% of AGI for various income ranges: 4.3% for AGIs $10k-25k, 6.2% for AGIs $25k-50k, 8.9% for AGIs $50k-75k, 11.7% for AGIs $75k-100k, 10.5% for AGIs over 100k)
Charity contributions deductions: $2,649 (4% of AGI, reported on 18.5% of returns)
Here:
$2,649
State:
$3,494
Here:
3.5% of AGI
State:
4.0% of AGI
(% of AGI for various income ranges: 0.6% for AGIs $10k-25k, 0.9% for AGIs $25k-50k, 1.2% for AGIs $50k-75k, 2.2% for AGIs $75k-100k, 2.0% for AGIs over 100k)
Total tax: $4,515 (reported on 76.3% of returns)
42406:
$4,515
State:
$6,162
(% of AGI for various income ranges: 2.6% for AGIs below $10k, 4.3% for AGIs $10k-25k, 7.0% for AGIs $25k-50k, 8.4% for AGIs $50k-75k, 10.2% for AGIs $75k-100k, 17.0% for AGIs over 100k)
Earned income credit: $1,640 (reported on 15.2% of returns)
Here:
$1,640
State:
$1,723
Percentage of individuals using paid preparers for their 2004 taxes: 68.2%
Here:
68%
State:
66%
(% for various income ranges: 55.3% for AGIs below $10k, 65.7% for AGIs $10k-25k, 71.5% for AGIs $25k-50k, 75.5% for AGIs $50k-75k, 75.9% for AGIs $75k-100k, 78.8% for AGIs over 100k)
Household received Food Stamps/SNAP in the past 12 months: 114 Household did not receive Food Stamps/SNAP in the past 12 months: 875
Women who had a birth in the past 12 months: 40 (34 now married, 5 unmarried) Women who did not have a birth in the past 12 months: 360 (178 now married, 183 unmarried)
Housing units in zip code 42406 with a mortgage: 527 (15 second mortgage, 15 both second mortgage and home equity loan) Houses without a mortgage: 20
Median monthly owner costs for units with a mortgage: $1,218 Median monthly owner costs for units without a mortgage: $456
Residents with income below the poverty level in 2022:
This zip code:
14.7%
Whole state:
16.5%
Residents with income below 50% of the poverty level in 2022:
This zip code:
9.1%
Whole state:
9.0%
Median number of rooms in houses and condos:
Here:
6.9
State:
6.4
Median number of rooms in apartments:
Here:
5.6
State:
4.4
Notable locations in this zip code not listed on our city pages
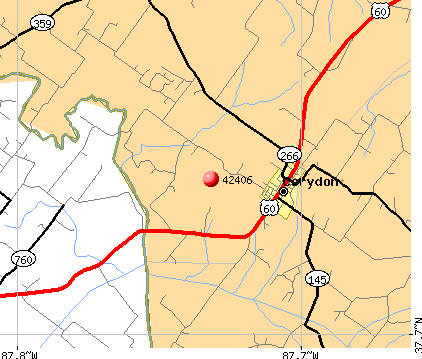
Cemeteries: Burbanks Cemetery (1), Clay Cemetery (2), Hughes Cemetery (3), Corydon Cemetery (4), Dixon Cemetery (5), Duncan Cemetery (6), Morehead Cemetery (7). Display/hide their locations on the map
Lakes and swamps: Burbanks Lakes (A), Hardy Slough Pond (B), Mill Pond (C), Little Swan Pond Slough (D), Grassy Pond Slough (E). Display/hide their locations on the map
Streams, rivers, and creeks: Beaverdam Creek (A), Big Swan Pond Slough (B), North Fork Beaerdam Creek (C), Camp Creek (D), Brushy Slough (E), Opossum Creek (F), Muddy Slough (G), Whitelick Creek (H), Rock Creek (I). Display/hide their locations on the map
Size of family households: 407 2-persons, 156 3-persons, 165 4-persons, 29 5-persons, 11 6-persons
Size of nonfamily households: 160 1-person, 51 2-persons, 5 3-persons
294 married couples with children.
59 single-parent households (35 men, 24 women).
99.3% of residents of 42406 zip code speak English at home.
0.9% of residents speak Spanish at home (75% well, 25% not well).
Foreign born population: 19 (0.8%) (100.0% of them are naturalized citizens)
This zip code:
0.8%
Whole state:
4.0%
105%Fiji
30%American
20%Irish
8%German
7%English
4%European
2%French Canadian
1%African
Year of entry for the foreign-born population
02010 or later
102000 to 2009
51990 to 1999
0Before 1990
Facilities with environmental interests located in this zip code:
A B CHANDLER ELEMENTARY SCHOOL (11215 US 60 W in CORYDON, KY)
(National Center for Education Statistics) - STATE ID-051251030 Organizations: HENDERSON COUNTY (SCHOOL DISTRICT)
CORYDON, CITY OF (212 MAIN ST in CORYDON, KY)
National Pollutant Discharge Elimination System NON-MAJOR (Tracking pollutant discharge elimination systems) - permit Business SIC classification: SEWERAGE SYSTEMS
CORYDON CONOCO STATION (MAIN & SECOND STREETS in CORYDON, KY)
Conditionally Exempt Small Quantity Generators, less than 100 kg/month of hazardous waste (Resource Conservation and Recovery Act (tracking hazardous waste)) - notification Organizations: HOME OIL AND GAS INC (CONTACT/OWNER)
Housing units lacking complete kitchen facilities: 8.2%
48.3%Electricity
29.1%Utility gas
20.3%Bottled, tank, or LP gas
1.5%Other fuel
1.0%Wood
Population in 1990: 3,688.
Place of birth for U.S.-born residents:
This state: 1,602
Northeast: 23
Midwest: 587
South: 118
West: 74
66% of the 42406 zip code residents lived in the same house 5 years ago. Out of people who lived in different houses, 65% lived in this county. Out of people who lived in different counties, 50% lived in Kentucky.
89% of the 42406 zip code residents lived in the same house 1 year ago. Out of people who lived in different houses, 75% moved from this county. Out of people who lived in different houses, 0% moved from different county within same state. Out of people who lived in different houses, 9% moved from different state. Out of people who lived in different houses, 14% moved from abroad.
Private vs. public school enrollment:
Students in private schools in grades 1 to 8 (elementary and middle school): 34
Here:
15.8%
Kentucky:
17.2%
Students in private schools in grades 9 to 12 (high school):
Here:
0.0%
Kentucky:
15.2%
Students in private undergraduate colleges:
Here:
0.0%
Kentucky:
19.6%
Occupation by median earnings in the past 12 months ($)
241,913Personal care and service occupations
89,355Production occupations
65,599Business and financial operations occupations
61,980Architecture and engineering occupations
48,263Construction and extraction occupations
46,385Management occupations
Top industries in this zip code by the number of employees in 2005:
Administrative and Support and Waste Management and Remediation Services: Exterminating and Pest Control Services (10-19 employees: 1 establishment)
Construction: Site Preparation Contractors (5-9: 1, 1-4: 1)
Wholesale Trade: Construction and Mining (except Oil Well) Machinery and Equipment Merchant Wholesalers (5-9: 1)
Construction: New Single-Family Housing Construction (except Operative Builders) (5-9: 1)
Construction: Masonry Contractors (5-9: 1)
Educational Services: Elementary and Secondary Schools (5-9: 1)
Fatal accident statistics in 2011:
Fatal accident count: 1
Vehicles involved in fatal accidents: 2
Fatal accidents caused by drunken drivers: 0
Fatalities: 1
Persons involved in fatal accidents: 3
Pedestrians involved in fatal accidents: 0
Home Mortgage Disclosure Act Aggregated Statistics For Year 2009 (Based on 6 partial tracts)
A) FHA, FSA/RHS & VA Home Purchase Loans
B) Conventional Home Purchase Loans
C) Refinancings
D) Home Improvement Loans
F) Non-occupant Loans on < 5 Family Dwellings (A B C & D)
G) Loans On Manufactured Home Dwelling (A B C & D)
Number
Average Value
Number
Average Value
Number
Average Value
Number
Average Value
Number
Average Value
Number
Average Value
LOANS ORIGINATED
31
$93,012
42
$83,296
171
$100,506
17
$44,596
17
$37,547
13
$33,674
APPLICATIONS APPROVED, NOT ACCEPTED
1
$47,690
4
$44,328
9
$113,857
2
$18,955
1
$56,250
2
$78,870
APPLICATIONS DENIED
12
$85,494
10
$77,403
67
$80,194
10
$9,538
1
$68,480
16
$62,057
APPLICATIONS WITHDRAWN
2
$115,555
4
$73,980
32
$101,798
1
$12,230
0
$0
1
$61,140
FILES CLOSED FOR INCOMPLETENESS
4
$59,000
0
$0
9
$112,362
0
$0
1
$55,030
0
$0
Aggregated Statistics For Year 2008 (Based on 6 partial tracts)
A) FHA, FSA/RHS & VA Home Purchase Loans
B) Conventional Home Purchase Loans
C) Refinancings
D) Home Improvement Loans
F) Non-occupant Loans on < 5 Family Dwellings (A B C & D)
G) Loans On Manufactured Home Dwelling (A B C & D)
Number
Average Value
Number
Average Value
Number
Average Value
Number
Average Value
Number
Average Value
Number
Average Value
LOANS ORIGINATED
28
$89,920
72
$81,044
114
$91,646
20
$30,876
24
$57,472
21
$39,362
APPLICATIONS APPROVED, NOT ACCEPTED
5
$78,504
7
$103,763
17
$65,168
2
$11,615
0
$0
4
$25,372
APPLICATIONS DENIED
4
$84,985
20
$63,402
90
$107,647
29
$34,070
5
$44,020
13
$38,659
APPLICATIONS WITHDRAWN
0
$0
6
$111,275
29
$117,431
5
$39,864
0
$0
4
$58,082
FILES CLOSED FOR INCOMPLETENESS
0
$0
1
$117,390
4
$313,955
0
$0
0
$0
0
$0
Aggregated Statistics For Year 2007 (Based on 6 partial tracts)
A) FHA, FSA/RHS & VA Home Purchase Loans
B) Conventional Home Purchase Loans
C) Refinancings
D) Home Improvement Loans
F) Non-occupant Loans on < 5 Family Dwellings (A B C & D)
G) Loans On Manufactured Home Dwelling (A B C & D)
Number
Average Value
Number
Average Value
Number
Average Value
Number
Average Value
Number
Average Value
Number
Average Value
LOANS ORIGINATED
12
$117,491
64
$88,042
115
$79,248
31
$27,138
6
$60,732
13
$65,467
APPLICATIONS APPROVED, NOT ACCEPTED
1
$42,800
10
$72,267
26
$76,096
10
$30,203
4
$25,985
4
$38,518
APPLICATIONS DENIED
5
$85,352
24
$102,817
88
$88,500
32
$18,915
2
$108,830
12
$44,632
APPLICATIONS WITHDRAWN
2
$171,805
2
$24,455
48
$89,214
2
$53,190
0
$0
2
$84,375
FILES CLOSED FOR INCOMPLETENESS
1
$75,810
2
$172,415
7
$92,759
0
$0
1
$26,900
0
$0
Aggregated Statistics For Year 2006 (Based on 6 partial tracts)
A) FHA, FSA/RHS & VA Home Purchase Loans
B) Conventional Home Purchase Loans
C) Refinancings
D) Home Improvement Loans
F) Non-occupant Loans on < 5 Family Dwellings (A B C & D)
G) Loans On Manufactured Home Dwelling (A B C & D)
Number
Average Value
Number
Average Value
Number
Average Value
Number
Average Value
Number
Average Value
Number
Average Value
LOANS ORIGINATED
11
$95,935
110
$90,421
128
$81,240
43
$27,300
29
$40,437
23
$46,732
APPLICATIONS APPROVED, NOT ACCEPTED
1
$100,270
9
$103,530
15
$54,292
2
$3,055
2
$214,600
4
$72,145
APPLICATIONS DENIED
6
$62,770
34
$77,216
143
$97,311
35
$26,902
10
$41,575
21
$51,125
APPLICATIONS WITHDRAWN
1
$59,920
9
$76,086
54
$128,190
6
$16,915
0
$0
1
$48,910
FILES CLOSED FOR INCOMPLETENESS
1
$100,270
2
$117,390
20
$189,167
1
$244,560
0
$0
0
$0
Aggregated Statistics For Year 2005 (Based on 6 partial tracts)
A) FHA, FSA/RHS & VA Home Purchase Loans
B) Conventional Home Purchase Loans
C) Refinancings
D) Home Improvement Loans
F) Non-occupant Loans on < 5 Family Dwellings (A B C & D)
G) Loans On Manufactured Home Dwelling (A B C & D)
Number
Average Value
Number
Average Value
Number
Average Value
Number
Average Value
Number
Average Value
Number
Average Value
LOANS ORIGINATED
15
$63,015
112
$81,087
127
$67,870
32
$28,201
23
$61,406
29
$44,864
APPLICATIONS APPROVED, NOT ACCEPTED
0
$0
16
$57,242
31
$67,057
4
$6,725
2
$39,740
5
$36,684
APPLICATIONS DENIED
4
$51,052
11
$62,363
128
$79,157
48
$23,437
1
$12,230
20
$45,488
APPLICATIONS WITHDRAWN
1
$59,920
11
$77,259
35
$81,194
5
$60,896
1
$333,820
2
$43,410
FILES CLOSED FOR INCOMPLETENESS
0
$0
6
$50,338
7
$89,789
0
$0
0
$0
0
$0
Aggregated Statistics For Year 2004 (Based on 6 partial tracts)
A) FHA, FSA/RHS & VA Home Purchase Loans
B) Conventional Home Purchase Loans
C) Refinancings
D) Home Improvement Loans
F) Non-occupant Loans on < 5 Family Dwellings (A B C & D)
G) Loans On Manufactured Home Dwelling (A B C & D)
Number
Average Value
Number
Average Value
Number
Average Value
Number
Average Value
Number
Average Value
Number
Average Value
LOANS ORIGINATED
20
$84,924
109
$81,120
150
$78,512
27
$31,385
17
$56,105
27
$66,031
APPLICATIONS APPROVED, NOT ACCEPTED
2
$83,760
17
$102,428
17
$73,368
5
$6,358
0
$0
6
$89,060
APPLICATIONS DENIED
1
$24,460
38
$66,803
133
$69,856
26
$23,703
6
$47,282
34
$51,034
APPLICATIONS WITHDRAWN
2
$105,770
7
$104,461
71
$68,718
5
$49,402
0
$0
5
$66,764
FILES CLOSED FOR INCOMPLETENESS
0
$0
2
$119,225
13
$75,625
1
$24,460
0
$0
0
$0
Aggregated Statistics For Year 2003 (Based on 6 partial tracts)
A) FHA, FSA/RHS & VA Home Purchase Loans
B) Conventional Home Purchase Loans
C) Refinancings
D) Home Improvement Loans
F) Non-occupant Loans on < 5 Family Dwellings (A B C & D)
Number
Average Value
Number
Average Value
Number
Average Value
Number
Average Value
Number
Average Value
LOANS ORIGINATED
10
$81,805
94
$73,979
308
$79,149
42
$21,137
21
$48,446
APPLICATIONS APPROVED, NOT ACCEPTED
0
$0
17
$71,282
29
$83,994
5
$22,744
1
$74,590
APPLICATIONS DENIED
5
$87,308
42
$61,984
122
$72,326
37
$18,408
1
$24,460
APPLICATIONS WITHDRAWN
1
$39,130
18
$92,865
76
$67,881
4
$48,300
4
$44,938
FILES CLOSED FOR INCOMPLETENESS
0
$0
4
$110,662
6
$98,232
0
$0
0
$0
Aggregated Statistics For Year 2002 (Based on 6 partial tracts)
A) FHA, FSA/RHS & VA Home Purchase Loans
B) Conventional Home Purchase Loans
C) Refinancings
D) Home Improvement Loans
F) Non-occupant Loans on < 5 Family Dwellings (A B C & D)
Number
Average Value
Number
Average Value
Number
Average Value
Number
Average Value
Number
Average Value
LOANS ORIGINATED
17
$70,059
83
$76,742
279
$77,343
34
$17,443
17
$66,894
APPLICATIONS APPROVED, NOT ACCEPTED
2
$53,190
11
$48,578
18
$66,711
6
$25,067
0
$0
APPLICATIONS DENIED
2
$81,315
39
$57,816
87
$64,499
22
$10,727
1
$9,780
APPLICATIONS WITHDRAWN
1
$103,940
12
$63,280
34
$63,478
1
$55,030
0
$0
FILES CLOSED FOR INCOMPLETENESS
0
$0
4
$91,098
11
$49,801
0
$0
0
$0
Aggregated Statistics For Year 2001 (Based on 6 partial tracts)
A) FHA, FSA/RHS & VA Home Purchase Loans
B) Conventional Home Purchase Loans
C) Refinancings
D) Home Improvement Loans
F) Non-occupant Loans on < 5 Family Dwellings (A B C & D)
Number
Average Value
Number
Average Value
Number
Average Value
Number
Average Value
Number
Average Value
LOANS ORIGINATED
12
$75,508
84
$57,646
260
$71,792
26
$20,035
11
$54,136
APPLICATIONS APPROVED, NOT ACCEPTED
0
$0
15
$36,032
22
$70,867
4
$25,680
0
$0
APPLICATIONS DENIED
0
$0
62
$49,622
110
$68,188
17
$8,416
6
$43,410
APPLICATIONS WITHDRAWN
1
$102,720
12
$76,731
60
$67,702
0
$0
2
$76,425
FILES CLOSED FOR INCOMPLETENESS
0
$0
1
$86,820
13
$73,368
0
$0
0
$0
Aggregated Statistics For Year 2000 (Based on 6 partial tracts)
A) FHA, FSA/RHS & VA Home Purchase Loans
B) Conventional Home Purchase Loans
C) Refinancings
D) Home Improvement Loans
F) Non-occupant Loans on < 5 Family Dwellings (A B C & D)
Number
Average Value
Number
Average Value
Number
Average Value
Number
Average Value
Number
Average Value
LOANS ORIGINATED
12
$75,916
86
$62,221
75
$64,303
18
$18,614
16
$43,715
APPLICATIONS APPROVED, NOT ACCEPTED
0
$0
10
$52,825
27
$53,124
9
$13,043
2
$58,695
APPLICATIONS DENIED
2
$48,910
56
$46,401
83
$57,855
18
$21,874
2
$58,695
APPLICATIONS WITHDRAWN
2
$94,765
7
$86,294
28
$42,186
1
$51,360
1
$68,480
FILES CLOSED FOR INCOMPLETENESS
0
$0
0
$0
5
$81,684
0
$0
0
$0
Aggregated Statistics For Year 1999 (Based on 3 partial tracts)
A) FHA, FSA/RHS & VA Home Purchase Loans
B) Conventional Home Purchase Loans
C) Refinancings
D) Home Improvement Loans
F) Non-occupant Loans on < 5 Family Dwellings (A B C & D)
Detailed PMIC statistics for the following Tracts:0209.00
2002 - 2018 National Fire Incident Reporting System (NFIRS) incidents
According to the data from the years 2002 - 2018 the average number of fire incidents per year is 12. The highest number of reported fires - 23 took place in 2009, and the least - 3 in 2002. The data has a rising trend.
When looking into fire subcategories, the most incidents belonged to: Outside Fires (48.3%), and Structure Fires (31.3%).
Fire incident types reported to NFIRS in Zip Code 42406

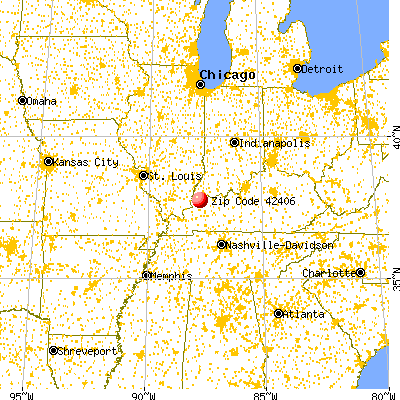


 Nearest zip codes: 42462, 42461, 47712, 42452, 42437, 42409.


 According to the data from the years 2002 - 2018 the average number of fire incidents per year is 12. The highest number of reported fires - 23 took place in 2009, and the least - 3 in 2002. The data has a rising trend.
 When looking into fire subcategories, the most incidents belonged to: Outside Fires (48.3%), and Structure Fires (31.3%).