Estimated zip code population in 2022: 2,411 Zip code population in 2010: 3,118 Zip code population in 2000: 3,083
Houses and condos: 1,140 Renter-occupied apartments: 129
% of renters here:
12%
State:
31%
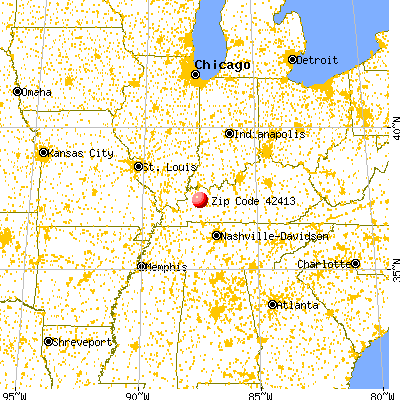
March 2022 cost of living index in zip code 42413: 81.7 (low, U.S. average is 100)
Land area: 52.2 sq. mi. Water area: 0.4 sq. mi.
Population density: 46 people per square mile
(very low).
OSM Map
General Map
Google Map
MSN Map
OSM Map
General Map
Google Map
MSN Map
OSM Map
General Map
Google Map
MSN Map
OSM Map
General Map
Google Map
MSN Map
Please wait while loading the map...
Real estate property taxes paid for housing units in 2022:
This zip code:
0.7% ($1,268)
Kentucky:
0.7% ($1,456)
Median real estate property taxes paid for housing units with mortgages in 2022: $1,431 (0.6%) Median real estate property taxes paid for housing units with no mortgage in 2022: $935 (0.6%)
Business Search- 14 Million verified businesses
Males: 1,251
(51.9%)
Females: 1,159
(48.1%)
For population 25 years and over in 42413:
High school or higher: 89.8%
Bachelor's degree or higher: 23.0%
Graduate or professional degree: 9.9%
Unemployed: 5.5%
Mean travel time to work (commute): 26.2 minutes
For population 15 years and over in 42413:
Never married: 23.5%
Now married: 57.0%
Separated: 0.0%
Widowed: 6.8%
Divorced: 12.7%
Zip code 42413 compared to state average:
Black race population percentage significantly below state average.
Median age significantly above state average.
Foreign-born population percentage significantly below state average.
Renting percentage significantly below state average.
Length of stay since moving in significantly above state average.
Estimated median house/condo value in 2022: $194,526
42413:
$194,526
Kentucky:
$196,300
According to our research of Kentucky and other state lists, there were 3 registered sex offenders living in 42413 zip code as of May 28, 2024. The ratio of all residents to sex offenders in zip code 42413 is 1,179 to 1. The ratio of registered sex offenders to all residents in this zip code is much lower than the state average.
Median resident age:
This zip code:
54.4 years
Kentucky median age:
39.4 years
Average household size:
This zip code:
2.1 people
Kentucky:
2.4 people
Averages for the 2020 tax year for zip code 42413, filed in 2021:
Average Adjusted Gross Income (AGI) in 2020: $74,870 (Individual Income Tax Returns)
Here:
$74,870
State:
$61,342
Salary/wage: $61,664 (reported on 81.2% of returns)
Here:
$61,664
State:
$50,827
(% of AGI for various income ranges: 927.4% for AGIs below $25k, 3382.9% for AGIs $25k-50k, 5530.0% for AGIs $50k-75k, 9448.2% for AGIs $75k-100k, 15087.5% for AGIs $100k-200k, 45663.3% for AGIs over 200k)
Taxable interest for individuals: $1,035 (reported on 30.1% of returns)
This zip code:
$1,035
Kentucky:
$1,441
(% of AGI for various income ranges: 14.4% for AGIs below $25k, 23.8% for AGIs $25k-50k, 12.9% for AGIs $50k-75k, 34.5% for AGIs $75k-100k, 89.4% for AGIs $100k-200k, 396.7% for AGIs over 200k)
Ordinary dividends: $5,008 (reported on 18.8% of returns)
Here:
$5,008
State:
$7,388
(% of AGI for various income ranges: 40.0% for AGIs below $25k, 45.4% for AGIs $25k-50k, 107.9% for AGIs $50k-75k, 85.5% for AGIs $75k-100k, 173.1% for AGIs $100k-200k, 1710.0% for AGIs over 200k)
Net capital gain/loss in AGI: +$8,148 (reported on 18.8% of returns)
Here:
+$8,148
State:
+$19,475
(% of AGI for various income ranges: 11.5% for AGIs below $25k, 52.9% for AGIs $25k-50k, 51.4% for AGIs $50k-75k, 171.8% for AGIs $75k-100k, 618.8% for AGIs $100k-200k, 2093.3% for AGIs over 200k)
Profit/loss from business: +$17,070 (reported on 15.0% of returns)
Here:
+$17,070
State:
+$11,386
(% of AGI for various income ranges: 70.4% for AGIs below $25k, 47.1% for AGIs $25k-50k, 242.9% for AGIs $50k-75k, 133.6% for AGIs $75k-100k, 1640.0% for AGIs $100k-200k)
Taxable individual retirement arrangement distribution: $21,350 (reported on 12.0% of returns)
42413:
$21,350
Kentucky:
$18,941
(% of AGI for various income ranges: 90.7% for AGIs below $25k, 232.9% for AGIs $25k-50k, 222.1% for AGIs $50k-75k, 559.1% for AGIs $75k-100k, 1053.8% for AGIs $100k-200k)
Total itemized deductions: $37,133 (reported on 6.8% of returns)
Here:
$37,133
State:
$32,473
(% of AGI for various income ranges: 687.9% for AGIs $50k-75k, 633.8% for AGIs $100k-200k, 4550.0% for AGIs over 200k)
Charity contributions: $19,071 (reported on 5.3% of returns)
Here:
$19,071
State:
$13,472
(% of AGI for various income ranges: 34.4% for AGIs below $25k, 217.5% for AGIs $100k-200k, 2980.0% for AGIs over 200k)
Taxes paid: $8,900 (reported on 6.0% of returns)
42413:
$8,900
State:
$7,830
(% of AGI for various income ranges: 130.7% for AGIs $50k-75k, 180.0% for AGIs $100k-200k, 803.3% for AGIs over 200k)
Earned income credit: $2,081 (reported on 12.0% of returns)
Here:
$2,081
State:
$2,336
(% of AGI for various income ranges: 66.3% for AGIs below $25k, 64.2% for AGIs $25k-50k)
Percentage of individuals using paid preparers for their 2020 taxes: 96.2%
Here:
96%
State:
94%
(% for various income ranges: 94.4% for AGIs below $25k, 96.7% for AGIs $25k-50k, 94.4% for AGIs $50k-75k, 100.0% for AGIs $75k-100k, 96.2% for AGIs $100k-200k, 100.0% for AGIs over 200k)
Averages for the 2012 tax year for zip code 42413, filed in 2013:
Average Adjusted Gross Income (AGI) in 2012: $73,239 (Individual Income Tax Returns)
Here:
$73,239
State:
$50,814
Salary/wage: $61,352 (reported on 85.2% of returns)
Here:
$61,352
State:
$42,723
(% of AGI for various income ranges: 72.6% for AGIs below $25k, 74.4% for AGIs $25k-50k, 75.8% for AGIs $50k-75k, 85.7% for AGIs $75k-100k, 82.0% for AGIs $100k-200k, 49.5% for AGIs over 200k)
Taxable interest for individuals: $1,383 (reported on 37.7% of returns)
This zip code:
$1,383
Kentucky:
$1,381
(% of AGI for various income ranges: 0.8% for AGIs below $25k, 0.7% for AGIs $25k-50k, 0.6% for AGIs $50k-75k, 0.5% for AGIs $75k-100k, 0.3% for AGIs $100k-200k, 1.2% for AGIs over 200k)
Ordinary dividends: $3,574 (reported on 18.9% of returns)
Here:
$3,574
State:
$6,239
(% of AGI for various income ranges: 2.4% for AGIs below $25k, 0.6% for AGIs $25k-50k, 0.7% for AGIs $50k-75k, 0.4% for AGIs $75k-100k, 0.3% for AGIs $100k-200k, 1.8% for AGIs over 200k)
Net capital gain/loss in AGI: +$12,900 (reported on 15.6% of returns)
Here:
+$12,900
State:
+$11,336
(% of AGI for various income ranges: 0.2% for AGIs below $25k, 0.4% for AGIs $75k-100k, 1.7% for AGIs $100k-200k, 7.8% for AGIs over 200k)
Profit/loss from business: +$20,194 (reported on 14.8% of returns)
Here:
+$20,194
State:
+$10,862
(% of AGI for various income ranges: 6.8% for AGIs below $25k, 3.6% for AGIs $25k-50k, 2.3% for AGIs $50k-75k, 0.9% for AGIs $75k-100k, 11.0% for AGIs $100k-200k)
Taxable individual retirement arrangement distribution: $13,592 (reported on 10.7% of returns)
42413:
$13,592
Kentucky:
$14,296
(% of AGI for various income ranges: 3.2% for AGIs below $25k, 2.6% for AGIs $25k-50k, 3.0% for AGIs $50k-75k, 2.7% for AGIs $75k-100k, 2.6% for AGIs $100k-200k)
Total itemized deductions: $27,349 (21% of AGI, reported on 36.9% of returns)
Here:
$27,349
State:
$21,160
Here:
20.6% of AGI
State:
20.0% of AGI
(% of AGI for various income ranges: 10.0% for AGIs $25k-50k, 10.2% for AGIs $50k-75k, 12.2% for AGIs $75k-100k, 13.4% for AGIs $100k-200k, 20.5% for AGIs over 200k)
Charity contributions: $5,833 (reported on 32.0% of returns)
Here:
$5,833
State:
$4,303
(% of AGI for various income ranges: 1.5% for AGIs $25k-50k, 2.4% for AGIs $50k-75k, 2.5% for AGIs $75k-100k, 3.0% for AGIs $100k-200k, 3.0% for AGIs over 200k)
Taxes paid: $12,122 (reported on 36.9% of returns)
42413:
$12,122
State:
$8,496
(% of AGI for various income ranges: 2.2% for AGIs $25k-50k, 3.0% for AGIs $50k-75k, 4.6% for AGIs $75k-100k, 6.2% for AGIs $100k-200k, 10.9% for AGIs over 200k)
Earned income credit: $2,213 (reported on 12.3% of returns)
Here:
$2,213
State:
$2,273
(% of AGI for various income ranges: 5.3% for AGIs below $25k, 1.3% for AGIs $25k-50k)
Percentage of individuals using paid preparers for their 2012 taxes: 70.5%
Here:
70%
State:
60%
(% for various income ranges: 64.9% for AGIs below $25k, 69.6% for AGIs $25k-50k, 71.4% for AGIs $50k-75k, 70.6% for AGIs $75k-100k, 77.8% for AGIs $100k-200k, 83.3% for AGIs over 200k)
Averages for the 2004 tax year for zip code 42413, filed in 2005:
Average Adjusted Gross Income (AGI) in 2004: $53,216 (Individual Income Tax Returns)
Here:
$53,216
State:
$41,540
Salary/wage: $47,297 (reported on 88.0% of returns)
Here:
$47,297
State:
$36,432
(% of AGI for various income ranges: 100.9% for AGIs below $10k, 73.3% for AGIs $10k-25k, 79.5% for AGIs $25k-50k, 90.4% for AGIs $50k-75k, 87.3% for AGIs $75k-100k, 65.0% for AGIs over 100k)
Taxable interest for individuals: $937 (reported on 46.5% of returns)
This zip code:
$937
Kentucky:
$1,571
(% of AGI for various income ranges: 4.4% for AGIs below $10k, 2.5% for AGIs $10k-25k, 1.1% for AGIs $25k-50k, 0.5% for AGIs $50k-75k, 0.5% for AGIs $75k-100k, 0.7% for AGIs over 100k)
Taxable dividends: $2,063 (reported on 23.5% of returns)
Here:
$2,063
State:
$3,453
(% of AGI for various income ranges: 3.6% for AGIs below $10k, 1.2% for AGIs $10k-25k, 0.2% for AGIs $25k-50k, 0.6% for AGIs $50k-75k, 0.4% for AGIs $75k-100k, 1.6% for AGIs over 100k)
Net capital gain/loss: +$2,790 (reported on 19.4% of returns)
Here:
+$2,790
State:
+$9,663
(% of AGI for various income ranges: -1.2% for AGIs below $10k, 0.9% for AGIs $10k-25k, 0.2% for AGIs $25k-50k, 0.1% for AGIs $50k-75k, 1.4% for AGIs $75k-100k, 1.9% for AGIs over 100k)
Profit/loss from business: +$14,832 (reported on 16.0% of returns)
Here:
+$14,832
State:
+$9,233
(% of AGI for various income ranges: 6.8% for AGIs below $10k, 4.7% for AGIs $10k-25k, 3.7% for AGIs $25k-50k, 1.7% for AGIs $50k-75k, 2.0% for AGIs $75k-100k, 7.8% for AGIs over 100k)
IRA payment deduction: $3,167 (reported on 3.1% of returns)
42413:
$3,167
Kentucky:
$2,955
Self-employed pension: $12,500 (reported on 0.9% of returns)
Here:
$12,500
Kentucky:
$14,996
Total itemized deductions: $17,324 (19% of AGI, reported on 37.7% of returns)
Here:
$17,324
State:
$17,474
Here:
18.6% of AGI
State:
21.0% of AGI
(% of AGI for various income ranges: 10.0% for AGIs $10k-25k, 10.2% for AGIs $25k-50k, 11.4% for AGIs $50k-75k, 13.8% for AGIs $75k-100k, 13.8% for AGIs over 100k)
Charity contributions deductions: $4,338 (4% of AGI, reported on 32.6% of returns)
Here:
$4,338
State:
$3,494
Here:
4.4% of AGI
State:
4.0% of AGI
(% of AGI for various income ranges: 2.0% for AGIs $10k-25k, 1.9% for AGIs $25k-50k, 2.3% for AGIs $50k-75k, 2.6% for AGIs $75k-100k, 3.4% for AGIs over 100k)
Total tax: $8,352 (reported on 79.8% of returns)
42413:
$8,352
State:
$6,162
(% of AGI for various income ranges: 3.1% for AGIs below $10k, 4.1% for AGIs $10k-25k, 6.2% for AGIs $25k-50k, 8.4% for AGIs $50k-75k, 10.3% for AGIs $75k-100k, 20.9% for AGIs over 100k)
Earned income credit: $1,364 (reported on 12.1% of returns)
Here:
$1,364
State:
$1,723
Percentage of individuals using paid preparers for their 2004 taxes: 70.7%
Here:
71%
State:
66%
(% for various income ranges: 67.1% for AGIs below $10k, 68.4% for AGIs $10k-25k, 72.5% for AGIs $25k-50k, 70.8% for AGIs $50k-75k, 71.7% for AGIs $75k-100k, 76.4% for AGIs over 100k)
Household received Food Stamps/SNAP in the past 12 months: 55 Household did not receive Food Stamps/SNAP in the past 12 months: 1,037
Women who had a birth in the past 12 months: 10 (10 now married, 0 unmarried) Women who did not have a birth in the past 12 months: 414 (175 now married, 239 unmarried)
Housing units in zip code 42413 with a mortgage: 476 (31 second mortgage, 24 both second mortgage and home equity loan) Median monthly owner costs for units with a mortgage: $1,293 Median monthly owner costs for units without a mortgage: $440
Residents with income below the poverty level in 2022:
This zip code:
8.3%
Whole state:
16.5%
Residents with income below 50% of the poverty level in 2022:
This zip code:
5.5%
Whole state:
9.0%
Median number of rooms in houses and condos:
Here:
6.1
State:
6.4
Median number of rooms in apartments:
Here:
5.9
State:
4.4
Notable locations in this zip code not listed on our city pages
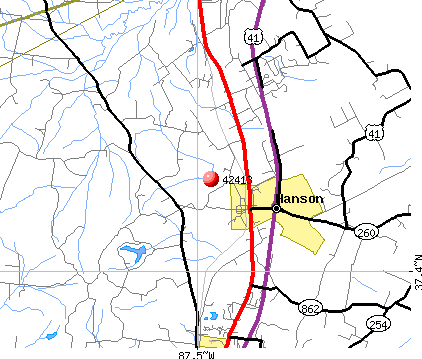
Churches in zip code 42413 include: Old Salem Holiness Church (A), Olive Branch Baptist Church (B), Providence Church (C), Antioch Primitive Baptist Church (D), Emberry Church (E). Display/hide their locations on the map
Cemeteries: Brown Cemetery (1), Utterback Cemetery (2), Crabtree Cemetery (3), Gooch Cemetery (4), Bailey Cemetery (5), East Lawn Cemetery (6), West Lawn Cemetery (7). Display/hide their locations on the map
In group quarters: 88 (-1 institutionalized population)
Size of family households: 450 2-persons, 99 3-persons, 151 4-persons, 17 5-persons, 22 6-persons
Size of nonfamily households: 309 1-person, 32 2-persons, 9 4-persons
290 married couples with children.
25 single-parent households (4 men, 21 women).
100.0% of residents of 42413 zip code speak English at home.
0.6% of residents speak other Indo-European language at home (77% very well, 8% well, 15% not well).
0.1% of residents speak other language at home (100% very well).
Foreign born population: 12 (0.5%) (68.6% of them are naturalized citizens)
This zip code:
0.5%
Whole state:
4.0%
42%Romania
33%Japan
8%Georgia
32%American
23%English
8%German
5%Irish
4%European
3%Polish
2%Scottish
Year of entry for the foreign-born population
22010 or later
02000 to 2009
01990 to 1999
9Before 1990
Facilities with environmental interests located in this zip code:
OTTO CORUM WELL#1-A (723-767 N. BRANSON ROAD in HANSON, KY)
CARHARTT DISTRIBUTION CENTER (380 ESTILL BAKER RD in HANSON, KY)
National Pollutant Discharge Elimination System NON-MAJOR (Tracking pollutant discharge elimination systems) - permit Business SIC classification: MANAGEMENT SERVICES
Housing units lacking complete plumbing facilities: 3.3% Housing units lacking complete kitchen facilities: 3.3%
63.8%Electricity
28.5%Utility gas
6.2%Bottled, tank, or LP gas
1.6%Wood
Population in 1990: 2,329. Population change in the 1990s: +754 (+32.4%).
Place of birth for U.S.-born residents:
This state: 1,667
Northeast: 22
Midwest: 405
South: 183
West: 125
63% of the 42413 zip code residents lived in the same house 5 years ago. Out of people who lived in different houses, 59% lived in this county. Out of people who lived in different counties, 50% lived in Kentucky.
98% of the 42413 zip code residents lived in the same house 1 year ago. Out of people who lived in different houses, 50% moved from this county. Out of people who lived in different houses, 46% moved from different county within same state. Out of people who lived in different houses, 9% moved from different state.
Private vs. public school enrollment:
Students in private schools in grades 1 to 8 (elementary and middle school): 1
Here:
0.9%
Kentucky:
17.2%
Students in private schools in grades 9 to 12 (high school):
Here:
0.0%
Kentucky:
15.2%
Students in private undergraduate colleges:
Here:
0.0%
Kentucky:
19.6%
Occupation by median earnings in the past 12 months ($)
99,514Architecture and engineering occupations
91,340Computer and mathematical occupations
84,760Installation, maintenance, and repair occupations
65,217Health diagnosing and treating practitioners and other technical occupations
61,427Business and financial operations occupations
54,559Health technologists and technicians
Top industries in this zip code by the number of employees in 2005:
Construction: New Single-Family Housing Construction (except Operative Builders) (10-19 employees: 1 establishment)
Other Services (except Public Administration): Religious Organizations (1-4: 5)
Accommodation and Food Services: Full-Service Restaurants (1-4: 2)
People in group quarters in 2010:
119 people in nursing facilities/skilled-nursing facilities
People in group quarters in 2000:
6 people in homes for the mentally retarded
2 people in hospitals or wards for drug/alcohol abuse
Fatal accident statistics in 2014:
Fatal accident count: 1
Vehicles involved in fatal accidents: 1
Fatal accidents caused by drunken drivers: 0
Fatalities: 1
Persons involved in fatal accidents: 1
Pedestrians involved in fatal accidents: 0
Fatal accident statistics in 2013:
Fatal accident count: 1
Vehicles involved in fatal accidents: 2
Fatal accidents caused by drunken drivers: 0
Fatalities: 1
Persons involved in fatal accidents: 3
Pedestrians involved in fatal accidents: 0
2002 - 2018 National Fire Incident Reporting System (NFIRS) incidents
Based on the data from the years 2002 - 2018 the average number of fire incidents per year is 21. The highest number of fires - 42 took place in 2012, and the least - 2 in 2002. The data has a rising trend.
When looking into fire subcategories, the most incidents belonged to: Outside Fires (48.7%), and Structure Fires (30.3%).
Fire incident types reported to NFIRS in Zip Code 42413


 Nearest zip codes: 42456, 42431, 42436, 42455, 42410, 42322.


 Based on the data from the years 2002 - 2018 the average number of fire incidents per year is 21. The highest number of fires - 42 took place in 2012, and the least - 2 in 2002. The data has a rising trend.
 When looking into fire subcategories, the most incidents belonged to: Outside Fires (48.7%), and Structure Fires (30.3%).