Estimated zip code population in 2022: 3,153 Zip code population in 2010: 3,504 Zip code population in 2000: 3,522
Houses and condos: 1,314 Renter-occupied apartments: 255
% of renters here:
22%
State:
31%
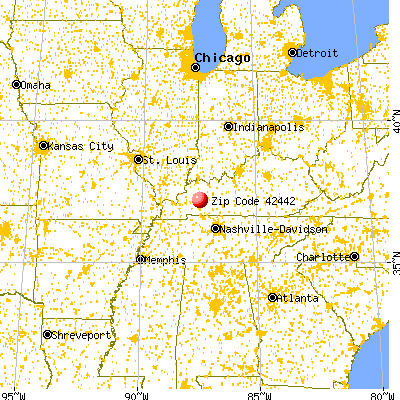
March 2022 cost of living index in zip code 42442: 81.0 (low, U.S. average is 100)
Land area: 61.1 sq. mi. Water area: 0.8 sq. mi.
Population density: 52 people per square mile
(very low).
OSM Map
General Map
Google Map
MSN Map
OSM Map
General Map
Google Map
MSN Map
OSM Map
General Map
Google Map
MSN Map
OSM Map
General Map
Google Map
MSN Map
Please wait while loading the map...
Real estate property taxes paid for housing units in 2022:
This zip code:
0.7% ($869)
Kentucky:
0.7% ($1,456)
Median real estate property taxes paid for housing units with mortgages in 2022: $1,184 (0.7%) Median real estate property taxes paid for housing units with no mortgage in 2022: $484 (0.8%)
Business Search- 14 Million verified businesses
Males: 1,436
(45.5%)
Females: 1,717
(54.5%)
For population 25 years and over in 42442:
High school or higher: 84.2%
Bachelor's degree or higher: 11.5%
Graduate or professional degree: 7.5%
Unemployed: 5.6%
Mean travel time to work (commute): 24.1 minutes
For population 15 years and over in 42442:
Never married: 21.9%
Now married: 58.9%
Separated: 3.7%
Widowed: 6.2%
Divorced: 9.3%
Zip code 42442 compared to state average:
Median house value below state average.
Black race population percentage significantly below state average.
Hispanic race population percentage below state average.
Foreign-born population percentage significantly below state average.
Length of stay since moving in significantly above state average.
Number of college students significantly below state average.
Percentage of population with a bachelor's degree or higher significantly below state average.
Estimated median house/condo value in 2022: $121,218
42442:
$121,218
Kentucky:
$196,300
According to our research of Kentucky and other state lists, there were 6 registered sex offenders living in 42442 zip code as of May 28, 2024. The ratio of all residents to sex offenders in zip code 42442 is 486 to 1. The ratio of registered sex offenders to all residents in this zip code is near the state average.
Median resident age:
This zip code:
43.1 years
Kentucky median age:
39.4 years
Average household size:
This zip code:
2.7 people
Kentucky:
2.4 people
Averages for the 2020 tax year for zip code 42442, filed in 2021:
Average Adjusted Gross Income (AGI) in 2020: $48,577 (Individual Income Tax Returns)
Here:
$48,577
State:
$61,342
Salary/wage: $43,884 (reported on 84.7% of returns)
Here:
$43,884
State:
$50,827
(% of AGI for various income ranges: 1042.9% for AGIs below $25k, 3504.2% for AGIs $25k-50k, 6103.1% for AGIs $50k-75k, 8089.1% for AGIs $75k-100k, 14395.0% for AGIs $100k-200k)
Taxable interest for individuals: $510 (reported on 16.9% of returns)
This zip code:
$510
Kentucky:
$1,441
(% of AGI for various income ranges: 6.2% for AGIs below $25k, 3.5% for AGIs $25k-50k, 13.1% for AGIs $50k-75k, 6.4% for AGIs $75k-100k, 48.0% for AGIs $100k-200k)
Ordinary dividends: $933 (reported on 7.6% of returns)
Here:
$933
State:
$7,388
(% of AGI for various income ranges: 6.2% for AGIs below $25k, 8.5% for AGIs $50k-75k, 52.0% for AGIs $100k-200k)
Net capital gain/loss in AGI: +$3,011 (reported on 7.6% of returns)
Here:
+$3,011
State:
+$19,475
(% of AGI for various income ranges: 49.2% for AGIs $50k-75k, 209.0% for AGIs $100k-200k)
Profit/loss from business: +$6,129 (reported on 11.9% of returns)
Here:
+$6,129
State:
+$11,386
(% of AGI for various income ranges: 89.4% for AGIs below $25k, 106.2% for AGIs $25k-50k, 139.1% for AGIs $75k-100k, 125.0% for AGIs $100k-200k)
Taxable individual retirement arrangement distribution: $15,575 (reported on 6.8% of returns)
42442:
$15,575
Kentucky:
$18,941
(% of AGI for various income ranges: 201.5% for AGIs $25k-50k, 656.4% for AGIs $75k-100k)
Total itemized deductions: $21,367 (reported on 2.5% of returns)
Here:
$21,367
State:
$32,473
(% of AGI for various income ranges: 493.1% for AGIs $50k-75k)
Charity contributions: $10,200 (reported on 1.7% of returns)
Here:
$10,200
State:
$13,472
(% of AGI for various income ranges: 156.9% for AGIs $50k-75k)
Taxes paid: $6,167 (reported on 2.5% of returns)
42442:
$6,167
State:
$7,830
(% of AGI for various income ranges: 142.3% for AGIs $50k-75k)
Earned income credit: $2,270 (reported on 22.9% of returns)
Here:
$2,270
State:
$2,336
(% of AGI for various income ranges: 120.6% for AGIs below $25k, 78.1% for AGIs $25k-50k)
Percentage of individuals using paid preparers for their 2020 taxes: 97.5%
Here:
97%
State:
94%
(% for various income ranges: 97.7% for AGIs below $25k, 96.7% for AGIs $25k-50k, 94.1% for AGIs $50k-75k, 100.0% for AGIs $75k-100k, 100.0% for AGIs $100k-200k)
Averages for the 2012 tax year for zip code 42442, filed in 2013:
Average Adjusted Gross Income (AGI) in 2012: $41,568 (Individual Income Tax Returns)
Here:
$41,568
State:
$50,814
Salary/wage: $39,294 (reported on 89.0% of returns)
Here:
$39,294
State:
$42,723
(% of AGI for various income ranges: 76.6% for AGIs below $25k, 81.7% for AGIs $25k-50k, 83.5% for AGIs $50k-75k, 90.1% for AGIs $75k-100k, 86.2% for AGIs $100k-200k)
Taxable interest for individuals: $645 (reported on 18.6% of returns)
This zip code:
$645
Kentucky:
$1,381
(% of AGI for various income ranges: 0.9% for AGIs below $25k, 0.4% for AGIs $25k-50k, 0.2% for AGIs $50k-75k, 0.2% for AGIs $75k-100k)
Ordinary dividends: $644 (reported on 7.6% of returns)
Here:
$644
State:
$6,239
(% of AGI for various income ranges: 0.4% for AGIs below $25k, 0.2% for AGIs $50k-75k, 0.1% for AGIs $75k-100k)
Net capital gain/loss in AGI: +$1,257 (reported on 5.9% of returns)
Here:
+$1,257
State:
+$11,336
Profit/loss from business: +$5,843 (reported on 11.9% of returns)
Here:
+$5,843
State:
+$10,862
(% of AGI for various income ranges: 5.4% for AGIs below $25k, 2.8% for AGIs $25k-50k, 1.5% for AGIs $50k-75k)
Taxable individual retirement arrangement distribution: $8,988 (reported on 6.8% of returns)
42442:
$8,988
Kentucky:
$14,296
(% of AGI for various income ranges: 1.7% for AGIs below $25k, 2.6% for AGIs $25k-50k, 3.6% for AGIs $75k-100k)
Total itemized deductions: $16,257 (21% of AGI, reported on 17.8% of returns)
Here:
$16,257
State:
$21,160
Here:
21.3% of AGI
State:
20.0% of AGI
(% of AGI for various income ranges: 4.4% for AGIs below $25k, 5.1% for AGIs $25k-50k, 6.4% for AGIs $50k-75k, 7.8% for AGIs $75k-100k, 10.2% for AGIs $100k-200k)
Charity contributions: $4,833 (reported on 15.3% of returns)
Here:
$4,833
State:
$4,303
(% of AGI for various income ranges: 1.7% for AGIs $25k-50k, 1.6% for AGIs $50k-75k, 2.2% for AGIs $75k-100k, 2.7% for AGIs $100k-200k)
Taxes paid: $5,548 (reported on 17.8% of returns)
42442:
$5,548
State:
$8,496
(% of AGI for various income ranges: 0.6% for AGIs below $25k, 1.2% for AGIs $25k-50k, 2.0% for AGIs $50k-75k, 2.8% for AGIs $75k-100k, 4.6% for AGIs $100k-200k)
Earned income credit: $2,260 (reported on 25.4% of returns)
Here:
$2,260
State:
$2,273
(% of AGI for various income ranges: 8.2% for AGIs below $25k, 1.3% for AGIs $25k-50k)
Percentage of individuals using paid preparers for their 2012 taxes: 72.0%
Here:
72%
State:
60%
(% for various income ranges: 67.9% for AGIs below $25k, 74.1% for AGIs $25k-50k, 73.7% for AGIs $50k-75k, 81.8% for AGIs $75k-100k, 75.0% for AGIs $100k-200k)
Averages for the 2004 tax year for zip code 42442, filed in 2005:
Average Adjusted Gross Income (AGI) in 2004: $32,282 (Individual Income Tax Returns)
Here:
$32,282
State:
$41,540
Salary/wage: $31,459 (reported on 87.4% of returns)
Here:
$31,459
State:
$36,432
(% of AGI for various income ranges: 108.2% for AGIs below $10k, 78.7% for AGIs $10k-25k, 86.7% for AGIs $25k-50k, 88.0% for AGIs $50k-75k, 88.6% for AGIs $75k-100k, 66.2% for AGIs over 100k)
Taxable interest for individuals: $826 (reported on 27.3% of returns)
This zip code:
$826
Kentucky:
$1,571
(% of AGI for various income ranges: 3.7% for AGIs below $10k, 1.3% for AGIs $10k-25k, 0.7% for AGIs $25k-50k, 0.5% for AGIs $50k-75k, 0.2% for AGIs $75k-100k, 0.1% for AGIs over 100k)
Taxable dividends: $647 (reported on 10.8% of returns)
Here:
$647
State:
$3,453
(% of AGI for various income ranges: 1.4% for AGIs below $10k, 0.3% for AGIs $10k-25k, 0.1% for AGIs $25k-50k, 0.2% for AGIs $50k-75k, 0.5% for AGIs $75k-100k)
Net capital gain/loss: +$602 (reported on 6.6% of returns)
Here:
+$602
State:
+$9,663
(% of AGI for various income ranges: -1.5% for AGIs below $10k, 0.1% for AGIs $10k-25k, 0.2% for AGIs $25k-50k, 0.3% for AGIs $50k-75k, -0.0% for AGIs $75k-100k)
Profit/loss from business: +$5,917 (reported on 14.3% of returns)
Here:
+$5,917
State:
+$9,233
(% of AGI for various income ranges: 10.2% for AGIs below $10k, 4.6% for AGIs $10k-25k, 2.8% for AGIs $25k-50k, 2.0% for AGIs $50k-75k, 1.6% for AGIs $75k-100k)
IRA payment deduction: $2,357 (reported on 2.2% of returns)
42442:
$2,357
Kentucky:
$2,955
Total itemized deductions: $14,029 (24% of AGI, reported on 19.1% of returns)
Here:
$14,029
State:
$17,474
Here:
23.5% of AGI
State:
21.0% of AGI
(% of AGI for various income ranges: 4.7% for AGIs $10k-25k, 6.9% for AGIs $25k-50k, 10.0% for AGIs $50k-75k, 11.4% for AGIs $75k-100k, 10.9% for AGIs over 100k)
Charity contributions deductions: $3,894 (6% of AGI, reported on 16.5% of returns)
Here:
$3,894
State:
$3,494
Here:
6.4% of AGI
State:
4.0% of AGI
(% of AGI for various income ranges: 0.8% for AGIs $10k-25k, 1.5% for AGIs $25k-50k, 2.3% for AGIs $50k-75k, 3.0% for AGIs $75k-100k, 3.7% for AGIs over 100k)
Total tax: $3,503 (reported on 70.3% of returns)
42442:
$3,503
State:
$6,162
(% of AGI for various income ranges: 4.2% for AGIs below $10k, 3.4% for AGIs $10k-25k, 5.7% for AGIs $25k-50k, 7.9% for AGIs $50k-75k, 11.1% for AGIs $75k-100k, 16.6% for AGIs over 100k)
Earned income credit: $1,717 (reported on 23.8% of returns)
Here:
$1,717
State:
$1,723
Percentage of individuals using paid preparers for their 2004 taxes: 73.1%
Here:
73%
State:
66%
(% for various income ranges: 69.2% for AGIs below $10k, 73.9% for AGIs $10k-25k, 70.8% for AGIs $25k-50k, 77.2% for AGIs $50k-75k, 77.8% for AGIs $75k-100k, 90.9% for AGIs over 100k)
Household received Food Stamps/SNAP in the past 12 months: 137 Household did not receive Food Stamps/SNAP in the past 12 months: 1,007
Women who had a birth in the past 12 months: 40 (11 now married, 30 unmarried) Women who did not have a birth in the past 12 months: 568 (332 now married, 238 unmarried)
Housing units in zip code 42442 with a mortgage: 480 (59 second mortgage, 60 both second mortgage and home equity loan) Median monthly owner costs for units with a mortgage: $1,073 Median monthly owner costs for units without a mortgage: $345
Residents with income below the poverty level in 2022:
This zip code:
14.9%
Whole state:
16.5%
Residents with income below 50% of the poverty level in 2022:
This zip code:
9.4%
Whole state:
9.0%
Median number of rooms in houses and condos:
Here:
6.5
State:
6.4
Median number of rooms in apartments:
Here:
5.2
State:
4.4
Notable locations in this zip code not listed on our city pages
Churches in zip code 42442 include: Gilliland Church (A), Good Hope Church (B), Lake Grove Church (C), McIntosh Chapel (D), Pleasant Hill Church (E), Cedar Hill Church (F), Cranor Church (G), Crossroads Union Church (H). Display/hide their locations on the map
Cemeteries: Terry Cemetery (1), Campbell Cemetery (2), McIntosh Church Cemetery (3), Fox Cemetery (4), Furgerson Cemetery (5), Gamblin Cemetery (6). Display/hide their locations on the map
349 married couples with children.
176 single-parent households (68 men, 108 women).
98.9% of residents of 42442 zip code speak English at home.
0.9% of residents speak other Indo-European language at home (100% very well).
Foreign born population: 43 (1.4%) (100.0% of them are naturalized citizens)
This zip code:
1.4%
Whole state:
4.0%
71%Honduras
14%Dominica
10%Romania
27%English
17%American
12%Irish
9%European
3%Dutch
1%German
1%Polish
Year of entry for the foreign-born population
52010 or later
42000 to 2009
131990 to 1999
75Before 1990
Facilities with environmental interests located in this zip code:
NORTONVILLE STP (410 OLD NORTONVILLE - WHITE in NORTONVILLE, KY)
National Pollutant Discharge Elimination System NON-MAJOR (Tracking pollutant discharge elimination systems) - permit National Pollutant Discharge Elimination System NON-MAJOR (Tracking pollutant discharge elimination systems) - permit Business SIC classification: SEWERAGE SYSTEMS; MANAGEMENT SERVICES
OIL SPILL (ROBINSON ENGINEERING & OIL - DUNCAN TANK BATTERY) (SECTION 15-1-25 in NORTONVILLE, KY)
(Integrated Compliance Information System) - ICIS-04-2004-5031, FORMAL ENFORCEMENT ACTION
CENTENNIAL RESOURCES INC (2407 MANNINGTON LOOP in NORTONVILLE, KY)
National Pollutant Discharge Elimination System NON-MAJOR (Tracking pollutant discharge elimination systems) - permit Business SIC classification: BITUMINOUS COAL AND LIGNITE SURFACE MINING Organizations: CHAROLAIS CORP (CONTACT/OWNER)
Alternative names: CHAROLAIS CORP
MORTONS GAP, CITY OF (102 S MAIN ST in NORTONVILLE, KY)
National Pollutant Discharge Elimination System NON-MAJOR (Tracking pollutant discharge elimination systems) - permit Business SIC classification: SEWERAGE SYSTEMS
PLEASANT HILL LIVESTOCK CO INC (7050 GRAPEVINE RD in NORTONVILLE, KY)
National Pollutant Discharge Elimination System NON-MAJOR (Tracking pollutant discharge elimination systems) - permit Business SIC classification: HOGS
BLUE EAGLE CO. INC (UNION CR CHURCH RD in NORTONVILLE, KY)
AIR MINOR (AIRS/AFS)
CENTENNIAL RESOURCES (MCINTOSH CHAPEL ROAD in NORTONVILLE, KY)
CRITERIA AND HAZARDOUS AIR POLLUTANT INVENTORY (Inventory of air pollution sources) Business SIC classification: BITUMINOUS COAL UNDERGROUND MINING
LEWIS SUPER STATION (HWY 41 & 62 in NORTONVILLE, KY)
ENFORCEMENT/COMPLIANCE ACTIVITY (Integrated Compliance Information System)
Housing units lacking complete plumbing facilities: 3.8% Housing units lacking complete kitchen facilities: 2.5%
67.2%Electricity
24.9%Utility gas
4.8%Wood
2.4%Bottled, tank, or LP gas
1.1%Fuel oil, kerosene, etc.
Population in 1990: 2,811. Population change in the 1990s: +711 (+25.3%).
Place of birth for U.S.-born residents:
This state: 2,310
Northeast: 31
Midwest: 355
South: 297
West: 44
69% of the 42442 zip code residents lived in the same house 5 years ago. Out of people who lived in different houses, 76% lived in this county. Out of people who lived in different counties, 50% lived in Kentucky.
92% of the 42442 zip code residents lived in the same house 1 year ago. Out of people who lived in different houses, 38% moved from this county. Out of people who lived in different houses, 45% moved from different county within same state. Out of people who lived in different houses, 16% moved from different state.
Private vs. public school enrollment:
Students in private schools in grades 1 to 8 (elementary and middle school): 28
Here:
6.6%
Kentucky:
17.2%
Students in private schools in grades 9 to 12 (high school): 2
Here:
1.7%
Kentucky:
15.2%
Students in private undergraduate colleges: 4
Here:
26.9%
Kentucky:
19.6%
Occupation by median earnings in the past 12 months ($)
110,087Health diagnosing and treating practitioners and other technical occupations
98,943Business and financial operations occupations
86,136Construction and extraction occupations
78,291Management occupations
67,808Installation, maintenance, and repair occupations
56,649Transportation occupations
Companies with federal contracts located in this zip code:
DONOVAN COMMERCIAL INDUSTRIES, (400 WILLIAMS MINE RD in NORTONVILLE, KY; small business) : $124,079 in 5 contractsfrom 2000 to 2006
Contracts for Bulk Explosives, Pyrotechnics, Demolition Materials by Navy, Army Signed by year:2000: $99,200; 2001: $0; 2002: $0; 2003: $0; 2004: $0; 2005: $17,079; 2006: $7,800.
Biggest contracts:
$99,200 with Navy for Bulk Explosives. Signed on 2000-09-01. Completion date: 2000-11-06.
$7,800, same as above.Signed on 2006-01-24. Completion date: 2006-03-28.
$7,140 with Navy for Pyrotechnics. Signed on 2005-10-11. Completion date: 2005-11-04.
$5,942 with Army for Demolition Materials. Signed on 2005-07-06. Completion date: 2005-08-03.
Top industries in this zip code by the number of employees in 2005:
Accommodation and Food Services: Full-Service Restaurants (10-19: 1, 5-9: 2)
Wholesale Trade: Industrial Machinery and Equipment Merchant Wholesalers (10-19: 1)
Other Services (except Public Administration): Religious Organizations (5-9: 1, 1-4: 3)
People in group quarters in 2000:
5 people in other noninstitutional group quarters
Fatal accident statistics in 2013:
Fatal accident count: 1
Vehicles involved in fatal accidents: 1
Fatal accidents caused by drunken drivers: 0
Fatalities: 1
Persons involved in fatal accidents: 1
Pedestrians involved in fatal accidents: 1
Fatal accident statistics in 2012:
Fatal accident count: 2
Vehicles involved in fatal accidents: 3
Fatal accidents caused by drunken drivers: 0
Fatalities: 3
Persons involved in fatal accidents: 7
Pedestrians involved in fatal accidents: 0
2002 - 2018 National Fire Incident Reporting System (NFIRS) incidents
Based on the data from the years 2002 - 2018 the average number of fire incidents per year is 22. The highest number of fires - 46 took place in 2015, and the least - 5 in 2003. The data has a rising trend.
When looking into fire subcategories, the most incidents belonged to: Structure Fires (41.0%), and Outside Fires (37.3%).
Fire incident types reported to NFIRS in Zip Code 42442


 Nearest zip codes: 42440, 42453, 42410, 42217, 42464, 42431.


 Based on the data from the years 2002 - 2018 the average number of fire incidents per year is 22. The highest number of fires - 46 took place in 2015, and the least - 5 in 2003. The data has a rising trend.
 When looking into fire subcategories, the most incidents belonged to: Structure Fires (41.0%), and Outside Fires (37.3%).