Estimated zip code population in 2022: 3,074 Zip code population in 2010: 2,914 Zip code population in 2000: 2,910
Houses and condos: 2,185 Renter-occupied apartments: 231
% of renters here:
20%
State:
31%
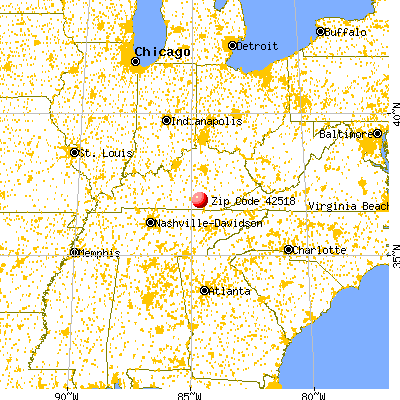
March 2022 cost of living index in zip code 42518: 81.9 (low, U.S. average is 100)
Land area: 25.4 sq. mi. Water area: 2.1 sq. mi.
Population density: 121 people per square mile
(very low).
OSM Map
General Map
Google Map
MSN Map
OSM Map
General Map
Google Map
MSN Map
OSM Map
General Map
Google Map
MSN Map
OSM Map
General Map
Google Map
MSN Map
Please wait while loading the map...
Real estate property taxes paid for housing units in 2022:
This zip code:
0.6% ($871)
Kentucky:
0.7% ($1,456)
Median real estate property taxes paid for housing units with mortgages in 2022: $947 (0.7%) Median real estate property taxes paid for housing units with no mortgage in 2022: $691 (0.6%)
Business Search- 14 Million verified businesses
Males: 1,447
(47.1%)
Females: 1,627
(52.9%)
For population 25 years and over in 42518:
High school or higher: 88.2%
Bachelor's degree or higher: 20.9%
Graduate or professional degree: 5.6%
Unemployed: 3.4%
Mean travel time to work (commute): 22.7 minutes
For population 15 years and over in 42518:
Never married: 33.9%
Now married: 38.0%
Separated: 1.6%
Widowed: 12.3%
Divorced: 14.2%
Zip code 42518 compared to state average:
Black race population percentage significantly below state average.
Foreign-born population percentage significantly below state average.
Renting percentage below state average.
Length of stay since moving in above state average.
Averages for the 2020 tax year for zip code 42518, filed in 2021:
Average Adjusted Gross Income (AGI) in 2020: $46,437 (Individual Income Tax Returns)
Here:
$46,437
State:
$61,342
Salary/wage: $38,964 (reported on 75.6% of returns)
Here:
$38,964
State:
$50,827
(% of AGI for various income ranges: 1117.8% for AGIs below $25k, 3015.9% for AGIs $25k-50k, 5790.0% for AGIs $50k-75k, 8576.7% for AGIs $75k-100k, 12830.0% for AGIs $100k-200k)
Taxable interest for individuals: $934 (reported on 22.8% of returns)
This zip code:
$934
Kentucky:
$1,441
(% of AGI for various income ranges: 14.9% for AGIs below $25k, 15.9% for AGIs $25k-50k, 42.3% for AGIs $50k-75k, 13.3% for AGIs $75k-100k, 178.3% for AGIs $100k-200k)
Ordinary dividends: $4,245 (reported on 8.7% of returns)
Here:
$4,245
State:
$7,388
(% of AGI for various income ranges: 4.9% for AGIs below $25k, 7.2% for AGIs $25k-50k, 30.8% for AGIs $50k-75k, 63.3% for AGIs $75k-100k, 583.3% for AGIs $100k-200k)
Net capital gain/loss in AGI: +$4,064 (reported on 8.7% of returns)
Here:
+$4,064
State:
+$19,475
(% of AGI for various income ranges: 40.8% for AGIs below $25k, 92.3% for AGIs $50k-75k, 293.3% for AGIs $100k-200k)
Profit/loss from business: +$10,483 (reported on 14.2% of returns)
Here:
+$10,483
State:
+$11,386
(% of AGI for various income ranges: 126.8% for AGIs below $25k, 166.9% for AGIs $25k-50k, 144.6% for AGIs $50k-75k, 1243.3% for AGIs $100k-200k)
Taxable individual retirement arrangement distribution: $15,475 (reported on 6.3% of returns)
42518:
$15,475
Kentucky:
$18,941
(% of AGI for various income ranges: 44.1% for AGIs below $25k, 177.6% for AGIs $25k-50k, 933.3% for AGIs $75k-100k)
Total itemized deductions: $27,500 (reported on 2.4% of returns)
Here:
$27,500
State:
$32,473
(% of AGI for various income ranges: 634.6% for AGIs $50k-75k)
Charity contributions: $10,150 (reported on 1.6% of returns)
Here:
$10,150
State:
$13,472
(% of AGI for various income ranges: 70.0% for AGIs $25k-50k)
Taxes paid: $5,867 (reported on 2.4% of returns)
42518:
$5,867
State:
$7,830
(% of AGI for various income ranges: 135.4% for AGIs $50k-75k)
Earned income credit: $2,237 (reported on 23.6% of returns)
Here:
$2,237
State:
$2,336
(% of AGI for various income ranges: 118.1% for AGIs below $25k, 80.7% for AGIs $25k-50k)
Percentage of individuals using paid preparers for their 2020 taxes: 95.3%
Here:
95%
State:
94%
(% for various income ranges: 96.2% for AGIs below $25k, 100.0% for AGIs $25k-50k, 94.4% for AGIs $50k-75k, 90.0% for AGIs $75k-100k, 90.0% for AGIs $100k-200k, 66.7% for AGIs over 200k)
Averages for the 2012 tax year for zip code 42518, filed in 2013:
Average Adjusted Gross Income (AGI) in 2012: $37,249 (Individual Income Tax Returns)
Here:
$37,249
State:
$50,814
Salary/wage: $31,521 (reported on 81.7% of returns)
Here:
$31,521
State:
$42,723
(% of AGI for various income ranges: 74.7% for AGIs below $25k, 75.0% for AGIs $25k-50k, 74.6% for AGIs $50k-75k, 60.8% for AGIs $75k-100k, 59.3% for AGIs $100k-200k)
Taxable interest for individuals: $821 (reported on 22.2% of returns)
This zip code:
$821
Kentucky:
$1,381
(% of AGI for various income ranges: 0.7% for AGIs below $25k, 0.6% for AGIs $25k-50k, 0.4% for AGIs $50k-75k, 0.3% for AGIs $75k-100k, 0.4% for AGIs $100k-200k)
Ordinary dividends: $2,913 (reported on 11.9% of returns)
Here:
$2,913
State:
$6,239
(% of AGI for various income ranges: 0.6% for AGIs below $25k, 0.4% for AGIs $25k-50k, 0.6% for AGIs $50k-75k, 2.5% for AGIs $100k-200k)
Net capital gain/loss in AGI: +$1,362 (reported on 6.3% of returns)
Here:
+$1,362
State:
+$11,336
(% of AGI for various income ranges: 0.4% for AGIs below $25k, 0.8% for AGIs $100k-200k)
Profit/loss from business: +$7,371 (reported on 13.5% of returns)
Here:
+$7,371
State:
+$10,862
(% of AGI for various income ranges: 7.2% for AGIs below $25k, 2.9% for AGIs $25k-50k, 3.6% for AGIs $50k-75k)
Taxable individual retirement arrangement distribution: $11,830 (reported on 7.9% of returns)
42518:
$11,830
Kentucky:
$14,296
(% of AGI for various income ranges: 1.3% for AGIs below $25k, 4.1% for AGIs $25k-50k, 8.9% for AGIs $75k-100k)
Total itemized deductions: $20,064 (24% of AGI, reported on 17.5% of returns)
Here:
$20,064
State:
$21,160
Here:
23.6% of AGI
State:
20.0% of AGI
(% of AGI for various income ranges: 4.8% for AGIs below $25k, 6.8% for AGIs $25k-50k, 8.5% for AGIs $50k-75k, 13.4% for AGIs $75k-100k, 14.0% for AGIs $100k-200k)
Charity contributions: $4,131 (reported on 12.7% of returns)
Here:
$4,131
State:
$4,303
(% of AGI for various income ranges: 0.7% for AGIs below $25k, 0.6% for AGIs $25k-50k, 1.5% for AGIs $50k-75k, 1.9% for AGIs $75k-100k, 2.6% for AGIs $100k-200k)
Taxes paid: $5,709 (reported on 17.5% of returns)
42518:
$5,709
State:
$8,496
(% of AGI for various income ranges: 0.7% for AGIs below $25k, 1.3% for AGIs $25k-50k, 2.3% for AGIs $50k-75k, 3.8% for AGIs $75k-100k, 5.3% for AGIs $100k-200k)
Earned income credit: $2,283 (reported on 28.6% of returns)
Here:
$2,283
State:
$2,273
(% of AGI for various income ranges: 8.0% for AGIs below $25k, 1.4% for AGIs $25k-50k)
Percentage of individuals using paid preparers for their 2012 taxes: 66.7%
Here:
67%
State:
60%
(% for various income ranges: 65.6% for AGIs below $25k, 62.2% for AGIs $25k-50k, 78.6% for AGIs $50k-75k, 71.4% for AGIs $75k-100k, 71.4% for AGIs $100k-200k)
Averages for the 2004 tax year for zip code 42518, filed in 2005:
Average Adjusted Gross Income (AGI) in 2004: $31,986 (Individual Income Tax Returns)
Here:
$31,986
State:
$41,540
Salary/wage: $27,747 (reported on 84.4% of returns)
Here:
$27,747
State:
$36,432
(% of AGI for various income ranges: 122.3% for AGIs below $10k, 75.9% for AGIs $10k-25k, 79.6% for AGIs $25k-50k, 74.2% for AGIs $50k-75k, 83.2% for AGIs $75k-100k, 47.9% for AGIs over 100k)
Taxable interest for individuals: $1,296 (reported on 33.8% of returns)
This zip code:
$1,296
Kentucky:
$1,571
(% of AGI for various income ranges: 5.4% for AGIs below $10k, 2.1% for AGIs $10k-25k, 1.4% for AGIs $25k-50k, 0.5% for AGIs $50k-75k, 0.3% for AGIs $75k-100k, 1.6% for AGIs over 100k)
Taxable dividends: $1,486 (reported on 13.3% of returns)
Here:
$1,486
State:
$3,453
(% of AGI for various income ranges: 0.4% for AGIs below $10k, 1.0% for AGIs $10k-25k, 0.3% for AGIs $25k-50k, 0.3% for AGIs $50k-75k, 0.1% for AGIs $75k-100k, 1.4% for AGIs over 100k)
Net capital gain/loss: +$7,017 (reported on 10.6% of returns)
Here:
+$7,017
State:
+$9,663
(% of AGI for various income ranges: 0.1% for AGIs below $10k, 0.5% for AGIs $10k-25k, 0.7% for AGIs $25k-50k, 2.4% for AGIs $50k-75k, 8.1% for AGIs over 100k)
Profit/loss from business: +$5,000 (reported on 15.4% of returns)
Here:
+$5,000
State:
+$9,233
(% of AGI for various income ranges: 6.7% for AGIs below $10k, 5.2% for AGIs $10k-25k, 3.2% for AGIs $25k-50k, 1.7% for AGIs $50k-75k, 0.4% for AGIs $75k-100k)
IRA payment deduction: $2,000 (reported on 1.1% of returns)
42518:
$2,000
Kentucky:
$2,955
Total itemized deductions: $14,511 (22% of AGI, reported on 19.9% of returns)
Here:
$14,511
State:
$17,474
Here:
21.8% of AGI
State:
21.0% of AGI
(% of AGI for various income ranges: 6.8% for AGIs $10k-25k, 7.7% for AGIs $25k-50k, 9.4% for AGIs $50k-75k, 11.8% for AGIs $75k-100k, 12.3% for AGIs over 100k)
Charity contributions deductions: $3,450 (5% of AGI, reported on 15.4% of returns)
Here:
$3,450
State:
$3,494
Here:
4.9% of AGI
State:
4.0% of AGI
(% of AGI for various income ranges: 1.0% for AGIs $10k-25k, 1.5% for AGIs $25k-50k, 1.9% for AGIs $50k-75k, 1.3% for AGIs $75k-100k, 2.7% for AGIs over 100k)
Total tax: $4,180 (reported on 68.0% of returns)
42518:
$4,180
State:
$6,162
(% of AGI for various income ranges: 2.2% for AGIs below $10k, 3.7% for AGIs $10k-25k, 6.3% for AGIs $25k-50k, 8.5% for AGIs $50k-75k, 11.2% for AGIs $75k-100k, 17.6% for AGIs over 100k)
Earned income credit: $1,602 (reported on 25.6% of returns)
Here:
$1,602
State:
$1,723
Percentage of individuals using paid preparers for their 2004 taxes: 75.4%
Here:
75%
State:
66%
(% for various income ranges: 73.5% for AGIs below $10k, 76.4% for AGIs $10k-25k, 75.5% for AGIs $25k-50k, 74.2% for AGIs $50k-75k, 67.4% for AGIs $75k-100k, 90.0% for AGIs over 100k)
Household received Food Stamps/SNAP in the past 12 months: 199 Household did not receive Food Stamps/SNAP in the past 12 months: 937
Women who had a birth in the past 12 months: 205 (0 now married, 214 unmarried) Women who did not have a birth in the past 12 months: 506 (143 now married, 361 unmarried)
Housing units in zip code 42518 with a mortgage: 505 (61 second mortgage, 37 both second mortgage and home equity loan) Median monthly owner costs for units with a mortgage: $1,214 Median monthly owner costs for units without a mortgage: $375
Residents with income below the poverty level in 2022:
This zip code:
32.7%
Whole state:
16.5%
Residents with income below 50% of the poverty level in 2022:
This zip code:
7.0%
Whole state:
9.0%
Median number of rooms in houses and condos:
Here:
6.6
State:
6.4
Median number of rooms in apartments:
Here:
4.9
State:
4.4
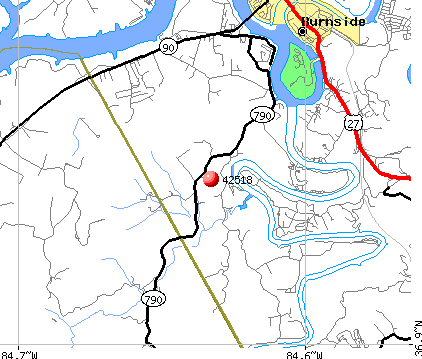
Notable locations in this zip code not listed on our city pages
Notable locations in zip code 42518: Woodson Bend Resort (A), The Thrashing Rock (B), A Salt Spring and Deer Lick (C), Buffalo Wallow (D), Bronston Fire Department (E). Display/hide their locations on the map
Churches in zip code 42518 include: Alexander Chapel (A), Zion Church (B), Quinton Church (C), Piney Grove Church (D). Display/hide their locations on the map
Cemeteries: Mayfield Cemetery (1), Morrow Cemetery (2), Hallars Cemetery (3), Hollers Cemetery (4), Gibson Cemetery (5), Stiggall Cemetery (6), Kidder Cemetery (7). Display/hide their locations on the map
In group quarters: 18 (-1 institutionalized population)
Size of family households: 414 2-persons, 225 3-persons, 83 4-persons, 75 5-persons, 9 7-or-more-persons
Size of nonfamily households: 211 1-person, 56 2-persons, 54 4-persons
10 married couples with children.
326 single-parent households (55 men, 271 women).
99.7% of residents of 42518 zip code speak English at home.
0.6% of residents speak Spanish at home (18% very well, 35% not well, 47% not at all).
Foreign born population: 46 (1.5%) (71.4% of them are naturalized citizens)
This zip code:
1.5%
Whole state:
4.0%
67%France
28%Honduras
29%American
25%English
7%Irish
4%German
4%Scottish
3%Dutch
1%Italian
Year of entry for the foreign-born population
52010 or later
162000 to 2009
01990 to 1999
47Before 1990
Facilities with environmental interests located in this zip code:
G & G FIBERBLASS REPAIR INCORPORATED (4067 HIGHWAY 90 in BRONSTON, KY)
(Resource Conservation and Recovery Act (tracking hazardous waste)) Conditionally Exempt Small Quantity Generators, less than 100 kg/month of hazardous waste (Resource Conservation and Recovery Act (tracking hazardous waste)) - notification Business NAICS classification: BOAT BUILDING.; BOAT BUILDING. Organizations: SAMUEL GRIGSBY (CONTACT/OWNER)
Alternative names: G & G FIBERGLASS REPAIR INC
LAKE CUMBERLAND WOODWORKS INC (3101 HWY 90 in BRONSTON, KY)
National Pollutant Discharge Elimination System NON-MAJOR (Tracking pollutant discharge elimination systems) - permit Business SIC classification: MILLWORK
Housing units lacking complete plumbing facilities: 6.3% Housing units lacking complete kitchen facilities: 3.5%
87.3%Electricity
4.7%Utility gas
4.4%Bottled, tank, or LP gas
2.4%Fuel oil, kerosene, etc.
1.5%Wood
Population in 1990: 2,417. Population change in the 1990s: +493 (+20.4%).
Place of birth for U.S.-born residents:
This state: 1,992
Northeast: 153
Midwest: 555
South: 281
West: 18
50% of the 42518 zip code residents lived in the same house 5 years ago. Out of people who lived in different houses, 55% lived in this county. Out of people who lived in different counties, 50% lived in Kentucky.
94% of the 42518 zip code residents lived in the same house 1 year ago. Out of people who lived in different houses, 60% moved from this county. Out of people who lived in different houses, 37% moved from different county within same state.
Private vs. public school enrollment:
Students in private schools in grades 1 to 8 (elementary and middle school): 8
Here:
5.4%
Kentucky:
17.2%
Students in private schools in grades 9 to 12 (high school):
Here:
0.0%
Kentucky:
15.2%
Students in private undergraduate colleges:
Here:
0.0%
Kentucky:
19.6%
Occupation by median earnings in the past 12 months ($)
69,325Management occupations
52,611Education, training, and library occupations
31,792Business and financial operations occupations
31,744Construction and extraction occupations
25,831Production occupations
25,272Transportation occupations
Top industries in this zip code by the number of employees in 2005:
Other Services (except Public Administration): Other Similar Organizations (except Business, Professional, Labor, and Political Organizations) (50-99 employees: 1 establishment)
Health Care and Social Assistance: Temporary Shelters (50-99: 1)
Accommodation and Food Services: Full-Service Restaurants (20-49: 1, 5-9: 1)
Real Estate and Rental and Leasing: Offices of Real Estate Agents and Brokers (5-9: 1, 1-4: 1)
People in group quarters in 2010:
47 people in residential treatment centers for juveniles (non-correctional)
People in group quarters in 2000:
45 people in training schools for juvenile delinquents
Fatal accident statistics in 2011:
Fatal accident count: 1
Vehicles involved in fatal accidents: 1
Fatal accidents caused by drunken drivers: 1
Fatalities: 1
Persons involved in fatal accidents: 2
Pedestrians involved in fatal accidents: 0
Fatal accident statistics in 2010:
Fatal accident count: 1
Vehicles involved in fatal accidents: 1
Fatal accidents caused by drunken drivers: 0
Fatalities: 1
Persons involved in fatal accidents: 1
Pedestrians involved in fatal accidents: 1
2004 - 2018 National Fire Incident Reporting System (NFIRS) incidents
Based on the data from the years 2004 - 2018 the average number of fires per year is 8. The highest number of fire incidents - 30 took place in 2017, and the least - 0 in 2005. The data has a growing trend.
When looking into fire subcategories, the most incidents belonged to: Structure Fires (37.9%), and Outside Fires (33.9%).
Fire incident types reported to NFIRS in Zip Code 42518


 Nearest zip codes: 42519, 42533, 42544, 42634, 42501, 42553.


 Based on the data from the years 2004 - 2018 the average number of fires per year is 8. The highest number of fire incidents - 30 took place in 2017, and the least - 0 in 2005. The data has a growing trend.
 When looking into fire subcategories, the most incidents belonged to: Structure Fires (37.9%), and Outside Fires (33.9%).