Estimated zip code population in 2022: 2,029 Zip code population in 2010: 2,736 Zip code population in 2000: 2,368
Houses and condos: 791 Renter-occupied apartments: 121
% of renters here:
17%
State:
31%
March 2022 cost of living index in zip code 42776: 82.2 (low, U.S. average is 100)
Land area: 67.6 sq. mi. Water area: 0.6 sq. mi.
Population density: 30 people per square mile
(very low).
OSM Map
General Map
Google Map
MSN Map
OSM Map
General Map
Google Map
MSN Map
OSM Map
General Map
Google Map
MSN Map
OSM Map
General Map
Google Map
MSN Map
Please wait while loading the map...
Real estate property taxes paid for housing units in 2022:
This zip code:
0.7% ($1,386)
Kentucky:
0.7% ($1,456)
Median real estate property taxes paid for housing units with mortgages in 2022: $1,451 (0.7%) Median real estate property taxes paid for housing units with no mortgage in 2022: $1,241 (0.7%)
Business Search- 14 Million verified businesses
Males: 1,123
(55.4%)
Females: 905
(44.6%)
For population 25 years and over in 42776:
High school or higher: 87.4%
Bachelor's degree or higher: 16.0%
Graduate or professional degree: 4.6%
Unemployed: 3.1%
Mean travel time to work (commute): 31.6 minutes
For population 15 years and over in 42776:
Never married: 27.0%
Now married: 53.3%
Separated: 0.6%
Widowed: 8.9%
Divorced: 10.2%
Zip code 42776 compared to state average:
Black race population percentage significantly below state average.
Hispanic race population percentage significantly below state average.
Foreign-born population percentage significantly below state average.
Renting percentage below state average.
Length of stay since moving in significantly below state average.
Number of college students below state average.
Percentage of population with a bachelor's degree or higher below state average.
Estimated median house/condo value in 2022: $191,088
42776:
$191,088
Kentucky:
$196,300
According to our research of Kentucky and other state lists, there was 1 registered sex offender living in 42776 zip code as of May 28, 2024. The ratio of all residents to sex offenders in zip code 42776 is 3,375 to 1. The ratio of registered sex offenders to all residents in this zip code is much lower than the state average.
Median resident age:
This zip code:
37.5 years
Kentucky median age:
39.4 years
Average household size:
This zip code:
2.9 people
Kentucky:
2.4 people
Averages for the 2020 tax year for zip code 42776, filed in 2021:
Average Adjusted Gross Income (AGI) in 2020: $51,131 (Individual Income Tax Returns)
Here:
$51,131
State:
$61,342
Salary/wage: $47,231 (reported on 80.9% of returns)
Here:
$47,231
State:
$50,827
(% of AGI for various income ranges: 1072.8% for AGIs below $25k, 3515.2% for AGIs $25k-50k, 6392.5% for AGIs $50k-75k, 9020.0% for AGIs $75k-100k, 16851.2% for AGIs $100k-200k)
Taxable interest for individuals: $658 (reported on 20.9% of returns)
This zip code:
$658
Kentucky:
$1,441
(% of AGI for various income ranges: 19.3% for AGIs below $25k, 11.3% for AGIs $25k-50k, 15.0% for AGIs $50k-75k, 22.0% for AGIs $75k-100k, 37.5% for AGIs $100k-200k)
Ordinary dividends: $1,556 (reported on 7.8% of returns)
Here:
$1,556
State:
$7,388
(% of AGI for various income ranges: 4.8% for AGIs below $25k, 25.2% for AGIs $25k-50k, 68.0% for AGIs $75k-100k)
Net capital gain/loss in AGI: +$7,591 (reported on 9.6% of returns)
Here:
+$7,591
State:
+$19,475
(% of AGI for various income ranges: 29.3% for AGIs below $25k, 170.0% for AGIs $50k-75k, 597.5% for AGIs $100k-200k)
Profit/loss from business: +$11,320 (reported on 17.4% of returns)
Here:
+$11,320
State:
+$11,386
(% of AGI for various income ranges: 165.9% for AGIs below $25k, 56.5% for AGIs $25k-50k, 295.6% for AGIs $50k-75k, 386.0% for AGIs $75k-100k, 992.5% for AGIs $100k-200k)
Taxable individual retirement arrangement distribution: $11,444 (reported on 7.8% of returns)
42776:
$11,444
Kentucky:
$18,941
(% of AGI for various income ranges: 44.8% for AGIs below $25k, 157.0% for AGIs $25k-50k, 539.0% for AGIs $75k-100k)
Total itemized deductions: $18,933 (reported on 2.6% of returns)
Here:
$18,933
State:
$32,473
(% of AGI for various income ranges: 247.0% for AGIs $25k-50k)
Taxes paid: $6,100 (reported on 2.6% of returns)
42776:
$6,100
State:
$7,830
(% of AGI for various income ranges: 183.0% for AGIs $75k-100k)
Earned income credit: $2,210 (reported on 18.3% of returns)
Here:
$2,210
State:
$2,336
(% of AGI for various income ranges: 94.5% for AGIs below $25k, 82.6% for AGIs $25k-50k)
Percentage of individuals using paid preparers for their 2020 taxes: 94.8%
Here:
95%
State:
94%
(% for various income ranges: 92.5% for AGIs below $25k, 96.4% for AGIs $25k-50k, 95.2% for AGIs $50k-75k, 100.0% for AGIs $75k-100k, 92.3% for AGIs $100k-200k)
Averages for the 2012 tax year for zip code 42776, filed in 2013:
Average Adjusted Gross Income (AGI) in 2012: $41,934 (Individual Income Tax Returns)
Here:
$41,934
State:
$50,814
Salary/wage: $37,792 (reported on 82.2% of returns)
Here:
$37,792
State:
$42,723
(% of AGI for various income ranges: 72.2% for AGIs below $25k, 79.5% for AGIs $25k-50k, 77.9% for AGIs $50k-75k, 83.2% for AGIs $75k-100k, 59.3% for AGIs $100k-200k)
Taxable interest for individuals: $811 (reported on 32.7% of returns)
This zip code:
$811
Kentucky:
$1,381
(% of AGI for various income ranges: 1.5% for AGIs below $25k, 0.7% for AGIs $25k-50k, 0.5% for AGIs $50k-75k, 0.5% for AGIs $75k-100k, 0.3% for AGIs $100k-200k)
Ordinary dividends: $1,220 (reported on 9.3% of returns)
Here:
$1,220
State:
$6,239
(% of AGI for various income ranges: 0.9% for AGIs below $25k, 0.1% for AGIs $25k-50k, 0.2% for AGIs $50k-75k, 0.6% for AGIs $75k-100k)
Net capital gain/loss in AGI: +$6,108 (reported on 12.1% of returns)
Here:
+$6,108
State:
+$11,336
(% of AGI for various income ranges: 1.0% for AGIs below $25k, 0.7% for AGIs $25k-50k, 1.1% for AGIs $50k-75k, 5.2% for AGIs $100k-200k)
Profit/loss from business: +$8,639 (reported on 16.8% of returns)
Here:
+$8,639
State:
+$10,862
(% of AGI for various income ranges: 12.2% for AGIs below $25k, 2.6% for AGIs $25k-50k, 3.3% for AGIs $50k-75k, 2.8% for AGIs $75k-100k)
Taxable individual retirement arrangement distribution: $6,371 (reported on 6.5% of returns)
42776:
$6,371
Kentucky:
$14,296
(% of AGI for various income ranges: 1.9% for AGIs below $25k, 1.3% for AGIs $25k-50k, 1.7% for AGIs $50k-75k)
Total itemized deductions: $18,846 (25% of AGI, reported on 24.3% of returns)
Here:
$18,846
State:
$21,160
Here:
25.0% of AGI
State:
20.0% of AGI
(% of AGI for various income ranges: 8.1% for AGIs below $25k, 7.8% for AGIs $25k-50k, 10.0% for AGIs $50k-75k, 11.7% for AGIs $75k-100k, 16.2% for AGIs $100k-200k)
Charity contributions: $4,211 (reported on 16.8% of returns)
Here:
$4,211
State:
$4,303
(% of AGI for various income ranges: 1.4% for AGIs $25k-50k, 1.2% for AGIs $50k-75k, 2.4% for AGIs $75k-100k, 3.0% for AGIs $100k-200k)
Taxes paid: $5,431 (reported on 24.3% of returns)
42776:
$5,431
State:
$8,496
(% of AGI for various income ranges: 0.6% for AGIs below $25k, 2.0% for AGIs $25k-50k, 2.7% for AGIs $50k-75k, 4.2% for AGIs $75k-100k, 5.6% for AGIs $100k-200k)
Earned income credit: $2,212 (reported on 24.3% of returns)
Here:
$2,212
State:
$2,273
(% of AGI for various income ranges: 7.0% for AGIs below $25k, 1.6% for AGIs $25k-50k)
Percentage of individuals using paid preparers for their 2012 taxes: 68.2%
Here:
68%
State:
60%
(% for various income ranges: 63.0% for AGIs below $25k, 69.0% for AGIs $25k-50k, 72.2% for AGIs $50k-75k, 75.0% for AGIs $75k-100k, 83.3% for AGIs $100k-200k)
Averages for the 2004 tax year for zip code 42776, filed in 2005:
Average Adjusted Gross Income (AGI) in 2004: $32,200 (Individual Income Tax Returns)
Here:
$32,200
State:
$41,540
Salary/wage: $31,023 (reported on 83.1% of returns)
Here:
$31,023
State:
$36,432
(% of AGI for various income ranges: 104.3% for AGIs below $10k, 76.9% for AGIs $10k-25k, 84.2% for AGIs $25k-50k, 84.1% for AGIs $50k-75k, 75.3% for AGIs $75k-100k, 63.9% for AGIs over 100k)
Taxable interest for individuals: $1,040 (reported on 41.5% of returns)
This zip code:
$1,040
Kentucky:
$1,571
(% of AGI for various income ranges: 9.1% for AGIs below $10k, 2.2% for AGIs $10k-25k, 1.2% for AGIs $25k-50k, 1.0% for AGIs $50k-75k, 0.5% for AGIs $75k-100k, 0.4% for AGIs over 100k)
Taxable dividends: $631 (reported on 12.0% of returns)
Here:
$631
State:
$3,453
(% of AGI for various income ranges: 1.3% for AGIs below $10k, 0.3% for AGIs $10k-25k, 0.1% for AGIs $25k-50k, 0.4% for AGIs $50k-75k, 0.3% for AGIs $75k-100k)
Net capital gain/loss: +$7,230 (reported on 12.0% of returns)
Here:
+$7,230
State:
+$9,663
(% of AGI for various income ranges: 2.2% for AGIs below $10k, 0.4% for AGIs $10k-25k, 1.3% for AGIs $25k-50k, 1.3% for AGIs $50k-75k, 6.6% for AGIs $75k-100k, 7.8% for AGIs over 100k)
Profit/loss from business: +$5,656 (reported on 18.3% of returns)
Here:
+$5,656
State:
+$9,233
(% of AGI for various income ranges: 1.3% for AGIs below $10k, 4.7% for AGIs $10k-25k, 4.2% for AGIs $25k-50k, 3.0% for AGIs $50k-75k, 3.1% for AGIs $75k-100k)
Total itemized deductions: $14,341 (25% of AGI, reported on 22.8% of returns)
Here:
$14,341
State:
$17,474
Here:
24.8% of AGI
State:
21.0% of AGI
(% of AGI for various income ranges: 23.2% for AGIs below $10k, 6.9% for AGIs $10k-25k, 8.8% for AGIs $25k-50k, 10.1% for AGIs $50k-75k, 12.8% for AGIs $75k-100k, 11.7% for AGIs over 100k)
Charity contributions deductions: $2,691 (4% of AGI, reported on 17.5% of returns)
Here:
$2,691
State:
$3,494
Here:
4.3% of AGI
State:
4.0% of AGI
(% of AGI for various income ranges: 1.1% for AGIs $10k-25k, 0.9% for AGIs $25k-50k, 1.4% for AGIs $50k-75k, 2.4% for AGIs $75k-100k, 2.6% for AGIs over 100k)
Total tax: $3,633 (reported on 74.2% of returns)
42776:
$3,633
State:
$6,162
(% of AGI for various income ranges: 4.0% for AGIs below $10k, 4.1% for AGIs $10k-25k, 6.7% for AGIs $25k-50k, 8.2% for AGIs $50k-75k, 10.0% for AGIs $75k-100k, 17.3% for AGIs over 100k)
Earned income credit: $1,635 (reported on 18.6% of returns)
Here:
$1,635
State:
$1,723
Percentage of individuals using paid preparers for their 2004 taxes: 75.3%
Here:
75%
State:
66%
(% for various income ranges: 68.5% for AGIs below $10k, 73.4% for AGIs $10k-25k, 78.5% for AGIs $25k-50k, 84.3% for AGIs $50k-75k, 81.1% for AGIs $75k-100k, 65.4% for AGIs over 100k)
Household received Food Stamps/SNAP in the past 12 months: 58 Household did not receive Food Stamps/SNAP in the past 12 months: 635
Women who had a birth in the past 12 months: 28 (24 now married, 3 unmarried) Women who did not have a birth in the past 12 months: 231 (127 now married, 104 unmarried)
Housing units in zip code 42776 with a mortgage: 376 (49 second mortgage, 4 home equity loan, 44 both second mortgage and home equity loan) Houses without a mortgage: 3
Median monthly owner costs for units with a mortgage: $962 Median monthly owner costs for units without a mortgage: $425
Residents with income below the poverty level in 2022:
This zip code:
14.8%
Whole state:
16.5%
Residents with income below 50% of the poverty level in 2022:
This zip code:
11.4%
Whole state:
9.0%
Median number of rooms in houses and condos:
Here:
6.0
State:
6.4
Median number of rooms in apartments:
Here:
5.5
State:
4.4
Notable locations in this zip code not listed on our city pages
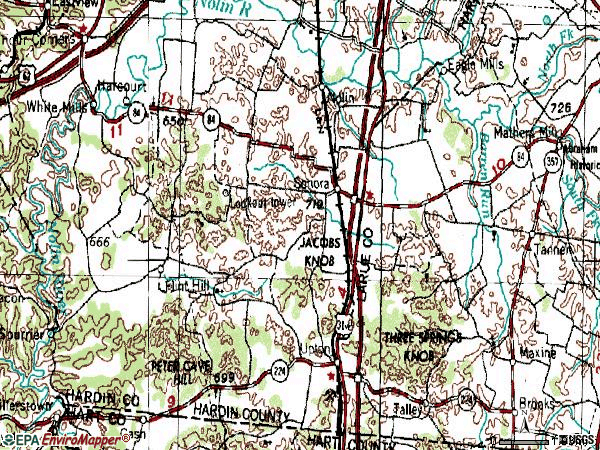
Churches in zip code 42776 include: Zion Church (A), Oak Hill Church (B), Oak Hill Mission (C), Barren Run Baptist Church (D), Center Point Church (E), Olive Hill Church (F). Display/hide their locations on the map
Streams, rivers, and creeks: Dorsey Run (A), Cox Run (B), Tucker Creek (C), Chestnut Fork (D), Jackson Branch (E), Sandy Creek (F). Display/hide their locations on the map
In group quarters: 26 (-1 institutionalized population)
Size of family households: 222 2-persons, 53 3-persons, 167 4-persons, 24 5-persons, 17 6-persons, 25 7-or-more-persons
Size of nonfamily households: 152 1-person, 28 2-persons
435 married couples with children.
37 single-parent households (12 men, 25 women).
95.5% of residents of 42776 zip code speak English at home.
0.9% of residents speak Spanish at home (100% very well).
3.4% of residents speak other Indo-European language at home (100% well).
0.1% of residents speak other language at home (100% very well).
Foreign born population: 9 (0.5%) (42.1% of them are naturalized citizens)
This zip code:
0.5%
Whole state:
4.0%
20%France
10%Singapore
10%Israel
24%Irish
15%American
15%English
2%German
2%Polish
1%Italian
1%Scotch-Irish
Year of entry for the foreign-born population
22010 or later
32000 to 2009
11990 to 1999
15Before 1990
Facilities with environmental interests located in this zip code:
MIDDLETON, CARLIE METAL YARD (PAYNE RD, 0.1MI S OF SR-1407 in SONORA, KY)
KNAGGEN INCORPORATED (SONORA ROAD & SOUTH DIXIE HIGHWAY in SONORA, KY)
AIR MAJOR (AIRS/AFS) (Resource Conservation and Recovery Act (tracking hazardous waste)) TRI REPORTER (Tracking of toxic chemicals releasing facilities) Business SIC classification: WOOD HOUSEHOLD FURNITURE, EXCEPT UPHOLSTERED Business NAICS classification: WOOD OFFICE FURNITURE MANUFACTURING. Organizations: REAL ESTATE HOLDING CO. (CONTACT/OWNER)
Alternative names: REAL ESTATE HOLDING INC.
BLUE BEACON OF SONORA (440 EAST WESTERN AVE in SONORA, KY)
National Pollutant Discharge Elimination System NON-MAJOR (Tracking pollutant discharge elimination systems) - permit Business SIC classification: CARWASHES
C & R MARKET (HWY 84 in SONORA, KY)
(Resource Conservation and Recovery Act (tracking hazardous waste)) Business NAICS classification: OTHER FUEL DEALERS. Organizations: CHARLES BRADLEY, JR. (CONTACT/OWNER)
CARGILL, INC. (14109 SOUTH DIXIE HIGHWAY in SONORA, KY)
(Resource Conservation and Recovery Act (tracking hazardous waste))
MUTUAL BENEFIT LIFE (1404 HORSESHOE BEND RD in SONORA, KY)
(Resource Conservation and Recovery Act (tracking hazardous waste)) Organizations: BOB WADE JR (CONTACT/OWNER)
PILOT TRAVEL CENTERS LLC #392 (450 E WESTERN AVE in SONORA, KY)
National Pollutant Discharge Elimination System NON-MAJOR (Tracking pollutant discharge elimination systems) - permit Business SIC classification: GASOLINE SERVICE STATIONS Alternative names: SONORA AUTO TRUCK PLAZA
LOUISVILLE G&E CO FLINT HILL STATION (OFF HWY 479 & MELLROSE RD in SONORA, KY)
(Resource Conservation and Recovery Act (tracking hazardous waste)) Organizations: LOUISVILLE G & E (CONTACT/OWNER)
NSU CORPORATION (9385 SONORA ROAD in SONORA, KY)
CRITERIA AND HAZARDOUS AIR POLLUTANT INVENTORY (Inventory of air pollution sources) Business SIC classification: MOTOR VEHICLE PARTS AND ACCESSORIES
Housing units lacking complete plumbing facilities: 6.5% Housing units lacking complete kitchen facilities: 3.6%
76.6%Electricity
7.2%Utility gas
6.9%Bottled, tank, or LP gas
6.1%Wood
3.6%Fuel oil, kerosene, etc.
Population in 1990: 2,396.
Place of birth for U.S.-born residents:
This state: 1,579
Northeast: 98
Midwest: 157
South: 137
West: 27
62% of the 42776 zip code residents lived in the same house 5 years ago. Out of people who lived in different houses, 61% lived in this county. Out of people who lived in different counties, 50% lived in Kentucky.
85% of the 42776 zip code residents lived in the same house 1 year ago. Out of people who lived in different houses, 57% moved from this county. Out of people who lived in different houses, 16% moved from different county within same state. Out of people who lived in different houses, 25% moved from different state.
Private vs. public school enrollment:
Students in private schools in grades 1 to 8 (elementary and middle school): 39
Here:
17.6%
Kentucky:
17.2%
Students in private schools in grades 9 to 12 (high school): 17
Here:
10.4%
Kentucky:
15.2%
Students in private undergraduate colleges: 4
Here:
11.1%
Kentucky:
19.6%
Occupation by median earnings in the past 12 months ($)
58,573Installation, maintenance, and repair occupations
50,908Transportation occupations
48,254Health diagnosing and treating practitioners and other technical occupations
47,103Health technologists and technicians
42,618Production occupations
39,917Management occupations
Top industries in this zip code by the number of employees in 2005:
Health Care and Social Assistance: Residential Mental Retardation Facilities (50-99 employees: 1 establishment)
Other Services (except Public Administration): Car Washes (20-49: 1)
Other Services (except Public Administration): Religious Organizations (5-9: 1, 1-4: 1)
Other Services (except Public Administration): Funeral Homes and Funeral Services (5-9: 1)
People in group quarters in 2010:
36 people in residential treatment centers for juveniles (non-correctional)
5 people in workers' group living quarters and job corps centers
People in group quarters in 2000:
12 people in homes for the mentally retarded
3 people in homes or halfway houses for drug/alcohol abuse
3 people in other noninstitutional group quarters
Fatal accident statistics in 2012:
Fatal accident count: 1
Vehicles involved in fatal accidents: 3
Fatal accidents caused by drunken drivers: 0
Fatalities: 1
Persons involved in fatal accidents: 5
Pedestrians involved in fatal accidents: 0
Fatal accident statistics in 2010:
Fatal accident count: 2
Vehicles involved in fatal accidents: 4
Fatal accidents caused by drunken drivers: 0
Fatalities: 2
Persons involved in fatal accidents: 6
Pedestrians involved in fatal accidents: 0
Home Mortgage Disclosure Act Aggregated Statistics For Year 2009 (Based on 2 partial tracts)
A) FHA, FSA/RHS & VA Home Purchase Loans
B) Conventional Home Purchase Loans
C) Refinancings
D) Home Improvement Loans
E) Loans on Dwellings For 5+ Families
F) Non-occupant Loans on < 5 Family Dwellings (A B C & D)
G) Loans On Manufactured Home Dwelling (A B C & D)
Number
Average Value
Number
Average Value
Number
Average Value
Number
Average Value
Number
Average Value
Number
Average Value
Number
Average Value
LOANS ORIGINATED
29
$134,113
29
$117,251
159
$130,739
13
$51,144
1
$799,440
15
$83,231
17
$60,193
APPLICATIONS APPROVED, NOT ACCEPTED
1
$124,580
1
$106,590
6
$140,235
1
$33,980
0
$0
0
$0
1
$35,970
APPLICATIONS DENIED
6
$145,232
15
$88,027
45
$137,444
5
$42,770
0
$0
0
$0
9
$73,578
APPLICATIONS WITHDRAWN
5
$142,566
7
$89,651
25
$144,912
3
$36,640
0
$0
1
$23,980
2
$47,965
FILES CLOSED FOR INCOMPLETENESS
0
$0
0
$0
5
$207,588
0
$0
0
$0
0
$0
0
$0
Aggregated Statistics For Year 2008 (Based on 2 partial tracts)
A) FHA, FSA/RHS & VA Home Purchase Loans
B) Conventional Home Purchase Loans
C) Refinancings
D) Home Improvement Loans
F) Non-occupant Loans on < 5 Family Dwellings (A B C & D)
G) Loans On Manufactured Home Dwelling (A B C & D)
Number
Average Value
Number
Average Value
Number
Average Value
Number
Average Value
Number
Average Value
Number
Average Value
LOANS ORIGINATED
32
$124,538
37
$123,931
131
$114,810
19
$39,972
23
$118,700
17
$48,594
APPLICATIONS APPROVED, NOT ACCEPTED
3
$88,603
1
$93,270
10
$143,100
1
$9,990
0
$0
1
$15,320
APPLICATIONS DENIED
11
$117,251
12
$96,987
60
$135,383
12
$69,951
3
$148,783
7
$72,806
APPLICATIONS WITHDRAWN
4
$152,060
9
$115,401
31
$147,574
1
$16,660
1
$125,250
1
$83,280
FILES CLOSED FOR INCOMPLETENESS
1
$91,270
1
$88,600
3
$173,657
0
$0
0
$0
0
$0
Aggregated Statistics For Year 2007 (Based on 2 partial tracts)
A) FHA, FSA/RHS & VA Home Purchase Loans
B) Conventional Home Purchase Loans
C) Refinancings
D) Home Improvement Loans
F) Non-occupant Loans on < 5 Family Dwellings (A B C & D)
G) Loans On Manufactured Home Dwelling (A B C & D)
Number
Average Value
Number
Average Value
Number
Average Value
Number
Average Value
Number
Average Value
Number
Average Value
LOANS ORIGINATED
25
$126,445
73
$105,679
107
$106,816
24
$39,084
28
$84,274
22
$47,088
APPLICATIONS APPROVED, NOT ACCEPTED
1
$95,270
8
$115,669
12
$107,036
1
$20,650
0
$0
2
$70,285
APPLICATIONS DENIED
8
$147,064
25
$102,968
66
$106,622
11
$16,474
5
$53,430
12
$67,952
APPLICATIONS WITHDRAWN
3
$92,823
14
$137,523
29
$121,938
1
$56,630
3
$152,337
5
$41,570
FILES CLOSED FOR INCOMPLETENESS
0
$0
1
$75,280
7
$135,904
1
$9,990
0
$0
0
$0
Aggregated Statistics For Year 2006 (Based on 2 partial tracts)
A) FHA, FSA/RHS & VA Home Purchase Loans
B) Conventional Home Purchase Loans
C) Refinancings
D) Home Improvement Loans
F) Non-occupant Loans on < 5 Family Dwellings (A B C & D)
G) Loans On Manufactured Home Dwelling (A B C & D)
Number
Average Value
Number
Average Value
Number
Average Value
Number
Average Value
Number
Average Value
Number
Average Value
LOANS ORIGINATED
21
$155,605
93
$104,729
117
$88,878
36
$23,946
37
$90,063
38
$44,495
APPLICATIONS APPROVED, NOT ACCEPTED
1
$192,530
17
$77,945
10
$85,473
3
$41,527
3
$80,833
7
$76,327
APPLICATIONS DENIED
1
$53,960
30
$97,021
70
$101,053
19
$48,808
13
$86,811
13
$60,368
APPLICATIONS WITHDRAWN
2
$107,590
11
$84,184
29
$108,177
0
$0
3
$67,730
2
$55,630
FILES CLOSED FOR INCOMPLETENESS
0
$0
1
$63,290
9
$135,312
1
$79,280
0
$0
0
$0
Aggregated Statistics For Year 2005 (Based on 2 partial tracts)
A) FHA, FSA/RHS & VA Home Purchase Loans
B) Conventional Home Purchase Loans
C) Refinancings
D) Home Improvement Loans
F) Non-occupant Loans on < 5 Family Dwellings (A B C & D)
G) Loans On Manufactured Home Dwelling (A B C & D)
Number
Average Value
Number
Average Value
Number
Average Value
Number
Average Value
Number
Average Value
Number
Average Value
LOANS ORIGINATED
20
$126,045
98
$88,951
125
$91,312
27
$28,967
23
$84,347
25
$42,130
APPLICATIONS APPROVED, NOT ACCEPTED
0
$0
11
$103,200
17
$88,565
2
$50,300
1
$175,880
1
$35,970
APPLICATIONS DENIED
3
$148,340
35
$77,165
83
$91,269
20
$22,584
3
$69,283
19
$80,856
APPLICATIONS WITHDRAWN
1
$84,610
15
$108,369
29
$109,142
5
$136,572
4
$117,250
1
$114,590
FILES CLOSED FOR INCOMPLETENESS
0
$0
5
$59,026
7
$89,461
1
$21,320
0
$0
1
$87,940
Aggregated Statistics For Year 2004 (Based on 2 partial tracts)
A) FHA, FSA/RHS & VA Home Purchase Loans
B) Conventional Home Purchase Loans
C) Refinancings
D) Home Improvement Loans
F) Non-occupant Loans on < 5 Family Dwellings (A B C & D)
G) Loans On Manufactured Home Dwelling (A B C & D)
Detailed PMIC statistics for the following Tracts:0016.00
2003 - 2018 National Fire Incident Reporting System (NFIRS) incidents
According to the data from the years 2003 - 2018 the average number of fires per year is 10. The highest number of reported fire incidents - 36 took place in 2010, and the least - 0 in 2006. The data has a constant trend.
When looking into fire subcategories, the most reports belonged to: Structure Fires (50.0%), and Outside Fires (35.0%).
Fire incident types reported to NFIRS in Zip Code 42776

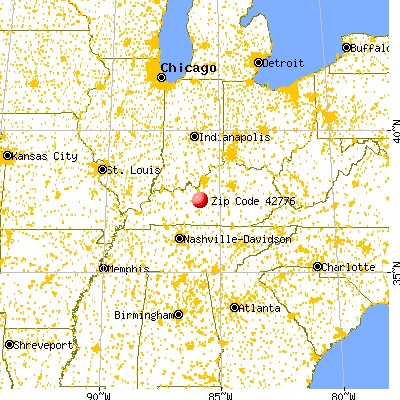


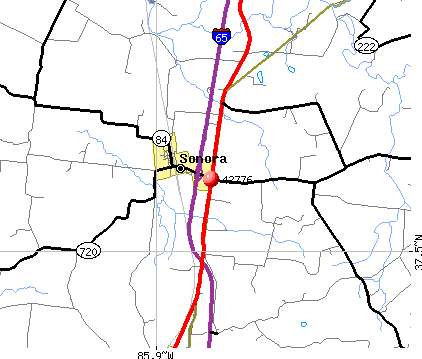 Nearest zip codes: 42784, 42740, 42788, 42713, 42712, 42765.


 According to the data from the years 2003 - 2018 the average number of fires per year is 10. The highest number of reported fire incidents - 36 took place in 2010, and the least - 0 in 2006. The data has a constant trend.
 When looking into fire subcategories, the most reports belonged to: Structure Fires (50.0%), and Outside Fires (35.0%).