Estimated zip code population in 2022: 3,134 Zip code population in 2010: 2,917 Zip code population in 2000: 2,490
Houses and condos: 1,479 Renter-occupied apartments: 336
% of renters here:
25%
State:
33%
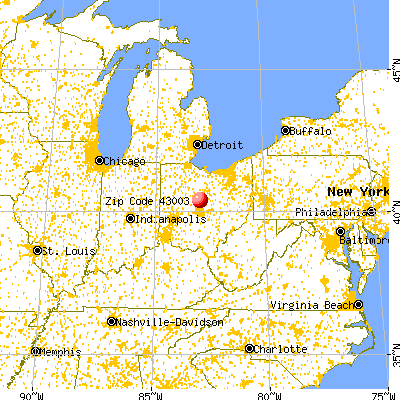
March 2022 cost of living index in zip code 43003: 84.6 (less than average, U.S. average is 100)
Land area: 33.9 sq. mi. Water area: 1.1 sq. mi.
Population density: 93 people per square mile
(very low).
OSM Map
General Map
Google Map
MSN Map
OSM Map
General Map
Google Map
MSN Map
OSM Map
General Map
Google Map
MSN Map
OSM Map
General Map
Google Map
MSN Map
Please wait while loading the map...
Real estate property taxes paid for housing units in 2022:
This zip code:
1.2% ($2,728)
Ohio:
1.3% ($2,639)
Median real estate property taxes paid for housing units with mortgages in 2022: $2,963 (1.2%) Median real estate property taxes paid for housing units with no mortgage in 2022: $1,825 (1.0%)
Estimated median house/condo value in 2022: $225,813
43003:
$225,813
Ohio:
$204,100
According to our research of Ohio and other state lists, there were 4 registered sex offenders living in 43003 zip code as of May 28, 2024. The ratio of all residents to sex offenders in zip code 43003 is 729 to 1. The ratio of registered sex offenders to all residents in this zip code is lower than the state average.
Median resident age:
This zip code:
46.4 years
Ohio median age:
39.9 years
Average household size:
This zip code:
2.4 people
Ohio:
2.4 people
Averages for the 2020 tax year for zip code 43003, filed in 2021:
Average Adjusted Gross Income (AGI) in 2020: $56,752 (Individual Income Tax Returns)
Here:
$56,752
State:
$67,288
Salary/wage: $50,533 (reported on 83.7% of returns)
Here:
$50,533
State:
$55,628
(% of AGI for various income ranges: 1043.0% for AGIs below $25k, 3606.3% for AGIs $25k-50k, 6472.4% for AGIs $50k-75k, 11201.2% for AGIs $75k-100k, 21081.8% for AGIs $100k-200k)
Taxable interest for individuals: $450 (reported on 22.2% of returns)
This zip code:
$450
Ohio:
$1,518
(% of AGI for various income ranges: 4.7% for AGIs below $25k, 11.0% for AGIs $25k-50k, 16.5% for AGIs $50k-75k, 17.5% for AGIs $75k-100k, 41.8% for AGIs $100k-200k)
Ordinary dividends: $1,900 (reported on 12.6% of returns)
Here:
$1,900
State:
$7,167
(% of AGI for various income ranges: 10.7% for AGIs below $25k, 19.7% for AGIs $25k-50k, 21.8% for AGIs $50k-75k, 23.8% for AGIs $75k-100k, 160.0% for AGIs $100k-200k)
Net capital gain/loss in AGI: +$4,264 (reported on 10.4% of returns)
Here:
+$4,264
State:
+$18,919
(% of AGI for various income ranges: 23.7% for AGIs $25k-50k, 64.1% for AGIs $50k-75k, 379.1% for AGIs $100k-200k)
Profit/loss from business: +$13,205 (reported on 14.1% of returns)
Here:
+$13,205
State:
+$13,744
(% of AGI for various income ranges: 147.3% for AGIs below $25k, 214.7% for AGIs $25k-50k, 65.3% for AGIs $50k-75k, 333.8% for AGIs $75k-100k, 950.0% for AGIs $100k-200k)
Taxable individual retirement arrangement distribution: $14,278 (reported on 6.7% of returns)
43003:
$14,278
Ohio:
$18,876
(% of AGI for various income ranges: 29.3% for AGIs below $25k, 97.0% for AGIs $25k-50k, 187.1% for AGIs $50k-75k, 534.5% for AGIs $100k-200k)
Total itemized deductions: $26,375 (reported on 3.0% of returns)
Here:
$26,375
State:
$33,869
(% of AGI for various income ranges: 959.1% for AGIs $100k-200k)
Charity contributions: $4,233 (reported on 2.2% of returns)
Here:
$4,233
State:
$14,577
(% of AGI for various income ranges: 115.5% for AGIs $100k-200k)
Taxes paid: $6,820 (reported on 3.7% of returns)
43003:
$6,820
State:
$7,681
(% of AGI for various income ranges: 34.3% for AGIs below $25k, 216.4% for AGIs $100k-200k)
Earned income credit: $2,261 (reported on 17.0% of returns)
Here:
$2,261
State:
$2,304
(% of AGI for various income ranges: 105.3% for AGIs below $25k, 68.0% for AGIs $25k-50k)
Percentage of individuals using paid preparers for their 2020 taxes: 91.9%
Here:
92%
State:
94%
(% for various income ranges: 92.3% for AGIs below $25k, 94.9% for AGIs $25k-50k, 91.3% for AGIs $50k-75k, 84.6% for AGIs $75k-100k, 89.5% for AGIs $100k-200k, 100.0% for AGIs over 200k)
Averages for the 2012 tax year for zip code 43003, filed in 2013:
Average Adjusted Gross Income (AGI) in 2012: $42,636 (Individual Income Tax Returns)
Here:
$42,636
State:
$54,926
Salary/wage: $39,290 (reported on 85.4% of returns)
Here:
$39,290
State:
$45,869
(% of AGI for various income ranges: 75.4% for AGIs below $25k, 81.6% for AGIs $25k-50k, 80.2% for AGIs $50k-75k, 80.9% for AGIs $75k-100k, 75.0% for AGIs $100k-200k)
Taxable interest for individuals: $427 (reported on 24.1% of returns)
This zip code:
$427
Ohio:
$1,297
(% of AGI for various income ranges: 0.4% for AGIs below $25k, 0.4% for AGIs $25k-50k, 0.1% for AGIs $50k-75k, 0.3% for AGIs $75k-100k, 0.1% for AGIs $100k-200k)
Ordinary dividends: $1,753 (reported on 10.9% of returns)
Here:
$1,753
State:
$5,821
(% of AGI for various income ranges: 0.5% for AGIs below $25k, 0.4% for AGIs $25k-50k, 0.2% for AGIs $50k-75k, 0.3% for AGIs $75k-100k, 0.8% for AGIs $100k-200k)
Net capital gain/loss in AGI: +$986 (reported on 5.1% of returns)
Here:
+$986
State:
+$11,232
(% of AGI for various income ranges: 0.4% for AGIs $100k-200k)
Profit/loss from business: +$10,616 (reported on 13.9% of returns)
Here:
+$10,616
State:
+$12,773
(% of AGI for various income ranges: 7.9% for AGIs below $25k, 3.6% for AGIs $25k-50k, 5.8% for AGIs $50k-75k, 1.0% for AGIs $100k-200k)
Taxable individual retirement arrangement distribution: $9,550 (reported on 7.3% of returns)
43003:
$9,550
Ohio:
$14,511
(% of AGI for various income ranges: 3.2% for AGIs below $25k, 1.0% for AGIs $25k-50k, 4.2% for AGIs $50k-75k)
Total itemized deductions: $16,560 (21% of AGI, reported on 25.5% of returns)
Here:
$16,560
State:
$21,278
Here:
21.3% of AGI
State:
18.8% of AGI
(% of AGI for various income ranges: 5.8% for AGIs below $25k, 7.1% for AGIs $25k-50k, 10.1% for AGIs $50k-75k, 12.3% for AGIs $75k-100k, 12.9% for AGIs $100k-200k)
Charity contributions: $1,856 (reported on 18.2% of returns)
Here:
$1,856
State:
$3,943
(% of AGI for various income ranges: 0.4% for AGIs below $25k, 0.6% for AGIs $25k-50k, 0.6% for AGIs $50k-75k, 1.5% for AGIs $75k-100k, 0.9% for AGIs $100k-200k)
Taxes paid: $6,846 (reported on 25.5% of returns)
43003:
$6,846
State:
$9,568
(% of AGI for various income ranges: 1.3% for AGIs below $25k, 2.2% for AGIs $25k-50k, 3.7% for AGIs $50k-75k, 5.2% for AGIs $75k-100k, 6.8% for AGIs $100k-200k)
Earned income credit: $2,157 (reported on 20.4% of returns)
Here:
$2,157
State:
$2,285
(% of AGI for various income ranges: 6.7% for AGIs below $25k, 1.0% for AGIs $25k-50k)
Percentage of individuals using paid preparers for their 2012 taxes: 39.4%
Here:
39%
State:
51%
(% for various income ranges: 34.5% for AGIs below $25k, 39.5% for AGIs $25k-50k, 47.8% for AGIs $50k-75k, 40.0% for AGIs $75k-100k, 45.5% for AGIs $100k-200k)
Averages for the 2004 tax year for zip code 43003, filed in 2005:
Average Adjusted Gross Income (AGI) in 2004: $36,170 (Individual Income Tax Returns)
Here:
$36,170
State:
$44,480
Salary/wage: $34,814 (reported on 87.9% of returns)
Here:
$34,814
State:
$39,198
(% of AGI for various income ranges: 101.3% for AGIs below $10k, 77.0% for AGIs $10k-25k, 86.0% for AGIs $25k-50k, 87.2% for AGIs $50k-75k, 91.5% for AGIs $75k-100k, 74.4% for AGIs over 100k)
Taxable interest for individuals: $623 (reported on 35.4% of returns)
This zip code:
$623
Ohio:
$1,532
(% of AGI for various income ranges: 2.1% for AGIs below $10k, 1.5% for AGIs $10k-25k, 0.5% for AGIs $25k-50k, 0.3% for AGIs $50k-75k, 0.6% for AGIs $75k-100k, 0.7% for AGIs over 100k)
Taxable dividends: $980 (reported on 15.5% of returns)
Here:
$980
State:
$3,496
(% of AGI for various income ranges: 3.1% for AGIs below $10k, 0.9% for AGIs $10k-25k, 0.3% for AGIs $25k-50k, 0.2% for AGIs $50k-75k, 0.3% for AGIs $75k-100k, 0.5% for AGIs over 100k)
Net capital gain/loss: +$1,412 (reported on 9.2% of returns)
Here:
+$1,412
State:
+$8,582
(% of AGI for various income ranges: -2.5% for AGIs below $10k, -0.2% for AGIs $10k-25k, -0.0% for AGIs $25k-50k, 0.1% for AGIs $50k-75k, -0.0% for AGIs $75k-100k, 2.9% for AGIs over 100k)
Profit/loss from business: +$6,141 (reported on 14.8% of returns)
Here:
+$6,141
State:
+$10,813
(% of AGI for various income ranges: 8.4% for AGIs below $10k, 6.5% for AGIs $10k-25k, 3.3% for AGIs $25k-50k, 1.5% for AGIs $50k-75k, 1.0% for AGIs $75k-100k)
Profit/loss from farming: +$3,034 (reported on 2.2% of returns)
Here:
+$3,034
State:
-$3,706
IRA payment deduction: $2,154 (reported on 1.0% of returns)
43003:
$2,154
Ohio:
$2,794
Total itemized deductions: $14,290 (25% of AGI, reported on 30.6% of returns)
Here:
$14,290
State:
$17,503
Here:
24.7% of AGI
State:
20.8% of AGI
(% of AGI for various income ranges: 14.6% for AGIs below $10k, 6.6% for AGIs $10k-25k, 10.8% for AGIs $25k-50k, 12.3% for AGIs $50k-75k, 15.5% for AGIs $75k-100k, 15.8% for AGIs over 100k)
Charity contributions deductions: $1,953 (3% of AGI, reported on 19.9% of returns)
Here:
$1,953
State:
$3,087
Here:
3.0% of AGI
State:
3.4% of AGI
(% of AGI for various income ranges: 0.3% for AGIs $10k-25k, 0.8% for AGIs $25k-50k, 1.0% for AGIs $50k-75k, 1.4% for AGIs $75k-100k, 2.4% for AGIs over 100k)
Total tax: $4,063 (reported on 77.1% of returns)
43003:
$4,063
State:
$6,781
(% of AGI for various income ranges: 3.1% for AGIs below $10k, 4.7% for AGIs $10k-25k, 7.1% for AGIs $25k-50k, 8.5% for AGIs $50k-75k, 9.5% for AGIs $75k-100k, 15.7% for AGIs over 100k)
Earned income credit: $1,458 (reported on 16.4% of returns)
Here:
$1,458
State:
$1,696
Percentage of individuals using paid preparers for their 2004 taxes: 49.1%
Here:
49%
State:
55%
(% for various income ranges: 42.1% for AGIs below $10k, 49.7% for AGIs $10k-25k, 50.8% for AGIs $25k-50k, 51.2% for AGIs $50k-75k, 44.9% for AGIs $75k-100k, 58.3% for AGIs over 100k)
Likely homosexual households (counted as self-reported same-sex unmarried-partner households)
Lesbian couples: 0.4% of all households
Gay men: 0.0% of all households
Household received Food Stamps/SNAP in the past 12 months: 109 Household did not receive Food Stamps/SNAP in the past 12 months: 1,208
Women who had a birth in the past 12 months: 41 (0 now married, 39 unmarried) Women who did not have a birth in the past 12 months: 692 (207 now married, 485 unmarried)
Housing units in zip code 43003 with a mortgage: 726 (70 second mortgage, 3 home equity loan, 65 both second mortgage and home equity loan) Houses without a mortgage: 99
Median monthly owner costs for units with a mortgage: $1,381 Median monthly owner costs for units without a mortgage: $553
Residents with income below the poverty level in 2022:
This zip code:
12.9%
Whole state:
13.4%
Residents with income below 50% of the poverty level in 2022:
This zip code:
7.4%
Whole state:
7.0%
Median number of rooms in houses and condos:
Here:
6.2
State:
6.7
Median number of rooms in apartments:
Here:
5.0
State:
4.4
Notable locations in this zip code not listed on our city pages
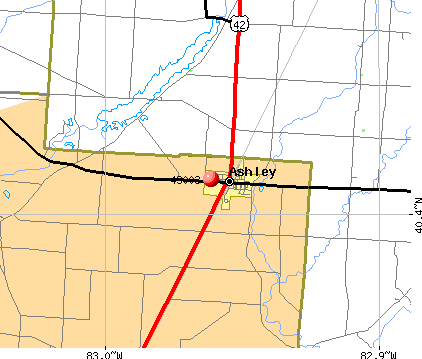
Notable locations in zip code 43003: Bartlett Corners (A), Elm Valley Joint Fire District (B), Wornstaff Memorial Public Library (C). Display/hide their locations on the map
Churches in zip code 43003 include: Westfield United Methodist Church (A), Ashley United Methodist Church (B), The Gospel Lighthouse (C). Display/hide their locations on the map
Cemeteries: Ashley Union Cemetery (1), East Oxford Cemetery (2), Elliott Cemetery (3), Gavitt Cemetery (4), West Oxford Cemetery (5), Mounds Cemetery (6), Peak Cemetery (7). Display/hide their locations on the map
In group quarters: 12 (-1 institutionalized population)
Size of family households: 470 2-persons, 183 3-persons, 63 4-persons, 178 5-persons, 3 6-persons
Size of nonfamily households: 348 1-person, 61 2-persons, 10 3-persons
219 married couples with children.
231 single-parent households (72 men, 159 women).
98.3% of residents of 43003 zip code speak English at home.
0.9% of residents speak Spanish at home (100% very well).
0.2% of residents speak other language at home (100% very well).
Foreign born population: 22 (0.7%) (68.6% of them are naturalized citizens)
This zip code:
0.7%
Whole state:
5.0%
73%Honduras
27%Cabo Verde
26%American
19%German
11%English
9%Irish
7%French
4%European
4%Scottish
Year of entry for the foreign-born population
82010 or later
142000 to 2009
01990 to 1999
30Before 1990
Facilities with environmental interests located in this zip code:
ASHLEY WWTP (PO BOX 361 in ASHLEY, OH)
STATE MASTER (Ohio general info) - PCS-OH0054488, National Pollutant Discharge Elimination System Permit National Pollutant Discharge Elimination System NON-MAJOR (Tracking pollutant discharge elimination systems) - permit National Pollutant Discharge Elimination System NON-MAJOR (Tracking pollutant discharge elimination systems) - permit Business SIC classification: SEWERAGE SYSTEMS Organizations: VILLAGE OF ASHLEY (CONTACT/OWNER)
, ASHLEY, VILLAGE OF (CONTACT/OWNER)
Alternative names: ASHLEY STP, ASHLEY, VILLAGE OF, VILLAGE OF ASHLEY
CENTRAL OHIO FARMERS COOP (1ST E HIGH ST in ASHLEY, OH)
COMPLIANCE ACTIVITY (Tracking inspections of insecticide, fungicide, and rodenticide, and toxic substances)
Housing units lacking complete plumbing facilities: 2.7% Housing units lacking complete kitchen facilities: 3.1%
31.3%Utility gas
30.6%Electricity
27.3%Bottled, tank, or LP gas
4.5%Fuel oil, kerosene, etc.
3.6%Other fuel
2.9%Wood
Population in 1990: 3,009.
Place of birth for U.S.-born residents:
This state: 2,413
Northeast: 153
Midwest: 173
South: 172
West: 166
65% of the 43003 zip code residents lived in the same house 5 years ago. Out of people who lived in different houses, 54% lived in this county. Out of people who lived in different counties, 50% lived in Ohio.
94% of the 43003 zip code residents lived in the same house 1 year ago. Out of people who lived in different houses, 63% moved from this county. Out of people who lived in different houses, 39% moved from different county within same state.
Private vs. public school enrollment:
Students in private schools in grades 1 to 8 (elementary and middle school): 16
Here:
5.8%
Ohio:
16.0%
Students in private schools in grades 9 to 12 (high school):
Here:
0.0%
Ohio:
13.1%
Students in private undergraduate colleges: 25
Here:
23.6%
Ohio:
22.3%
Occupation by median earnings in the past 12 months ($)
87,169Building and grounds cleaning and maintenance occupations
77,605Business and financial operations occupations
73,786Transportation occupations
66,512Health technologists and technicians
61,727Architecture and engineering occupations
58,152Education, training, and library occupations
Top industries in this zip code by the number of employees in 2005:
Health Care and Social Assistance: Home Health Care Services (20-49 employees: 1 establishment)
Accommodation and Food Services: Full-Service Restaurants (10-19: 1)
Other Services (except Public Administration): Grantmaking Foundations (10-19: 1)
Administrative and Support and Waste Management and Remediation Services: Landscaping Services (5-9: 2)
Health Care and Social Assistance: Homes for the Elderly (5-9: 1, 1-4: 1)
Other Services (except Public Administration): General Automotive Repair (5-9: 1)
Wholesale Trade: Motor Vehicle Parts (Used) Merchant Wholesalers (5-9: 1)
Finance and Insurance: Commercial Banking (5-9: 1)
People in group quarters in 2010:
14 people in group homes intended for adults
People in group quarters in 2000:
10 people in other group homes
Fatal accident statistics in 2014:
Fatal accident count: 1
Vehicles involved in fatal accidents: 1
Fatal accidents caused by drunken drivers: 0
Fatalities: 3
Persons involved in fatal accidents: 4
Pedestrians involved in fatal accidents: 0
Fatal accident statistics in 2012:
Fatal accident count: 3
Vehicles involved in fatal accidents: 4
Fatal accidents caused by drunken drivers: 2
Fatalities: 3
Persons involved in fatal accidents: 7
Pedestrians involved in fatal accidents: 0
Home Mortgage Disclosure Act Aggregated Statistics For Year 2009 (Based on 4 partial tracts)
A) FHA, FSA/RHS & VA Home Purchase Loans
B) Conventional Home Purchase Loans
C) Refinancings
D) Home Improvement Loans
F) Non-occupant Loans on < 5 Family Dwellings (A B C & D)
G) Loans On Manufactured Home Dwelling (A B C & D)
Number
Average Value
Number
Average Value
Number
Average Value
Number
Average Value
Number
Average Value
Number
Average Value
LOANS ORIGINATED
13
$132,182
10
$162,604
81
$166,376
2
$32,975
2
$161,835
3
$83,480
APPLICATIONS APPROVED, NOT ACCEPTED
1
$233,310
1
$50,460
6
$183,172
0
$0
0
$0
0
$0
APPLICATIONS DENIED
3
$90,573
4
$92,022
38
$171,969
3
$17,380
1
$51,270
2
$79,450
APPLICATIONS WITHDRAWN
3
$91,390
2
$174,585
15
$176,282
0
$0
0
$0
0
$0
FILES CLOSED FOR INCOMPLETENESS
1
$84,330
0
$0
5
$154,576
0
$0
0
$0
0
$0
Aggregated Statistics For Year 2008 (Based on 4 partial tracts)
A) FHA, FSA/RHS & VA Home Purchase Loans
B) Conventional Home Purchase Loans
C) Refinancings
D) Home Improvement Loans
F) Non-occupant Loans on < 5 Family Dwellings (A B C & D)
G) Loans On Manufactured Home Dwelling (A B C & D)
Number
Average Value
Number
Average Value
Number
Average Value
Number
Average Value
Number
Average Value
Number
Average Value
LOANS ORIGINATED
16
$120,499
14
$161,306
42
$153,379
9
$28,846
4
$100,612
6
$81,703
APPLICATIONS APPROVED, NOT ACCEPTED
0
$0
2
$126,220
8
$155,754
2
$11,830
0
$0
0
$0
APPLICATIONS DENIED
4
$105,740
5
$103,114
37
$154,629
9
$65,850
1
$140,160
4
$103,405
APPLICATIONS WITHDRAWN
1
$59,420
2
$172,630
15
$157,353
2
$51,290
1
$94,590
0
$0
FILES CLOSED FOR INCOMPLETENESS
0
$0
0
$0
2
$261,185
0
$0
0
$0
0
$0
Aggregated Statistics For Year 2007 (Based on 4 partial tracts)
A) FHA, FSA/RHS & VA Home Purchase Loans
B) Conventional Home Purchase Loans
C) Refinancings
D) Home Improvement Loans
F) Non-occupant Loans on < 5 Family Dwellings (A B C & D)
G) Loans On Manufactured Home Dwelling (A B C & D)
Number
Average Value
Number
Average Value
Number
Average Value
Number
Average Value
Number
Average Value
Number
Average Value
LOANS ORIGINATED
7
$128,626
37
$159,071
58
$148,966
15
$58,412
9
$111,992
6
$103,117
APPLICATIONS APPROVED, NOT ACCEPTED
0
$0
7
$153,586
11
$146,931
1
$10,280
1
$116,340
1
$74,790
APPLICATIONS DENIED
1
$148,310
14
$113,535
60
$147,503
13
$76,841
4
$143,372
5
$75,302
APPLICATIONS WITHDRAWN
0
$0
5
$119,752
22
$135,074
0
$0
1
$120,040
0
$0
FILES CLOSED FOR INCOMPLETENESS
0
$0
1
$187,180
5
$198,578
1
$46,920
0
$0
0
$0
Aggregated Statistics For Year 2006 (Based on 4 partial tracts)
A) FHA, FSA/RHS & VA Home Purchase Loans
B) Conventional Home Purchase Loans
C) Refinancings
D) Home Improvement Loans
F) Non-occupant Loans on < 5 Family Dwellings (A B C & D)
G) Loans On Manufactured Home Dwelling (A B C & D)
Number
Average Value
Number
Average Value
Number
Average Value
Number
Average Value
Number
Average Value
Number
Average Value
LOANS ORIGINATED
8
$139,974
51
$137,808
78
$135,765
12
$51,115
8
$104,001
10
$80,414
APPLICATIONS APPROVED, NOT ACCEPTED
1
$158,950
6
$99,025
18
$130,523
2
$54,760
2
$66,780
2
$43,065
APPLICATIONS DENIED
3
$130,073
15
$90,935
69
$130,312
10
$50,033
1
$263,320
8
$70,511
APPLICATIONS WITHDRAWN
1
$68,940
7
$140,243
31
$163,144
2
$135,695
1
$79,550
0
$0
FILES CLOSED FOR INCOMPLETENESS
0
$0
2
$131,235
10
$187,308
0
$0
0
$0
0
$0
Aggregated Statistics For Year 2005 (Based on 4 partial tracts)
A) FHA, FSA/RHS & VA Home Purchase Loans
B) Conventional Home Purchase Loans
C) Refinancings
D) Home Improvement Loans
F) Non-occupant Loans on < 5 Family Dwellings (A B C & D)
G) Loans On Manufactured Home Dwelling (A B C & D)
Number
Average Value
Number
Average Value
Number
Average Value
Number
Average Value
Number
Average Value
Number
Average Value
LOANS ORIGINATED
8
$133,230
51
$147,705
104
$133,253
14
$77,041
7
$98,761
6
$86,143
APPLICATIONS APPROVED, NOT ACCEPTED
0
$0
7
$137,853
22
$138,387
3
$57,183
1
$39,470
3
$43,917
APPLICATIONS DENIED
2
$111,390
21
$89,680
80
$143,723
13
$74,658
3
$61,270
11
$71,179
APPLICATIONS WITHDRAWN
0
$0
9
$115,476
47
$145,033
5
$246,940
1
$139,480
2
$75,505
FILES CLOSED FOR INCOMPLETENESS
0
$0
1
$365,150
10
$166,309
0
$0
0
$0
1
$77,450
Aggregated Statistics For Year 2004 (Based on 4 partial tracts)
A) FHA, FSA/RHS & VA Home Purchase Loans
B) Conventional Home Purchase Loans
C) Refinancings
D) Home Improvement Loans
F) Non-occupant Loans on < 5 Family Dwellings (A B C & D)
G) Loans On Manufactured Home Dwelling (A B C & D)
Number
Average Value
Number
Average Value
Number
Average Value
Number
Average Value
Number
Average Value
Number
Average Value
LOANS ORIGINATED
9
$115,173
50
$134,148
110
$126,171
16
$42,547
9
$95,680
6
$87,012
APPLICATIONS APPROVED, NOT ACCEPTED
1
$119,770
7
$110,909
19
$122,085
2
$63,875
0
$0
2
$106,730
APPLICATIONS DENIED
2
$108,560
18
$102,442
73
$117,021
13
$37,379
5
$148,614
9
$60,281
APPLICATIONS WITHDRAWN
1
$60,360
7
$125,457
42
$115,505
3
$69,770
1
$201,740
3
$62,727
FILES CLOSED FOR INCOMPLETENESS
0
$0
3
$145,817
8
$120,028
1
$13,350
0
$0
0
$0
Aggregated Statistics For Year 2003 (Based on 2 partial tracts)
A) FHA, FSA/RHS & VA Home Purchase Loans
B) Conventional Home Purchase Loans
C) Refinancings
D) Home Improvement Loans
F) Non-occupant Loans on < 5 Family Dwellings (A B C & D)
Number
Average Value
Number
Average Value
Number
Average Value
Number
Average Value
Number
Average Value
LOANS ORIGINATED
2
$134,535
27
$166,353
144
$152,505
9
$70,948
3
$135,773
APPLICATIONS APPROVED, NOT ACCEPTED
1
$85,540
2
$217,915
24
$141,783
1
$22,760
1
$68,770
APPLICATIONS DENIED
0
$0
4
$63,075
34
$131,822
5
$27,410
1
$150,470
APPLICATIONS WITHDRAWN
0
$0
2
$140,405
20
$158,771
0
$0
0
$0
FILES CLOSED FOR INCOMPLETENESS
0
$0
0
$0
4
$118,422
0
$0
0
$0
Aggregated Statistics For Year 2002 (Based on 2 partial tracts)
A) FHA, FSA/RHS & VA Home Purchase Loans
B) Conventional Home Purchase Loans
C) Refinancings
D) Home Improvement Loans
F) Non-occupant Loans on < 5 Family Dwellings (A B C & D)
Number
Average Value
Number
Average Value
Number
Average Value
Number
Average Value
Number
Average Value
LOANS ORIGINATED
7
$137,736
23
$146,187
108
$143,123
8
$30,130
3
$157,177
APPLICATIONS APPROVED, NOT ACCEPTED
0
$0
2
$126,630
17
$128,144
3
$29,150
0
$0
APPLICATIONS DENIED
1
$163,890
2
$100,510
27
$113,286
3
$23,320
0
$0
APPLICATIONS WITHDRAWN
0
$0
3
$103,827
23
$129,020
1
$79,070
0
$0
FILES CLOSED FOR INCOMPLETENESS
1
$89,850
1
$153,340
7
$118,294
0
$0
0
$0
Aggregated Statistics For Year 2001 (Based on 2 partial tracts)
A) FHA, FSA/RHS & VA Home Purchase Loans
B) Conventional Home Purchase Loans
C) Refinancings
D) Home Improvement Loans
F) Non-occupant Loans on < 5 Family Dwellings (A B C & D)
Number
Average Value
Number
Average Value
Number
Average Value
Number
Average Value
Number
Average Value
LOANS ORIGINATED
9
$160,399
26
$131,273
80
$130,399
7
$31,627
2
$124,115
APPLICATIONS APPROVED, NOT ACCEPTED
1
$116,210
3
$116,447
12
$148,172
1
$16,050
0
$0
APPLICATIONS DENIED
1
$94,880
9
$87,613
31
$119,290
3
$29,310
1
$182,100
APPLICATIONS WITHDRAWN
0
$0
2
$182,455
20
$128,090
0
$0
1
$114,050
FILES CLOSED FOR INCOMPLETENESS
0
$0
0
$0
3
$140,727
0
$0
0
$0
Aggregated Statistics For Year 2000 (Based on 2 partial tracts)
A) FHA, FSA/RHS & VA Home Purchase Loans
B) Conventional Home Purchase Loans
C) Refinancings
D) Home Improvement Loans
F) Non-occupant Loans on < 5 Family Dwellings (A B C & D)
Number
Average Value
Number
Average Value
Number
Average Value
Number
Average Value
Number
Average Value
LOANS ORIGINATED
9
$128,851
21
$130,548
26
$109,580
7
$27,726
2
$65,410
APPLICATIONS APPROVED, NOT ACCEPTED
0
$0
4
$59,780
10
$96,583
2
$14,375
0
$0
APPLICATIONS DENIED
1
$141,840
13
$59,568
15
$77,199
5
$20,558
1
$50,560
APPLICATIONS WITHDRAWN
0
$0
2
$151,070
5
$81,368
0
$0
0
$0
FILES CLOSED FOR INCOMPLETENESS
0
$0
0
$0
0
$0
0
$0
0
$0
Aggregated Statistics For Year 1999 (Based on 1 partial tract)
A) FHA, FSA/RHS & VA Home Purchase Loans
B) Conventional Home Purchase Loans
C) Refinancings
D) Home Improvement Loans
F) Non-occupant Loans on < 5 Family Dwellings (A B C & D)
Detailed PMIC statistics for the following Tracts:0111.00
, 9853.00
2002 - 2018 National Fire Incident Reporting System (NFIRS) incidents
Based on the data from the years 2002 - 2018 the average number of fire incidents per year is 31. The highest number of reported fire incidents - 54 took place in 2006, and the least - 14 in 2018. The data has a decreasing trend.
When looking into fire subcategories, the most incidents belonged to: Structure Fires (50.0%), and Outside Fires (38.6%).
Fire incident types reported to NFIRS in Zip Code 43003


+$3,034
-$3,706
 Nearest zip codes: 43356, 43032, 43315, 43015, 43321, 43334.


 Based on the data from the years 2002 - 2018 the average number of fire incidents per year is 31. The highest number of reported fire incidents - 54 took place in 2006, and the least - 14 in 2018. The data has a decreasing trend.
 When looking into fire subcategories, the most incidents belonged to: Structure Fires (50.0%), and Outside Fires (38.6%).