Estimated zip code population in 2022: 1,357 Zip code population in 2010: 1,591 Zip code population in 2000: 1,537
Houses and condos: 488 Renter-occupied apartments: 43
% of renters here:
10%
State:
33%
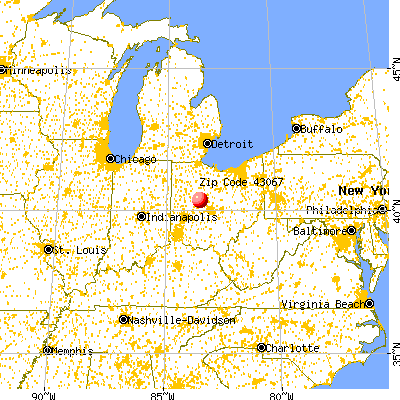
March 2022 cost of living index in zip code 43067: 83.5 (less than average, U.S. average is 100)
Land area: 31.2 sq. mi. Water area: 0.5 sq. mi.
Population density: 43 people per square mile
(very low).
OSM Map
General Map
Google Map
MSN Map
OSM Map
General Map
Google Map
MSN Map
OSM Map
General Map
Google Map
MSN Map
OSM Map
General Map
Google Map
MSN Map
Please wait while loading the map...
Real estate property taxes paid for housing units in 2022:
This zip code:
1.0% ($2,585)
Ohio:
1.3% ($2,639)
Median real estate property taxes paid for housing units with mortgages in 2022: $2,571 (0.7%) Median real estate property taxes paid for housing units with no mortgage in 2022: $2,681 (1.0%)
Business Search- 14 Million verified businesses
Males: 679
(50.0%)
Females: 678
(50.0%)
For population 25 years and over in 43067:
High school or higher: 86.0%
Bachelor's degree or higher: 19.9%
Graduate or professional degree: 5.7%
Unemployed: 1.4%
Mean travel time to work (commute): 26.4 minutes
For population 15 years and over in 43067:
Never married: 29.8%
Now married: 52.1%
Separated: 0.9%
Widowed: 6.9%
Divorced: 10.3%
Zip code 43067 compared to state average:
Unemployed percentage below state average.
Black race population percentage below state average.
Hispanic race population percentage significantly below state average.
Foreign-born population percentage significantly below state average.
Renting percentage significantly below state average.
Length of stay since moving in significantly below state average.
Percentage of population with a bachelor's degree or higher below state average.
Estimated median house/condo value in 2022: $267,568
43067:
$267,568
Ohio:
$204,100
According to our research of Ohio and other state lists, there was 1 registered sex offender living in 43067 zip code as of May 28, 2024. The ratio of all residents to sex offenders in zip code 43067 is 1,380 to 1. The ratio of registered sex offenders to all residents in this zip code is lower than the state average.
Median resident age:
This zip code:
42.4 years
Ohio median age:
39.9 years
Average household size:
This zip code:
3.0 people
Ohio:
2.4 people
Averages for the 2020 tax year for zip code 43067, filed in 2021:
Average Adjusted Gross Income (AGI) in 2020: $66,205 (Individual Income Tax Returns)
Here:
$66,205
State:
$67,288
Salary/wage: $60,967 (reported on 81.1% of returns)
Here:
$60,967
State:
$55,628
(% of AGI for various income ranges: 1127.1% for AGIs below $25k, 3650.0% for AGIs $25k-50k, 6642.2% for AGIs $50k-75k, 8255.7% for AGIs $75k-100k, 18865.0% for AGIs $100k-200k)
Taxable interest for individuals: $570 (reported on 31.1% of returns)
This zip code:
$570
Ohio:
$1,518
(% of AGI for various income ranges: 14.3% for AGIs below $25k, 15.0% for AGIs $25k-50k, 3.3% for AGIs $50k-75k, 57.1% for AGIs $75k-100k, 50.0% for AGIs $100k-200k)
Ordinary dividends: $931 (reported on 17.6% of returns)
Here:
$931
State:
$7,167
(% of AGI for various income ranges: 15.8% for AGIs $25k-50k, 15.6% for AGIs $50k-75k, 57.1% for AGIs $75k-100k, 48.0% for AGIs $100k-200k)
Net capital gain/loss in AGI: +$3,370 (reported on 13.5% of returns)
Here:
+$3,370
State:
+$18,919
(% of AGI for various income ranges: 16.4% for AGIs below $25k, 78.9% for AGIs $50k-75k, 243.0% for AGIs $100k-200k)
Profit/loss from business: +$11,900 (reported on 14.9% of returns)
Here:
+$11,900
State:
+$13,744
(% of AGI for various income ranges: 139.3% for AGIs below $25k, 209.2% for AGIs $25k-50k, 422.2% for AGIs $50k-75k, 483.0% for AGIs $100k-200k)
Taxable individual retirement arrangement distribution: $22,850 (reported on 8.1% of returns)
43067:
$22,850
Ohio:
$18,876
(% of AGI for various income ranges: 132.1% for AGIs below $25k, 566.7% for AGIs $50k-75k, 676.0% for AGIs $100k-200k)
Total itemized deductions: $26,475 (reported on 5.4% of returns)
Here:
$26,475
State:
$33,869
(% of AGI for various income ranges: 345.8% for AGIs $25k-50k, 644.0% for AGIs $100k-200k)
Charity contributions: $8,400 (reported on 4.1% of returns)
Here:
$8,400
State:
$14,577
(% of AGI for various income ranges: 280.0% for AGIs $50k-75k)
Taxes paid: $8,425 (reported on 5.4% of returns)
43067:
$8,425
State:
$7,681
(% of AGI for various income ranges: 105.0% for AGIs $25k-50k, 211.0% for AGIs $100k-200k)
Earned income credit: $2,457 (reported on 9.5% of returns)
Here:
$2,457
State:
$2,304
(% of AGI for various income ranges: 68.6% for AGIs below $25k, 63.3% for AGIs $25k-50k)
Percentage of individuals using paid preparers for their 2020 taxes: 94.6%
Here:
95%
State:
94%
(% for various income ranges: 95.0% for AGIs below $25k, 88.2% for AGIs $25k-50k, 100.0% for AGIs $50k-75k, 100.0% for AGIs $75k-100k, 107.1% for AGIs $100k-200k, 0.0% for AGIs over 200k)
Averages for the 2012 tax year for zip code 43067, filed in 2013:
Average Adjusted Gross Income (AGI) in 2012: $54,186 (Individual Income Tax Returns)
Here:
$54,186
State:
$54,926
Salary/wage: $48,010 (reported on 88.2% of returns)
Here:
$48,010
State:
$45,869
(% of AGI for various income ranges: 79.3% for AGIs below $25k, 78.6% for AGIs $25k-50k, 88.2% for AGIs $50k-75k, 84.2% for AGIs $75k-100k, 69.1% for AGIs $100k-200k)
Taxable interest for individuals: $364 (reported on 28.9% of returns)
This zip code:
$364
Ohio:
$1,297
(% of AGI for various income ranges: 0.7% for AGIs below $25k, 0.2% for AGIs $25k-50k, 0.2% for AGIs $50k-75k, 0.1% for AGIs $75k-100k, 0.1% for AGIs $100k-200k)
Ordinary dividends: $400 (reported on 21.1% of returns)
Here:
$400
State:
$5,821
(% of AGI for various income ranges: 0.3% for AGIs $25k-50k, 0.1% for AGIs $50k-75k, 0.2% for AGIs $75k-100k, 0.1% for AGIs $100k-200k)
Net capital gain/loss in AGI: +$271 (reported on 9.2% of returns)
Here:
+$271
State:
+$11,232
(% of AGI for various income ranges: 0.6% for AGIs $75k-100k)
Profit/loss from business: +$8,642 (reported on 15.8% of returns)
Here:
+$8,642
State:
+$12,773
(% of AGI for various income ranges: 5.7% for AGIs below $25k, 3.0% for AGIs $25k-50k, 1.6% for AGIs $50k-75k, 1.1% for AGIs $75k-100k, 2.9% for AGIs $100k-200k)
Taxable individual retirement arrangement distribution: $8,383 (reported on 7.9% of returns)
43067:
$8,383
Ohio:
$14,511
(% of AGI for various income ranges: 4.0% for AGIs $25k-50k, 2.9% for AGIs $50k-75k)
Total itemized deductions: $16,319 (18% of AGI, reported on 34.2% of returns)
Here:
$16,319
State:
$21,278
Here:
18.5% of AGI
State:
18.8% of AGI
(% of AGI for various income ranges: 11.7% for AGIs $25k-50k, 9.7% for AGIs $50k-75k, 11.2% for AGIs $75k-100k, 11.6% for AGIs $100k-200k)
Charity contributions: $2,733 (reported on 19.7% of returns)
Here:
$2,733
State:
$3,943
(% of AGI for various income ranges: 1.0% for AGIs below $25k, 0.8% for AGIs $50k-75k, 1.2% for AGIs $75k-100k, 1.4% for AGIs $100k-200k)
Taxes paid: $6,800 (reported on 34.2% of returns)
43067:
$6,800
State:
$9,568
(% of AGI for various income ranges: 2.9% for AGIs $25k-50k, 4.0% for AGIs $50k-75k, 4.5% for AGIs $75k-100k, 5.8% for AGIs $100k-200k)
Earned income credit: $2,218 (reported on 14.5% of returns)
Here:
$2,218
State:
$2,285
(% of AGI for various income ranges: 5.7% for AGIs below $25k, 1.1% for AGIs $25k-50k)
Percentage of individuals using paid preparers for their 2012 taxes: 52.6%
Here:
53%
State:
51%
(% for various income ranges: 38.5% for AGIs below $25k, 55.6% for AGIs $25k-50k, 61.5% for AGIs $50k-75k, 66.7% for AGIs $75k-100k, 60.0% for AGIs $100k-200k)
Averages for the 2004 tax year for zip code 43067, filed in 2005:
Average Adjusted Gross Income (AGI) in 2004: $46,285 (Individual Income Tax Returns)
Here:
$46,285
State:
$44,480
Salary/wage: $45,502 (reported on 90.8% of returns)
Here:
$45,502
State:
$39,198
(% of AGI for various income ranges: 108.2% for AGIs below $10k, 84.2% for AGIs $10k-25k, 88.1% for AGIs $25k-50k, 88.8% for AGIs $50k-75k, 93.6% for AGIs $75k-100k, 87.3% for AGIs over 100k)
Taxable interest for individuals: $457 (reported on 41.6% of returns)
This zip code:
$457
Ohio:
$1,532
(% of AGI for various income ranges: 2.9% for AGIs below $10k, 1.8% for AGIs $10k-25k, 0.4% for AGIs $25k-50k, 0.2% for AGIs $50k-75k, 0.1% for AGIs $75k-100k, 0.2% for AGIs over 100k)
Taxable dividends: $252 (reported on 18.3% of returns)
Here:
$252
State:
$3,496
(% of AGI for various income ranges: 1.0% for AGIs below $10k, 0.0% for AGIs $10k-25k, 0.1% for AGIs $25k-50k, 0.1% for AGIs $50k-75k, 0.1% for AGIs $75k-100k, 0.1% for AGIs over 100k)
Net capital gain/loss: +$3,282 (reported on 10.2% of returns)
Here:
+$3,282
State:
+$8,582
(% of AGI for various income ranges: 0.4% for AGIs below $10k, 0.9% for AGIs $25k-50k, 0.4% for AGIs $50k-75k, -0.1% for AGIs $75k-100k, 2.0% for AGIs over 100k)
Profit/loss from business: +$6,878 (reported on 14.1% of returns)
Here:
+$6,878
State:
+$10,813
(% of AGI for various income ranges: 3.1% for AGIs $10k-25k, 2.9% for AGIs $25k-50k, 2.1% for AGIs $50k-75k, 3.4% for AGIs $75k-100k)
Total itemized deductions: $14,515 (20% of AGI, reported on 39.4% of returns)
Here:
$14,515
State:
$17,503
Here:
19.8% of AGI
State:
20.8% of AGI
(% of AGI for various income ranges: 7.7% for AGIs $10k-25k, 8.9% for AGIs $25k-50k, 12.7% for AGIs $50k-75k, 16.8% for AGIs $75k-100k, 13.1% for AGIs over 100k)
Charity contributions deductions: $1,757 (2% of AGI, reported on 29.1% of returns)
Here:
$1,757
State:
$3,087
Here:
2.3% of AGI
State:
3.4% of AGI
(% of AGI for various income ranges: 0.5% for AGIs $10k-25k, 0.8% for AGIs $25k-50k, 1.0% for AGIs $50k-75k, 1.4% for AGIs $75k-100k, 1.4% for AGIs over 100k)
Total tax: $5,564 (reported on 81.9% of returns)
43067:
$5,564
State:
$6,781
(% of AGI for various income ranges: 2.3% for AGIs below $10k, 4.0% for AGIs $10k-25k, 6.8% for AGIs $25k-50k, 9.7% for AGIs $50k-75k, 10.1% for AGIs $75k-100k, 14.9% for AGIs over 100k)
Earned income credit: $1,274 (reported on 10.5% of returns)
Here:
$1,274
State:
$1,696
Percentage of individuals using paid preparers for their 2004 taxes: 57.1%
Here:
57%
State:
55%
(% for various income ranges: 43.8% for AGIs below $10k, 52.4% for AGIs $10k-25k, 65.4% for AGIs $25k-50k, 62.3% for AGIs $50k-75k, 53.2% for AGIs $75k-100k, 62.3% for AGIs over 100k)
Likely homosexual households (counted as self-reported same-sex unmarried-partner households)
Lesbian couples: 4.2% of all households
Gay men: 0.0% of all households
Household received Food Stamps/SNAP in the past 12 months: 12 Household did not receive Food Stamps/SNAP in the past 12 months: 437
Women who had a birth in the past 12 months: 11 (12 now married, 0 unmarried) Women who did not have a birth in the past 12 months: 294 (125 now married, 168 unmarried)
Housing units in zip code 43067 with a mortgage: 354 (47 second mortgage, 41 both second mortgage and home equity loan) Houses without a mortgage: 13
Median monthly owner costs for units with a mortgage: $1,383 Median monthly owner costs for units without a mortgage: $895
Residents with income below the poverty level in 2022:
This zip code:
16.9%
Whole state:
13.4%
Residents with income below 50% of the poverty level in 2022:
This zip code:
7.6%
Whole state:
7.0%
Median number of rooms in houses and condos:
Here:
6.9
State:
6.7
Median number of rooms in apartments:
Here:
5.4
State:
4.4
Notable locations in this zip code not listed on our city pages
Notable locations in zip code 43067: Day Lay Egg Farm (A), Mad River Egg Farm (B), Liberty Township Fire and Emergency Medical Services Department (C). Display/hide their locations on the map
Size of family households: 170 2-persons, 23 3-persons, 82 4-persons, 58 5-persons, 27 6-persons
Size of nonfamily households: 75 1-person, 11 3-persons
316 married couples with children.
0 single-parent households ().
98.6% of residents of 43067 zip code speak English at home.
1.5% of residents speak other Indo-European language at home (100% very well).
Foreign born population: 8 (0.6%) (0.0% of them are naturalized citizens)
:
0.6%
Whole state:
5.0%
88%Sweden
88%England
42%German
25%American
25%English
6%Scottish
1%Irish
1%Welsh
1%Canadian
Year of entry for the foreign-born population
02010 or later
02000 to 2009
01990 to 1999
12Before 1990
Housing units lacking complete plumbing facilities: 2.6% Housing units lacking complete kitchen facilities: 4.0%
74.5%Bottled, tank, or LP gas
15.6%Electricity
8.6%Other fuel
1.6%Fuel oil, kerosene, etc.
Population in 1990: 576. Population change in the 1990s: +961 (+166.8%).
Place of birth for U.S.-born residents:
This state: 1,118
Northeast: 26
Midwest: 10
South: 159
West: 24
65% of the 43067 zip code residents lived in the same house 5 years ago. Out of people who lived in different houses, 38% lived in this county. Out of people who lived in different counties, 50% lived in Ohio.
97% of the 43067 zip code residents lived in the same house 1 year ago. Out of people who lived in different houses, 85% moved from different county within same state. Out of people who lived in different houses, 42% moved from different state.
Private vs. public school enrollment:
Students in private schools in grades 1 to 8 (elementary and middle school): 33
Here:
27.1%
Ohio:
16.0%
Students in private schools in grades 9 to 12 (high school): 29
Here:
37.2%
Ohio:
13.1%
Students in private undergraduate colleges:
Here:
0.0%
Ohio:
22.3%
Occupation by median earnings in the past 12 months ($)
71,973Office and administrative support occupations
62,340Computer and mathematical occupations
56,402Sales and related occupations
53,314Management occupations
52,657Production occupations
24,848Material moving occupations
Top industries in this zip code by the number of employees in 2005:
Professional, Scientific, and Technical Services: Research and Development in the Physical, Engineering, and Life Sciences (500-999 employees: 1 establishment)
Construction: Plumbing, Heating, and Air-Conditioning Contractors (10-19: 1)
Accommodation and Food Services: Food Service Contractors (10-19: 1)
Other Services (except Public Administration): Automotive Body, Paint, and Interior Repair and Maintenance (10-19: 1)
Professional, Scientific, and Technical Services: Other Computer Related Services (10-19: 1)
Administrative and Support and Waste Management and Remediation Services: Janitorial Services (5-9: 1)
Construction: Masonry Contractors (5-9: 1)
Fatal accident statistics in 2014:
Fatal accident count: 1
Vehicles involved in fatal accidents: 3
Fatal accidents caused by drunken drivers: 0
Fatalities: 1
Persons involved in fatal accidents: 4
Pedestrians involved in fatal accidents: 0
Home Mortgage Disclosure Act Aggregated Statistics For Year 2009 (Based on 4 partial tracts)
A) FHA, FSA/RHS & VA Home Purchase Loans
B) Conventional Home Purchase Loans
C) Refinancings
D) Home Improvement Loans
F) Non-occupant Loans on < 5 Family Dwellings (A B C & D)
G) Loans On Manufactured Home Dwelling (A B C & D)
Number
Average Value
Number
Average Value
Number
Average Value
Number
Average Value
Number
Average Value
Number
Average Value
LOANS ORIGINATED
37
$153,065
22
$143,781
140
$155,416
9
$65,042
7
$83,740
4
$114,060
APPLICATIONS APPROVED, NOT ACCEPTED
2
$158,150
2
$162,195
14
$136,241
1
$78,290
0
$0
1
$132,890
APPLICATIONS DENIED
7
$144,049
4
$105,130
48
$158,656
6
$30,308
1
$126,860
3
$78,277
APPLICATIONS WITHDRAWN
3
$130,813
1
$194,030
21
$187,200
2
$82,570
0
$0
0
$0
FILES CLOSED FOR INCOMPLETENESS
0
$0
0
$0
3
$144,407
0
$0
0
$0
0
$0
Aggregated Statistics For Year 2008 (Based on 4 partial tracts)
A) FHA, FSA/RHS & VA Home Purchase Loans
B) Conventional Home Purchase Loans
C) Refinancings
D) Home Improvement Loans
F) Non-occupant Loans on < 5 Family Dwellings (A B C & D)
G) Loans On Manufactured Home Dwelling (A B C & D)
Number
Average Value
Number
Average Value
Number
Average Value
Number
Average Value
Number
Average Value
Number
Average Value
LOANS ORIGINATED
28
$153,665
40
$153,136
77
$135,611
9
$34,350
9
$75,336
7
$91,870
APPLICATIONS APPROVED, NOT ACCEPTED
1
$260,370
6
$226,342
10
$158,883
1
$19,040
1
$44,080
0
$0
APPLICATIONS DENIED
6
$133,020
7
$118,040
57
$154,591
10
$47,993
1
$123,630
4
$75,320
APPLICATIONS WITHDRAWN
1
$194,780
5
$101,762
20
$137,888
1
$102,400
1
$87,830
0
$0
FILES CLOSED FOR INCOMPLETENESS
0
$0
1
$241,810
3
$149,360
0
$0
0
$0
1
$102,180
Aggregated Statistics For Year 2007 (Based on 4 partial tracts)
A) FHA, FSA/RHS & VA Home Purchase Loans
B) Conventional Home Purchase Loans
C) Refinancings
D) Home Improvement Loans
F) Non-occupant Loans on < 5 Family Dwellings (A B C & D)
G) Loans On Manufactured Home Dwelling (A B C & D)
Number
Average Value
Number
Average Value
Number
Average Value
Number
Average Value
Number
Average Value
Number
Average Value
LOANS ORIGINATED
13
$148,952
76
$148,449
78
$131,293
21
$42,621
7
$88,619
6
$85,797
APPLICATIONS APPROVED, NOT ACCEPTED
2
$179,685
11
$144,077
20
$126,964
2
$56,800
1
$134,410
2
$84,515
APPLICATIONS DENIED
3
$139,470
19
$132,928
80
$136,604
12
$61,218
4
$99,915
4
$88,922
APPLICATIONS WITHDRAWN
1
$173,320
6
$136,763
34
$146,563
3
$48,083
1
$149,700
3
$95,147
FILES CLOSED FOR INCOMPLETENESS
0
$0
1
$96,330
8
$205,275
0
$0
0
$0
0
$0
Aggregated Statistics For Year 2006 (Based on 4 partial tracts)
A) FHA, FSA/RHS & VA Home Purchase Loans
B) Conventional Home Purchase Loans
C) Refinancings
D) Home Improvement Loans
F) Non-occupant Loans on < 5 Family Dwellings (A B C & D)
G) Loans On Manufactured Home Dwelling (A B C & D)
Number
Average Value
Number
Average Value
Number
Average Value
Number
Average Value
Number
Average Value
Number
Average Value
LOANS ORIGINATED
18
$152,205
90
$130,805
91
$122,986
28
$40,431
12
$94,358
6
$91,340
APPLICATIONS APPROVED, NOT ACCEPTED
2
$152,370
10
$143,796
19
$134,151
4
$37,122
1
$108,270
1
$73,040
APPLICATIONS DENIED
2
$195,390
24
$103,369
88
$125,935
20
$43,366
4
$65,498
8
$87,295
APPLICATIONS WITHDRAWN
2
$155,435
12
$114,571
37
$134,178
4
$77,605
1
$96,330
0
$0
FILES CLOSED FOR INCOMPLETENESS
0
$0
2
$92,060
13
$137,439
1
$46,790
0
$0
0
$0
Aggregated Statistics For Year 2005 (Based on 4 partial tracts)
A) FHA, FSA/RHS & VA Home Purchase Loans
B) Conventional Home Purchase Loans
C) Refinancings
D) Home Improvement Loans
F) Non-occupant Loans on < 5 Family Dwellings (A B C & D)
G) Loans On Manufactured Home Dwelling (A B C & D)
Number
Average Value
Number
Average Value
Number
Average Value
Number
Average Value
Number
Average Value
Number
Average Value
LOANS ORIGINATED
18
$154,676
122
$124,330
120
$132,838
24
$42,218
8
$77,929
7
$86,480
APPLICATIONS APPROVED, NOT ACCEPTED
2
$177,260
17
$113,466
22
$133,574
6
$41,625
3
$66,270
2
$98,760
APPLICATIONS DENIED
5
$149,802
19
$103,408
104
$126,949
22
$37,262
4
$100,190
8
$78,106
APPLICATIONS WITHDRAWN
3
$149,340
14
$122,900
63
$138,982
8
$139,642
2
$133,320
2
$91,750
FILES CLOSED FOR INCOMPLETENESS
1
$124,060
4
$120,910
19
$146,314
1
$24,990
1
$42,690
0
$0
Aggregated Statistics For Year 2004 (Based on 4 partial tracts)
A) FHA, FSA/RHS & VA Home Purchase Loans
B) Conventional Home Purchase Loans
C) Refinancings
D) Home Improvement Loans
F) Non-occupant Loans on < 5 Family Dwellings (A B C & D)
G) Loans On Manufactured Home Dwelling (A B C & D)
Detailed PMIC statistics for the following Tracts:0502.00
, 0503.00
2002 - 2018 National Fire Incident Reporting System (NFIRS) incidents
Based on the data from the years 2002 - 2018 the average number of fire incidents per year is 21. The highest number of fire incidents - 35 took place in 2009, and the least - 9 in 2011. The data has an increasing trend.
When looking into fire subcategories, the most incidents belonged to: Structure Fires (49.4%), and Outside Fires (40.0%).
Fire incident types reported to NFIRS in Zip Code 43067


 Nearest zip codes: 43358, 43319, 43336, 43040, 43344, 43060.


 Based on the data from the years 2002 - 2018 the average number of fire incidents per year is 21. The highest number of fire incidents - 35 took place in 2009, and the least - 9 in 2011. The data has an increasing trend.
 When looking into fire subcategories, the most incidents belonged to: Structure Fires (49.4%), and Outside Fires (40.0%).