Estimated zip code population in 2022: 4,031 Zip code population in 2010: 4,512 Zip code population in 2000: 3,886
Houses and condos: 1,636 Renter-occupied apartments: 251
% of renters here:
16%
State:
33%
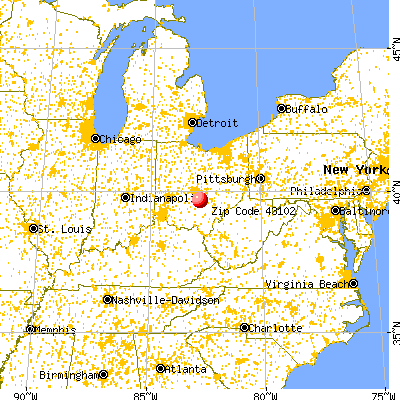
March 2022 cost of living index in zip code 43102: 83.7 (less than average, U.S. average is 100)
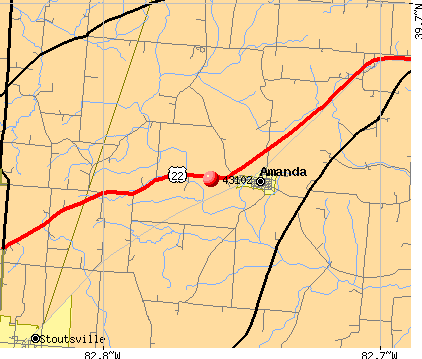
Land area: 59.4 sq. mi. Water area: 0.1 sq. mi.
Population density: 68 people per square mile
(very low).
OSM Map
General Map
Google Map
MSN Map
OSM Map
General Map
Google Map
MSN Map
OSM Map
General Map
Google Map
MSN Map
OSM Map
General Map
Google Map
MSN Map
Please wait while loading the map...
Real estate property taxes paid for housing units in 2022:
This zip code:
0.9% ($2,207)
Ohio:
1.3% ($2,639)
Median real estate property taxes paid for housing units with mortgages in 2022: $2,193 (0.9%) Median real estate property taxes paid for housing units with no mortgage in 2022: $2,267 (1.1%)
Estimated median house/condo value in 2022: $238,172
43102:
$238,172
Ohio:
$204,100
According to our research of Ohio and other state lists, there were 4 registered sex offenders living in 43102 zip code as of May 28, 2024. The ratio of all residents to sex offenders in zip code 43102 is 1,231 to 1. The ratio of registered sex offenders to all residents in this zip code is lower than the state average.
Median resident age:
This zip code:
45.4 years
Ohio median age:
39.9 years
Average household size:
This zip code:
2.5 people
Ohio:
2.4 people
Averages for the 2020 tax year for zip code 43102, filed in 2021:
Average Adjusted Gross Income (AGI) in 2020: $67,515 (Individual Income Tax Returns)
Here:
$67,515
State:
$67,288
Salary/wage: $54,786 (reported on 83.0% of returns)
Here:
$54,786
State:
$55,628
(% of AGI for various income ranges: 1128.5% for AGIs below $25k, 3520.5% for AGIs $25k-50k, 6829.6% for AGIs $50k-75k, 9627.9% for AGIs $75k-100k, 15952.2% for AGIs $100k-200k)
Taxable interest for individuals: $952 (reported on 23.9% of returns)
This zip code:
$952
Ohio:
$1,518
(% of AGI for various income ranges: 12.2% for AGIs below $25k, 11.4% for AGIs $25k-50k, 17.0% for AGIs $50k-75k, 57.4% for AGIs $75k-100k, 57.0% for AGIs $100k-200k)
Ordinary dividends: $8,293 (reported on 12.8% of returns)
Here:
$8,293
State:
$7,167
(% of AGI for various income ranges: 7.6% for AGIs below $25k, 16.7% for AGIs $25k-50k, 19.3% for AGIs $50k-75k, 61.6% for AGIs $75k-100k, 166.1% for AGIs $100k-200k)
Net capital gain/loss in AGI: +$13,537 (reported on 12.4% of returns)
Here:
+$13,537
State:
+$18,919
(% of AGI for various income ranges: 31.0% for AGIs below $25k, 34.3% for AGIs $25k-50k, 32.6% for AGIs $50k-75k, 140.5% for AGIs $75k-100k, 539.6% for AGIs $100k-200k)
Profit/loss from business: +$14,200 (reported on 15.1% of returns)
Here:
+$14,200
State:
+$13,744
(% of AGI for various income ranges: 102.0% for AGIs below $25k, 172.9% for AGIs $25k-50k, 265.2% for AGIs $50k-75k, 313.2% for AGIs $75k-100k, 970.0% for AGIs $100k-200k)
Taxable individual retirement arrangement distribution: $18,007 (reported on 6.9% of returns)
43102:
$18,007
Ohio:
$18,876
(% of AGI for various income ranges: 49.3% for AGIs below $25k, 75.5% for AGIs $25k-50k, 163.0% for AGIs $50k-75k, 238.4% for AGIs $75k-100k, 560.4% for AGIs $100k-200k)
Total itemized deductions: $29,940 (reported on 4.6% of returns)
Here:
$29,940
State:
$33,869
(% of AGI for various income ranges: 320.0% for AGIs $50k-75k, 926.1% for AGIs $100k-200k)
Charity contributions: $8,975 (reported on 3.7% of returns)
Here:
$8,975
State:
$14,577
(% of AGI for various income ranges: 41.9% for AGIs $50k-75k, 263.0% for AGIs $100k-200k)
Taxes paid: $7,520 (reported on 4.6% of returns)
43102:
$7,520
State:
$7,681
(% of AGI for various income ranges: 88.9% for AGIs $50k-75k, 222.6% for AGIs $100k-200k)
Earned income credit: $2,124 (reported on 13.3% of returns)
Here:
$2,124
State:
$2,304
(% of AGI for various income ranges: 82.0% for AGIs below $25k, 66.7% for AGIs $25k-50k)
Percentage of individuals using paid preparers for their 2020 taxes: 94.5%
Here:
94%
State:
94%
(% for various income ranges: 91.5% for AGIs below $25k, 94.2% for AGIs $25k-50k, 94.7% for AGIs $50k-75k, 96.3% for AGIs $75k-100k, 97.3% for AGIs $100k-200k, 100.0% for AGIs over 200k)
Averages for the 2012 tax year for zip code 43102, filed in 2013:
Average Adjusted Gross Income (AGI) in 2012: $50,500 (Individual Income Tax Returns)
Here:
$50,500
State:
$54,926
Salary/wage: $45,040 (reported on 85.1% of returns)
Here:
$45,040
State:
$45,869
(% of AGI for various income ranges: 73.1% for AGIs below $25k, 81.1% for AGIs $25k-50k, 85.0% for AGIs $50k-75k, 77.7% for AGIs $75k-100k, 66.1% for AGIs $100k-200k)
Taxable interest for individuals: $723 (reported on 27.9% of returns)
This zip code:
$723
Ohio:
$1,297
(% of AGI for various income ranges: 0.9% for AGIs below $25k, 0.5% for AGIs $25k-50k, 0.3% for AGIs $50k-75k, 0.3% for AGIs $75k-100k, 0.3% for AGIs $100k-200k)
Ordinary dividends: $2,938 (reported on 11.9% of returns)
Here:
$2,938
State:
$5,821
(% of AGI for various income ranges: 0.6% for AGIs below $25k, 0.3% for AGIs $25k-50k, 0.4% for AGIs $50k-75k, 0.2% for AGIs $75k-100k, 1.4% for AGIs $100k-200k)
Net capital gain/loss in AGI: +$4,769 (reported on 8.0% of returns)
Here:
+$4,769
State:
+$11,232
(% of AGI for various income ranges: 0.2% for AGIs $25k-50k, 1.2% for AGIs $75k-100k, 1.5% for AGIs $100k-200k)
Profit/loss from business: +$8,300 (reported on 14.4% of returns)
Here:
+$8,300
State:
+$12,773
(% of AGI for various income ranges: 8.2% for AGIs below $25k, 1.9% for AGIs $25k-50k, 1.6% for AGIs $50k-75k, 2.2% for AGIs $75k-100k, 1.8% for AGIs $100k-200k)
Taxable individual retirement arrangement distribution: $11,275 (reported on 8.0% of returns)
43102:
$11,275
Ohio:
$14,511
(% of AGI for various income ranges: 2.4% for AGIs below $25k, 2.5% for AGIs $25k-50k, 0.6% for AGIs $50k-75k, 1.8% for AGIs $75k-100k, 2.1% for AGIs $100k-200k)
Total itemized deductions: $18,891 (21% of AGI, reported on 28.9% of returns)
Here:
$18,891
State:
$21,278
Here:
21.5% of AGI
State:
18.8% of AGI
(% of AGI for various income ranges: 6.0% for AGIs below $25k, 6.9% for AGIs $25k-50k, 10.7% for AGIs $50k-75k, 10.9% for AGIs $75k-100k, 14.2% for AGIs $100k-200k)
Charity contributions: $2,661 (reported on 20.4% of returns)
Here:
$2,661
State:
$3,943
(% of AGI for various income ranges: 0.6% for AGIs $25k-50k, 1.0% for AGIs $50k-75k, 1.0% for AGIs $75k-100k, 1.7% for AGIs $100k-200k)
Taxes paid: $6,890 (reported on 28.9% of returns)
43102:
$6,890
State:
$9,568
(% of AGI for various income ranges: 0.7% for AGIs below $25k, 1.9% for AGIs $25k-50k, 3.5% for AGIs $50k-75k, 4.2% for AGIs $75k-100k, 6.1% for AGIs $100k-200k)
Earned income credit: $2,290 (reported on 15.4% of returns)
Here:
$2,290
State:
$2,285
(% of AGI for various income ranges: 6.4% for AGIs below $25k, 0.9% for AGIs $25k-50k)
Percentage of individuals using paid preparers for their 2012 taxes: 54.2%
Here:
54%
State:
51%
(% for various income ranges: 47.8% for AGIs below $25k, 56.0% for AGIs $25k-50k, 59.5% for AGIs $50k-75k, 54.2% for AGIs $75k-100k, 61.9% for AGIs $100k-200k)
Averages for the 2004 tax year for zip code 43102, filed in 2005:
Average Adjusted Gross Income (AGI) in 2004: $40,201 (Individual Income Tax Returns)
Here:
$40,201
State:
$44,480
Salary/wage: $37,108 (reported on 87.9% of returns)
Here:
$37,108
State:
$39,198
(% of AGI for various income ranges: 103.9% for AGIs below $10k, 75.5% for AGIs $10k-25k, 85.8% for AGIs $25k-50k, 85.5% for AGIs $50k-75k, 88.2% for AGIs $75k-100k, 58.8% for AGIs over 100k)
Taxable interest for individuals: $861 (reported on 39.7% of returns)
This zip code:
$861
Ohio:
$1,532
(% of AGI for various income ranges: 10.3% for AGIs below $10k, 2.1% for AGIs $10k-25k, 0.7% for AGIs $25k-50k, 0.4% for AGIs $50k-75k, 0.5% for AGIs $75k-100k, 0.7% for AGIs over 100k)
Taxable dividends: $1,036 (reported on 14.4% of returns)
Here:
$1,036
State:
$3,496
(% of AGI for various income ranges: 2.3% for AGIs below $10k, 0.3% for AGIs $10k-25k, 0.3% for AGIs $25k-50k, 0.5% for AGIs $50k-75k, 0.1% for AGIs $75k-100k, 0.3% for AGIs over 100k)
Net capital gain/loss: +$4,904 (reported on 10.2% of returns)
Here:
+$4,904
State:
+$8,582
(% of AGI for various income ranges: -1.0% for AGIs below $10k, 0.0% for AGIs $10k-25k, 0.5% for AGIs $25k-50k, 0.3% for AGIs $50k-75k, 1.5% for AGIs $75k-100k, 4.8% for AGIs over 100k)
Profit/loss from business: +$6,548 (reported on 16.3% of returns)
Here:
+$6,548
State:
+$10,813
(% of AGI for various income ranges: 22.7% for AGIs below $10k, 7.6% for AGIs $10k-25k, 3.0% for AGIs $25k-50k, 1.7% for AGIs $50k-75k, -0.3% for AGIs $75k-100k, 2.0% for AGIs over 100k)
IRA payment deduction: $2,281 (reported on 1.7% of returns)
43102:
$2,281
Ohio:
$2,794
Total itemized deductions: $14,881 (22% of AGI, reported on 31.7% of returns)
Here:
$14,881
State:
$17,503
Here:
22.5% of AGI
State:
20.8% of AGI
(% of AGI for various income ranges: 13.8% for AGIs below $10k, 6.5% for AGIs $10k-25k, 11.1% for AGIs $25k-50k, 11.7% for AGIs $50k-75k, 14.5% for AGIs $75k-100k, 12.6% for AGIs over 100k)
Charity contributions deductions: $2,011 (3% of AGI, reported on 24.0% of returns)
Here:
$2,011
State:
$3,087
Here:
2.8% of AGI
State:
3.4% of AGI
(% of AGI for various income ranges: 0.4% for AGIs $10k-25k, 0.8% for AGIs $25k-50k, 1.3% for AGIs $50k-75k, 1.8% for AGIs $75k-100k, 1.8% for AGIs over 100k)
Total tax: $4,760 (reported on 78.5% of returns)
43102:
$4,760
State:
$6,781
(% of AGI for various income ranges: 6.2% for AGIs below $10k, 4.5% for AGIs $10k-25k, 6.6% for AGIs $25k-50k, 8.6% for AGIs $50k-75k, 9.9% for AGIs $75k-100k, 17.6% for AGIs over 100k)
Earned income credit: $1,738 (reported on 14.6% of returns)
Here:
$1,738
State:
$1,696
Percentage of individuals using paid preparers for their 2004 taxes: 56.7%
Here:
57%
State:
55%
(% for various income ranges: 49.9% for AGIs below $10k, 59.5% for AGIs $10k-25k, 58.1% for AGIs $25k-50k, 59.0% for AGIs $50k-75k, 49.4% for AGIs $75k-100k, 67.1% for AGIs over 100k)
Likely homosexual households (counted as self-reported same-sex unmarried-partner households)
Lesbian couples: 0.2% of all households
Gay men: 0.0% of all households
Household received Food Stamps/SNAP in the past 12 months: 131 Household did not receive Food Stamps/SNAP in the past 12 months: 1,445
Women who had a birth in the past 12 months: 28 (20 now married, 8 unmarried) Women who did not have a birth in the past 12 months: 854 (374 now married, 480 unmarried)
Housing units in zip code 43102 with a mortgage: 811 (45 second mortgage, 46 both second mortgage and home equity loan) Houses without a mortgage: 114
Median monthly owner costs for units with a mortgage: $1,434 Median monthly owner costs for units without a mortgage: $540
Residents with income below the poverty level in 2022:
This zip code:
9.1%
Whole state:
13.4%
Residents with income below 50% of the poverty level in 2022:
This zip code:
6.5%
Whole state:
7.0%
Median number of rooms in houses and condos:
Here:
6.3
State:
6.7
Median number of rooms in apartments:
Here:
5.9
State:
4.4
Notable locations in this zip code not listed on our city pages
Notable locations in zip code 43102: Fairfield Sanitary Landfill (A), Albert Family Tree Farm (B), Ruff Seed Farms (C), Amanda Township Fire Department Station 520 (D). Display/hide their locations on the map
Churches in zip code 43102 include: Turkey Run Church (A), Zion Church (B), Amanda Presbyterian Church (C), Cedar Hill United Methodist Church (D), Bethany Church (E). Display/hide their locations on the map
Cemeteries: Augustus Cemetery (1), Zion Cemetery (2), Turkey Run Baptist Cemetery (3), Old Dutch Hollow Cemetery (4), Old Conrad Cemetery (5), New Dutch Hollow Cemetery (6), New Conrad Cemetery (7). Display/hide their locations on the map
Size of family households: 661 2-persons, 262 3-persons, 184 4-persons, 80 5-persons, 14 6-persons, 12 7-or-more-persons
Size of nonfamily households: 262 1-person, 71 2-persons, 26 3-persons
474 married couples with children.
188 single-parent households (29 men, 159 women).
98.1% of residents of 43102 zip code speak English at home.
1.0% of residents speak Spanish at home (100% very well).
0.2% of residents speak other Indo-European language at home (100% very well).
Foreign born population: 99 (2.5%) (78.7% of them are naturalized citizens)
This zip code:
2.5%
Whole state:
5.0%
14%Bulgaria
9%Azores Islands
7%Kazakhstan
30%American
17%German
17%English
6%Irish
4%Polish
4%Italian
3%Scottish
Year of entry for the foreign-born population
172010 or later
472000 to 2009
01990 to 1999
40Before 1990
Facilities with environmental interests located in this zip code:
AMANDA WWTP (116 EAST MAIN STREET in AMANDA, OH)
STATE MASTER (Ohio general info) - PCS-OH0048194, National Pollutant Discharge Elimination System Permit National Pollutant Discharge Elimination System NON-MAJOR (Tracking pollutant discharge elimination systems) - permit Business SIC classification: SEWERAGE SYSTEMS Organizations: AMANDA, VILLAGE OF (CONTACT/OWNER)
Alternative names: AMANDA, VILLAGE OF
BIGHAM S APARTMENTS (8514 ZIGZAG RD OFF OF OLD RTE in AMANDA, OH)
STATE MASTER (Ohio general info) - PCS-OH0124010, National Pollutant Discharge Elimination System Permit National Pollutant Discharge Elimination System NON-MAJOR (Tracking pollutant discharge elimination systems) - permit Business SIC classification: SEWERAGE SYSTEMS Alternative names: BIGHAM'S APARTMENTS
AMANDA ELEMENTARY SCHOOL (328 E MAIN ST in AMANDA, OH)
(Geographic Names Information System) (National Center for Education Statistics) - STATE ID-000539 Organizations: AMANDA-CLEARCREEK LOCAL SD (SCHOOL DISTRICT)
AMANDA CLEARCREEK DIGITAL ADMY (414 N SCHOOL ST in AMANDA, OH)
(National Center for Education Statistics) - STATE ID-149310
AMANDA-CLEARCREEK HIGH SCHOOL (328 E MAIN ST in AMANDA, OH)
(National Center for Education Statistics) - STATE ID-000562 Organizations: AMANDA-CLEARCREEK LOCAL SD (SCHOOL DISTRICT)
AMANDA-CLEARCREEK JUNIOR HIGH (328 E MAIN ST in AMANDA, OH)
(National Center for Education Statistics) - STATE ID-122069 Organizations: AMANDA-CLEARCREEK LOCAL SD (SCHOOL DISTRICT)
ALBERT FAMILY FARM (7505 BUNKER HILL RD in AMANDA, OH)
COMPLIANCE ACTIVITY (Tracking inspections of insecticide, fungicide, and rodenticide, and toxic substances)
Housing units lacking complete plumbing facilities: 1.1% Housing units lacking complete kitchen facilities: 0.6%
34.6%Electricity
24.8%Bottled, tank, or LP gas
23.9%Utility gas
8.4%Wood
4.3%Fuel oil, kerosene, etc.
4.3%Other fuel
Population in 1990: 3,730. Population change in the 1990s: +156 (+4.2%).
Place of birth for U.S.-born residents:
This state: 3,481
Northeast: 86
Midwest: 96
South: 219
West: 33
69% of the 43102 zip code residents lived in the same house 5 years ago. Out of people who lived in different houses, 58% lived in this county. Out of people who lived in different counties, 50% lived in Ohio.
98% of the 43102 zip code residents lived in the same house 1 year ago. Out of people who lived in different houses, 23% moved from this county. Out of people who lived in different houses, 107% moved from different county within same state.
Private vs. public school enrollment:
Students in private schools in grades 1 to 8 (elementary and middle school): 45
Here:
15.1%
Ohio:
16.0%
Students in private schools in grades 9 to 12 (high school): 77
Here:
30.0%
Ohio:
13.1%
Students in private undergraduate colleges: 78
Here:
40.7%
Ohio:
22.3%
Occupation by median earnings in the past 12 months ($)
98,070Computer and mathematical occupations
70,909Health diagnosing and treating practitioners and other technical occupations
66,893Architecture and engineering occupations
66,361Education, training, and library occupations
62,518Management occupations
58,255Transportation occupations
Top industries in this zip code by the number of employees in 2005:
Administrative and Support and Waste Management and Remediation Services: Solid Waste Collection (10-19 employees: 1 establishment)
Other Services (except Public Administration): Religious Organizations (5-9: 1, 1-4: 4)
Educational Services: Elementary and Secondary Schools (10-19: 1)
Construction: New Single-Family Housing Construction (except Operative Builders) (5-9: 1, 1-4: 2)
Administrative and Support and Waste Management and Remediation Services: Landscaping Services (5-9: 1, 1-4: 1)
Finance and Insurance: Commercial Banking (5-9: 1)
Fatal accident statistics in 2013:
Fatal accident count: 1
Vehicles involved in fatal accidents: 1
Fatal accidents caused by drunken drivers: 1
Fatalities: 1
Persons involved in fatal accidents: 1
Pedestrians involved in fatal accidents: 0
Fatal accident statistics in 2012:
Fatal accident count: 1
Vehicles involved in fatal accidents: 2
Fatal accidents caused by drunken drivers: 0
Fatalities: 1
Persons involved in fatal accidents: 2
Pedestrians involved in fatal accidents: 0
Home Mortgage Disclosure Act Aggregated Statistics For Year 2009 (Based on 4 partial tracts)
A) FHA, FSA/RHS & VA Home Purchase Loans
B) Conventional Home Purchase Loans
C) Refinancings
D) Home Improvement Loans
F) Non-occupant Loans on < 5 Family Dwellings (A B C & D)
G) Loans On Manufactured Home Dwelling (A B C & D)
Number
Average Value
Number
Average Value
Number
Average Value
Number
Average Value
Number
Average Value
Number
Average Value
LOANS ORIGINATED
36
$114,680
46
$123,681
198
$145,672
10
$23,796
18
$52,358
9
$77,491
APPLICATIONS APPROVED, NOT ACCEPTED
4
$115,708
2
$132,850
23
$135,306
0
$0
0
$0
4
$91,312
APPLICATIONS DENIED
4
$142,085
10
$106,064
107
$155,513
7
$51,489
5
$48,108
5
$70,958
APPLICATIONS WITHDRAWN
7
$105,494
7
$66,629
42
$154,504
2
$132,420
1
$18,460
1
$110,760
FILES CLOSED FOR INCOMPLETENESS
0
$0
0
$0
8
$156,858
2
$6,815
0
$0
0
$0
Aggregated Statistics For Year 2008 (Based on 4 partial tracts)
A) FHA, FSA/RHS & VA Home Purchase Loans
B) Conventional Home Purchase Loans
C) Refinancings
D) Home Improvement Loans
F) Non-occupant Loans on < 5 Family Dwellings (A B C & D)
G) Loans On Manufactured Home Dwelling (A B C & D)
Number
Average Value
Number
Average Value
Number
Average Value
Number
Average Value
Number
Average Value
Number
Average Value
LOANS ORIGINATED
29
$123,609
49
$129,507
120
$133,407
25
$39,059
10
$51,391
13
$78,639
APPLICATIONS APPROVED, NOT ACCEPTED
6
$98,575
4
$124,278
21
$132,403
3
$71,953
1
$38,130
3
$98,553
APPLICATIONS DENIED
7
$103,803
9
$114,688
146
$125,051
24
$61,971
3
$275,127
19
$85,351
APPLICATIONS WITHDRAWN
10
$126,599
8
$141,102
37
$143,314
3
$63,017
3
$57,173
4
$84,085
FILES CLOSED FOR INCOMPLETENESS
0
$0
1
$208,340
9
$149,674
0
$0
0
$0
0
$0
Aggregated Statistics For Year 2007 (Based on 4 partial tracts)
A) FHA, FSA/RHS & VA Home Purchase Loans
B) Conventional Home Purchase Loans
C) Refinancings
D) Home Improvement Loans
E) Loans on Dwellings For 5+ Families
F) Non-occupant Loans on < 5 Family Dwellings (A B C & D)
G) Loans On Manufactured Home Dwelling (A B C & D)
Number
Average Value
Number
Average Value
Number
Average Value
Number
Average Value
Number
Average Value
Number
Average Value
Number
Average Value
LOANS ORIGINATED
20
$123,412
91
$137,338
136
$129,445
37
$54,335
1
$89,660
17
$95,890
19
$85,940
APPLICATIONS APPROVED, NOT ACCEPTED
2
$61,590
13
$89,329
41
$127,907
7
$65,011
0
$0
0
$0
2
$113,525
APPLICATIONS DENIED
0
$0
35
$119,034
214
$121,740
31
$42,190
0
$0
9
$79,966
18
$88,353
APPLICATIONS WITHDRAWN
3
$126,587
7
$144,671
48
$154,156
5
$69,844
0
$0
3
$88,787
3
$106,730
FILES CLOSED FOR INCOMPLETENESS
0
$0
4
$94,610
13
$133,830
1
$193,830
0
$0
0
$0
0
$0
Aggregated Statistics For Year 2006 (Based on 4 partial tracts)
A) FHA, FSA/RHS & VA Home Purchase Loans
B) Conventional Home Purchase Loans
C) Refinancings
D) Home Improvement Loans
F) Non-occupant Loans on < 5 Family Dwellings (A B C & D)
G) Loans On Manufactured Home Dwelling (A B C & D)
Number
Average Value
Number
Average Value
Number
Average Value
Number
Average Value
Number
Average Value
Number
Average Value
LOANS ORIGINATED
16
$123,581
144
$125,217
201
$120,174
32
$65,466
19
$105,445
20
$75,850
APPLICATIONS APPROVED, NOT ACCEPTED
6
$125,147
15
$108,401
54
$102,724
8
$54,942
2
$148,830
3
$80,580
APPLICATIONS DENIED
4
$119,995
35
$108,040
177
$119,339
33
$65,348
7
$83,449
14
$64,527
APPLICATIONS WITHDRAWN
2
$134,965
17
$113,523
66
$133,632
8
$88,254
2
$71,000
3
$121,337
FILES CLOSED FOR INCOMPLETENESS
1
$160,870
2
$105,445
35
$146,698
0
$0
0
$0
1
$137,130
Aggregated Statistics For Year 2005 (Based on 4 partial tracts)
A) FHA, FSA/RHS & VA Home Purchase Loans
B) Conventional Home Purchase Loans
C) Refinancings
D) Home Improvement Loans
F) Non-occupant Loans on < 5 Family Dwellings (A B C & D)
G) Loans On Manufactured Home Dwelling (A B C & D)
Number
Average Value
Number
Average Value
Number
Average Value
Number
Average Value
Number
Average Value
Number
Average Value
LOANS ORIGINATED
17
$142,731
128
$106,415
242
$131,256
43
$60,868
23
$93,907
37
$80,663
APPLICATIONS APPROVED, NOT ACCEPTED
4
$100,872
18
$91,906
49
$123,201
8
$31,828
3
$62,413
7
$53,239
APPLICATIONS DENIED
3
$115,557
45
$88,089
197
$132,826
42
$75,712
3
$197,333
23
$76,021
APPLICATIONS WITHDRAWN
3
$155,783
21
$118,884
90
$136,564
17
$197,097
3
$145,533
4
$95,575
FILES CLOSED FOR INCOMPLETENESS
1
$243,940
2
$73,355
25
$124,877
2
$90,690
1
$58,020
0
$0
Aggregated Statistics For Year 2004 (Based on 4 partial tracts)
A) FHA, FSA/RHS & VA Home Purchase Loans
B) Conventional Home Purchase Loans
C) Refinancings
D) Home Improvement Loans
E) Loans on Dwellings For 5+ Families
F) Non-occupant Loans on < 5 Family Dwellings (A B C & D)
G) Loans On Manufactured Home Dwelling (A B C & D)
Number
Average Value
Number
Average Value
Number
Average Value
Number
Average Value
Number
Average Value
Number
Average Value
Number
Average Value
LOANS ORIGINATED
5
$120,164
129
$126,223
263
$118,088
40
$49,560
0
$0
17
$74,289
22
$92,121
APPLICATIONS APPROVED, NOT ACCEPTED
1
$71,500
19
$92,921
80
$102,039
4
$29,562
1
$313,830
3
$59,777
6
$116,860
APPLICATIONS DENIED
7
$117,920
56
$89,350
218
$109,477
29
$76,893
0
$0
5
$77,828
34
$85,495
APPLICATIONS WITHDRAWN
2
$115,105
21
$121,964
129
$119,180
3
$54,013
0
$0
0
$0
9
$153,251
FILES CLOSED FOR INCOMPLETENESS
1
$204,380
3
$176,923
33
$120,343
0
$0
0
$0
0
$0
0
$0
Aggregated Statistics For Year 2003 (Based on 4 partial tracts)
A) FHA, FSA/RHS & VA Home Purchase Loans
B) Conventional Home Purchase Loans
C) Refinancings
D) Home Improvement Loans
F) Non-occupant Loans on < 5 Family Dwellings (A B C & D)
Number
Average Value
Number
Average Value
Number
Average Value
Number
Average Value
Number
Average Value
LOANS ORIGINATED
21
$108,691
134
$116,955
532
$114,106
43
$21,565
22
$99,828
APPLICATIONS APPROVED, NOT ACCEPTED
5
$138,190
23
$136,734
86
$109,275
3
$39,400
1
$79,120
APPLICATIONS DENIED
2
$75,315
27
$123,683
195
$111,062
23
$28,961
6
$73,638
APPLICATIONS WITHDRAWN
3
$108,447
11
$119,321
108
$101,998
2
$34,150
1
$36,170
FILES CLOSED FOR INCOMPLETENESS
1
$47,950
5
$91,224
24
$141,326
0
$0
1
$88,350
Aggregated Statistics For Year 2002 (Based on 4 partial tracts)
A) FHA, FSA/RHS & VA Home Purchase Loans
B) Conventional Home Purchase Loans
C) Refinancings
D) Home Improvement Loans
F) Non-occupant Loans on < 5 Family Dwellings (A B C & D)
Number
Average Value
Number
Average Value
Number
Average Value
Number
Average Value
Number
Average Value
LOANS ORIGINATED
27
$113,067
134
$110,378
422
$105,656
37
$15,823
13
$93,574
APPLICATIONS APPROVED, NOT ACCEPTED
4
$130,542
15
$89,736
84
$104,539
3
$40,070
1
$242,620
APPLICATIONS DENIED
8
$72,784
42
$80,087
180
$105,526
26
$11,493
3
$105,383
APPLICATIONS WITHDRAWN
2
$98,205
15
$111,711
108
$102,192
2
$67,050
4
$83,402
FILES CLOSED FOR INCOMPLETENESS
0
$0
0
$0
23
$120,752
0
$0
1
$102,850
Aggregated Statistics For Year 2001 (Based on 4 partial tracts)
A) FHA, FSA/RHS & VA Home Purchase Loans
B) Conventional Home Purchase Loans
C) Refinancings
D) Home Improvement Loans
F) Non-occupant Loans on < 5 Family Dwellings (A B C & D)
Number
Average Value
Number
Average Value
Number
Average Value
Number
Average Value
Number
Average Value
LOANS ORIGINATED
18
$106,233
102
$114,652
416
$105,129
42
$19,077
16
$83,934
APPLICATIONS APPROVED, NOT ACCEPTED
1
$196,470
23
$71,752
77
$106,413
7
$10,907
1
$137,120
APPLICATIONS DENIED
1
$50,110
52
$70,726
169
$95,526
24
$19,659
3
$91,210
APPLICATIONS WITHDRAWN
1
$121,310
19
$99,487
122
$96,593
12
$19,110
2
$30,605
FILES CLOSED FOR INCOMPLETENESS
0
$0
2
$53,370
24
$86,239
0
$0
0
$0
Aggregated Statistics For Year 2000 (Based on 4 partial tracts)
A) FHA, FSA/RHS & VA Home Purchase Loans
B) Conventional Home Purchase Loans
C) Refinancings
D) Home Improvement Loans
E) Loans on Dwellings For 5+ Families
F) Non-occupant Loans on < 5 Family Dwellings (A B C & D)
Number
Average Value
Number
Average Value
Number
Average Value
Number
Average Value
Number
Average Value
Number
Average Value
LOANS ORIGINATED
28
$101,026
89
$97,226
183
$91,476
65
$14,126
0
$0
14
$54,636
APPLICATIONS APPROVED, NOT ACCEPTED
9
$44,747
25
$68,631
72
$62,031
18
$15,278
0
$0
7
$65,424
APPLICATIONS DENIED
11
$63,370
50
$62,988
119
$77,036
41
$21,478
1
$79,120
5
$48,880
APPLICATIONS WITHDRAWN
4
$110,708
15
$99,517
66
$88,461
7
$42,683
0
$0
1
$184,600
FILES CLOSED FOR INCOMPLETENESS
0
$0
1
$19,070
17
$73,192
0
$0
0
$0
0
$0
Aggregated Statistics For Year 1999 (Based on 2 partial tracts)
A) FHA, FSA/RHS & VA Home Purchase Loans
B) Conventional Home Purchase Loans
C) Refinancings
D) Home Improvement Loans
F) Non-occupant Loans on < 5 Family Dwellings (A B C & D)
Detailed PMIC statistics for the following Tracts:0325.00
, 0326.00
2002 - 2018 National Fire Incident Reporting System (NFIRS) incidents
According to the data from the years 2002 - 2018 the average number of fire incidents per year is 49. The highest number of fire incidents - 78 took place in 2009, and the least - 26 in 2012. The data has a rising trend.
When looking into fire subcategories, the most reports belonged to: Structure Fires (56.7%), and Outside Fires (31.8%).
Fire incident types reported to NFIRS in Zip Code 43102


 Nearest zip codes: 43154, 43156, 43130, 43112, 43136, 43101.


 According to the data from the years 2002 - 2018 the average number of fire incidents per year is 49. The highest number of fire incidents - 78 took place in 2009, and the least - 26 in 2012. The data has a rising trend.
 When looking into fire subcategories, the most reports belonged to: Structure Fires (56.7%), and Outside Fires (31.8%).