Estimated zip code population in 2022: 12,811 Zip code population in 2010: 12,369 Zip code population in 2000: 13,280
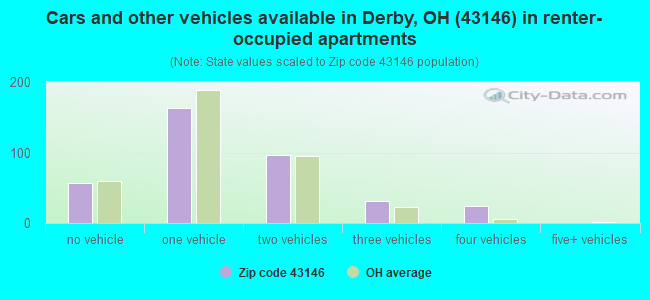
Houses and condos: 3,927 Renter-occupied apartments: 375
% of renters here:
10%
State:
33%
March 2022 cost of living index in zip code 43146: 95.1 (less than average, U.S. average is 100)
Land area: 79.8 sq. mi. Water area: 0.8 sq. mi.
Population density: 160 people per square mile
(very low).
OSM Map
General Map
Google Map
MSN Map
OSM Map
General Map
Google Map
MSN Map
OSM Map
General Map
Google Map
MSN Map
OSM Map
General Map
Google Map
MSN Map
Please wait while loading the map...
Real estate property taxes paid for housing units in 2022:
This zip code:
1.0% ($3,108)
Ohio:
1.3% ($2,639)
Median real estate property taxes paid for housing units with mortgages in 2022: $3,378 (1.0%) Median real estate property taxes paid for housing units with no mortgage in 2022: $2,278 (1.1%)
Business Search- 14 Million verified businesses
Males: 8,137
(63.5%)
Females: 4,676
(36.5%)
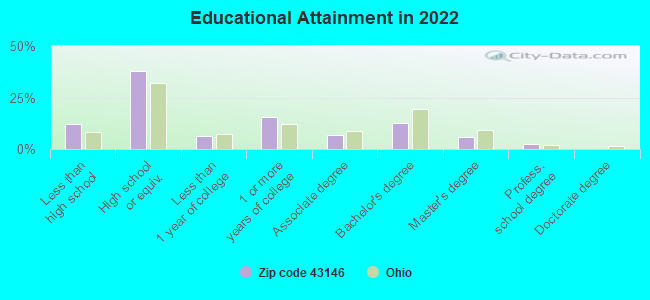
For population 25 years and over in 43146:
High school or higher: 86.8%
Bachelor's degree or higher: 20.8%
Graduate or professional degree: 8.3%
Unemployed: 1.2%
Mean travel time to work (commute): 27.5 minutes
For population 15 years and over in 43146:
Never married: 36.1%
Now married: 43.4%
Separated: 1.9%
Widowed: 4.6%
Divorced: 14.0%
Zip code 43146 compared to state average:
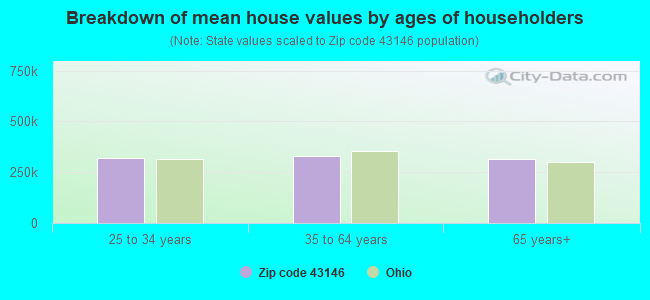
Median house value above state average.
Unemployed percentage significantly below state average.
Foreign-born population percentage significantly below state average.
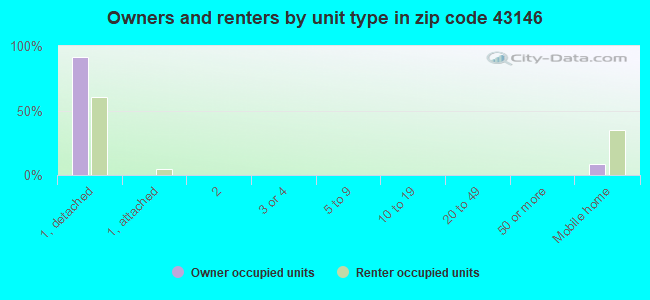
Renting percentage significantly below state average.
Length of stay since moving in above state average.
Estimated median house/condo value in 2022: $308,210
43146:
$308,210
Ohio:
$204,100
According to our research of Ohio and other state lists, there were 17 registered sex offenders living in 43146 zip code as of May 28, 2024. The ratio of all residents to sex offenders in zip code 43146 is 735 to 1. The ratio of registered sex offenders to all residents in this zip code is lower than the state average.
Median resident age:
This zip code:
40.3 years
Ohio median age:
39.9 years
Average household size:
This zip code:
2.5 people
Ohio:
2.4 people
Averages for the 2020 tax year for zip code 43146, filed in 2021:
Average Adjusted Gross Income (AGI) in 2020: $70,479 (Individual Income Tax Returns)
Here:
$70,479
State:
$67,288
Salary/wage: $65,478 (reported on 78.6% of returns)
Here:
$65,478
State:
$55,628
(% of AGI for various income ranges: 1135.5% for AGIs below $25k, 3422.6% for AGIs $25k-50k, 6601.8% for AGIs $50k-75k, 9845.1% for AGIs $75k-100k, 18632.2% for AGIs $100k-200k, 68894.0% for AGIs over 200k)
Taxable interest for individuals: $887 (reported on 28.4% of returns)
This zip code:
$887
Ohio:
$1,518
(% of AGI for various income ranges: 18.7% for AGIs below $25k, 18.8% for AGIs $25k-50k, 29.7% for AGIs $50k-75k, 32.9% for AGIs $75k-100k, 70.6% for AGIs $100k-200k, 468.0% for AGIs over 200k)
Ordinary dividends: $3,976 (reported on 15.5% of returns)
Here:
$3,976
State:
$7,167
(% of AGI for various income ranges: 15.7% for AGIs below $25k, 20.6% for AGIs $25k-50k, 41.5% for AGIs $50k-75k, 52.4% for AGIs $75k-100k, 187.6% for AGIs $100k-200k, 2478.0% for AGIs over 200k)
Net capital gain/loss in AGI: +$17,776 (reported on 13.9% of returns)
Here:
+$17,776
State:
+$18,919
(% of AGI for various income ranges: 8.7% for AGIs below $25k, 26.9% for AGIs $25k-50k, 52.2% for AGIs $50k-75k, 126.3% for AGIs $75k-100k, 367.5% for AGIs $100k-200k, 17500.0% for AGIs over 200k)
Profit/loss from business: +$17,068 (reported on 13.7% of returns)
Here:
+$17,068
State:
+$13,744
(% of AGI for various income ranges: 90.6% for AGIs below $25k, 186.5% for AGIs $25k-50k, 167.5% for AGIs $50k-75k, 300.2% for AGIs $75k-100k, 793.9% for AGIs $100k-200k, 5312.0% for AGIs over 200k)
Taxable individual retirement arrangement distribution: $15,655 (reported on 8.8% of returns)
43146:
$15,655
Ohio:
$18,876
(% of AGI for various income ranges: 63.9% for AGIs below $25k, 99.2% for AGIs $25k-50k, 213.0% for AGIs $50k-75k, 243.9% for AGIs $75k-100k, 594.3% for AGIs $100k-200k)
Total itemized deductions: $28,105 (reported on 8.0% of returns)
Here:
$28,105
State:
$33,869
(% of AGI for various income ranges: 137.3% for AGIs $25k-50k, 215.8% for AGIs $50k-75k, 406.8% for AGIs $75k-100k, 726.9% for AGIs $100k-200k, 5878.0% for AGIs over 200k)
Charity contributions: $10,978 (reported on 5.7% of returns)
Here:
$10,978
State:
$14,577
(% of AGI for various income ranges: 18.2% for AGIs below $25k, 21.2% for AGIs $50k-75k, 65.4% for AGIs $75k-100k, 199.4% for AGIs $100k-200k, 2824.0% for AGIs over 200k)
Taxes paid: $7,470 (reported on 7.8% of returns)
43146:
$7,470
State:
$7,681
(% of AGI for various income ranges: 25.8% for AGIs $25k-50k, 59.2% for AGIs $50k-75k, 127.8% for AGIs $75k-100k, 219.6% for AGIs $100k-200k, 1128.0% for AGIs over 200k)
Earned income credit: $2,110 (reported on 8.6% of returns)
Here:
$2,110
State:
$2,304
(% of AGI for various income ranges: 60.9% for AGIs below $25k, 50.8% for AGIs $25k-50k)
Percentage of individuals using paid preparers for their 2020 taxes: 89.3%
Here:
89%
State:
94%
(% for various income ranges: 76.0% for AGIs below $25k, 94.1% for AGIs $25k-50k, 94.1% for AGIs $50k-75k, 93.3% for AGIs $75k-100k, 94.4% for AGIs $100k-200k, 93.8% for AGIs over 200k)
Averages for the 2012 tax year for zip code 43146, filed in 2013:
Average Adjusted Gross Income (AGI) in 2012: $56,902 (Individual Income Tax Returns)
Here:
$56,902
State:
$54,926
Salary/wage: $49,827 (reported on 85.2% of returns)
Here:
$49,827
State:
$45,869
(% of AGI for various income ranges: 73.3% for AGIs below $25k, 75.7% for AGIs $25k-50k, 80.4% for AGIs $50k-75k, 78.4% for AGIs $75k-100k, 78.4% for AGIs $100k-200k, 50.2% for AGIs over 200k)
Taxable interest for individuals: $689 (reported on 28.5% of returns)
This zip code:
$689
Ohio:
$1,297
(% of AGI for various income ranges: 0.9% for AGIs below $25k, 0.4% for AGIs $25k-50k, 0.3% for AGIs $50k-75k, 0.2% for AGIs $75k-100k, 0.3% for AGIs $100k-200k, 0.3% for AGIs over 200k)
Ordinary dividends: $2,631 (reported on 15.3% of returns)
Here:
$2,631
State:
$5,821
(% of AGI for various income ranges: 0.8% for AGIs below $25k, 0.6% for AGIs $25k-50k, 0.4% for AGIs $50k-75k, 0.5% for AGIs $75k-100k, 0.8% for AGIs $100k-200k, 1.4% for AGIs over 200k)
Net capital gain/loss in AGI: +$1,672 (reported on 11.0% of returns)
Here:
+$1,672
State:
+$11,232
(% of AGI for various income ranges: 0.1% for AGIs $50k-75k, 0.3% for AGIs $75k-100k, 0.4% for AGIs $100k-200k, 1.1% for AGIs over 200k)
Profit/loss from business: +$7,803 (reported on 14.8% of returns)
Here:
+$7,803
State:
+$12,773
(% of AGI for various income ranges: 5.3% for AGIs below $25k, 2.5% for AGIs $25k-50k, 2.1% for AGIs $50k-75k, 2.0% for AGIs $75k-100k, 1.8% for AGIs $100k-200k)
Taxable individual retirement arrangement distribution: $14,080 (reported on 9.6% of returns)
43146:
$14,080
Ohio:
$14,511
(% of AGI for various income ranges: 3.4% for AGIs below $25k, 2.5% for AGIs $25k-50k, 1.9% for AGIs $50k-75k, 3.6% for AGIs $75k-100k, 2.7% for AGIs $100k-200k)
Total itemized deductions: $19,018 (21% of AGI, reported on 41.4% of returns)
Here:
$19,018
State:
$21,278
Here:
20.9% of AGI
State:
18.8% of AGI
(% of AGI for various income ranges: 10.2% for AGIs below $25k, 10.7% for AGIs $25k-50k, 14.7% for AGIs $50k-75k, 15.1% for AGIs $75k-100k, 16.0% for AGIs $100k-200k, 12.3% for AGIs over 200k)
Charity contributions: $2,966 (reported on 31.3% of returns)
Here:
$2,966
State:
$3,943
(% of AGI for various income ranges: 0.6% for AGIs below $25k, 1.2% for AGIs $25k-50k, 1.4% for AGIs $50k-75k, 1.7% for AGIs $75k-100k, 2.2% for AGIs $100k-200k, 1.7% for AGIs over 200k)
Taxes paid: $7,979 (reported on 41.4% of returns)
43146:
$7,979
State:
$9,568
(% of AGI for various income ranges: 2.1% for AGIs below $25k, 3.3% for AGIs $25k-50k, 5.4% for AGIs $50k-75k, 6.4% for AGIs $75k-100k, 7.9% for AGIs $100k-200k, 6.5% for AGIs over 200k)
Earned income credit: $2,235 (reported on 12.4% of returns)
Here:
$2,235
State:
$2,285
(% of AGI for various income ranges: 5.0% for AGIs below $25k, 0.9% for AGIs $25k-50k)
Percentage of individuals using paid preparers for their 2012 taxes: 49.5%
Here:
50%
State:
51%
(% for various income ranges: 44.6% for AGIs below $25k, 47.3% for AGIs $25k-50k, 56.0% for AGIs $50k-75k, 51.1% for AGIs $75k-100k, 52.0% for AGIs $100k-200k, 83.3% for AGIs over 200k)
Averages for the 2004 tax year for zip code 43146, filed in 2005:
Average Adjusted Gross Income (AGI) in 2004: $46,459 (Individual Income Tax Returns)
Here:
$46,459
State:
$44,480
Salary/wage: $41,625 (reported on 87.6% of returns)
Here:
$41,625
State:
$39,198
(% of AGI for various income ranges: 99.5% for AGIs below $10k, 70.5% for AGIs $10k-25k, 82.8% for AGIs $25k-50k, 85.5% for AGIs $50k-75k, 84.7% for AGIs $75k-100k, 62.2% for AGIs over 100k)
Taxable interest for individuals: $1,003 (reported on 42.5% of returns)
This zip code:
$1,003
Ohio:
$1,532
(% of AGI for various income ranges: 4.1% for AGIs below $10k, 2.0% for AGIs $10k-25k, 0.8% for AGIs $25k-50k, 0.7% for AGIs $50k-75k, 0.6% for AGIs $75k-100k, 1.1% for AGIs over 100k)
Taxable dividends: $1,534 (reported on 19.1% of returns)
Here:
$1,534
State:
$3,496
(% of AGI for various income ranges: 1.8% for AGIs below $10k, 0.7% for AGIs $10k-25k, 0.4% for AGIs $25k-50k, 0.3% for AGIs $50k-75k, 0.3% for AGIs $75k-100k, 1.5% for AGIs over 100k)
Net capital gain/loss: +$9,781 (reported on 14.1% of returns)
Here:
+$9,781
State:
+$8,582
(% of AGI for various income ranges: -0.6% for AGIs below $10k, 0.2% for AGIs $10k-25k, 0.3% for AGIs $25k-50k, 0.5% for AGIs $50k-75k, 1.3% for AGIs $75k-100k, 11.0% for AGIs over 100k)
Profit/loss from business: +$8,248 (reported on 13.9% of returns)
Here:
+$8,248
State:
+$10,813
(% of AGI for various income ranges: 8.4% for AGIs below $10k, 6.2% for AGIs $10k-25k, 2.7% for AGIs $25k-50k, 1.3% for AGIs $50k-75k, 2.5% for AGIs $75k-100k, 2.0% for AGIs over 100k)
Profit/loss from farming: +$832 (reported on 2.7% of returns)
Here:
+$832
State:
-$3,706
(% of AGI for various income ranges: -1.6% for AGIs below $10k, 0.1% for AGIs $25k-50k, 0.4% for AGIs $50k-75k, -0.2% for AGIs $75k-100k, 0.0% for AGIs over 100k)
IRA payment deduction: $2,841 (reported on 2.1% of returns)
43146:
$2,841
Ohio:
$2,794
(% of AGI for various income ranges: 0.2% for AGIs $10k-25k, 0.2% for AGIs $25k-50k, 0.2% for AGIs $50k-75k, 0.1% for AGIs $75k-100k)
Self-employed pension: $8,208 (reported on 0.6% of returns)
Here:
$8,208
Ohio:
$13,981
Total itemized deductions: $15,694 (23% of AGI, reported on 47.6% of returns)
Here:
$15,694
State:
$17,503
Here:
23.1% of AGI
State:
20.8% of AGI
(% of AGI for various income ranges: 14.9% for AGIs below $10k, 9.6% for AGIs $10k-25k, 15.9% for AGIs $25k-50k, 17.2% for AGIs $50k-75k, 18.5% for AGIs $75k-100k, 15.1% for AGIs over 100k)
Charity contributions deductions: $2,357 (3% of AGI, reported on 38.0% of returns)
Here:
$2,357
State:
$3,087
Here:
3.3% of AGI
State:
3.4% of AGI
(% of AGI for various income ranges: 0.6% for AGIs below $10k, 0.7% for AGIs $10k-25k, 1.6% for AGIs $25k-50k, 1.9% for AGIs $50k-75k, 2.3% for AGIs $75k-100k, 2.4% for AGIs over 100k)
Total tax: $5,869 (reported on 82.0% of returns)
43146:
$5,869
State:
$6,781
(% of AGI for various income ranges: 3.2% for AGIs below $10k, 4.7% for AGIs $10k-25k, 7.4% for AGIs $25k-50k, 9.0% for AGIs $50k-75k, 10.4% for AGIs $75k-100k, 17.1% for AGIs over 100k)
Earned income credit: $1,570 (reported on 9.0% of returns)
Here:
$1,570
State:
$1,696
Percentage of individuals using paid preparers for their 2004 taxes: 53.7%
Here:
54%
State:
55%
(% for various income ranges: 44.5% for AGIs below $10k, 53.6% for AGIs $10k-25k, 56.4% for AGIs $25k-50k, 55.3% for AGIs $50k-75k, 53.7% for AGIs $75k-100k, 57.0% for AGIs over 100k)
Household received Food Stamps/SNAP in the past 12 months: 290 Household did not receive Food Stamps/SNAP in the past 12 months: 3,406
Women who had a birth in the past 12 months: 57 (33 now married, 23 unmarried) Women who did not have a birth in the past 12 months: 1,851 (999 now married, 850 unmarried)
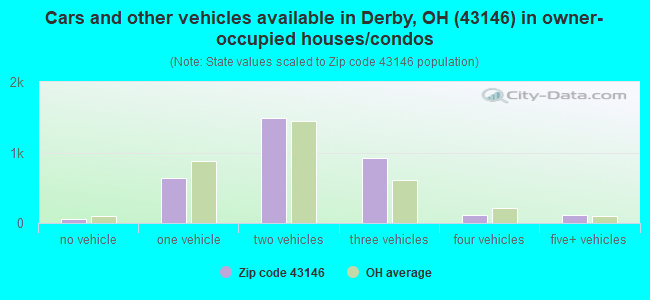
Housing units in zip code 43146 with a mortgage: 2,276 (337 second mortgage, 334 both second mortgage and home equity loan) Houses without a mortgage: 144
Median monthly owner costs for units with a mortgage: $1,766 Median monthly owner costs for units without a mortgage: $658
Residents with income below the poverty level in 2022:
This zip code:
6.1%
Whole state:
13.4%
Residents with income below 50% of the poverty level in 2022:
This zip code:
4.9%
Whole state:
7.0%
Median number of rooms in houses and condos:
Here:
6.7
State:
6.7
Median number of rooms in apartments:
Here:
4.4
State:
4.4
Notable locations in this zip code not listed on our city pages
Notable locations in zip code 43146: Fox Fire Golf Course (A), Tri - County Joint Fire District Station 492 (B), Orient Town Hall (C). Display/hide their locations on the map
Cemeteries: Scioto Cemetery (1), Seeds Cemetery (2), Gulick Cemetery (3), McKinley Cemetery (4), Orient Feeble Minded Institute Cemetery (5). Display/hide their locations on the map
Streams, rivers, and creeks: Greenbrier Creek (A), Hellbranch Run (B), Georges Run (C), Springwater Run (D), Lizard Run (E). Display/hide their locations on the map
In group quarters: 3,307 (-1 institutionalized population)
Size of family households: 1,465 2-persons, 662 3-persons, 545 4-persons, 162 5-persons, 46 6-persons, 55 7-or-more-persons
Size of nonfamily households: 663 1-person, 58 2-persons, 22 3-persons
1,589 married couples with children.
421 single-parent households (95 men, 326 women).
97.2% of residents of 43146 zip code speak English at home.
1.2% of residents speak Spanish at home (45% very well, 23% well, 23% not well, 10% not at all).
0.6% of residents speak other Indo-European language at home (94% very well, 6% not well).
0.3% of residents speak Asian or Pacific Island language at home (100% very well).
0.4% of residents speak other language at home (74% very well, 26% well).
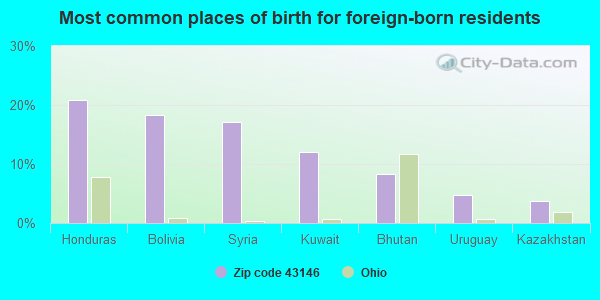
Foreign born population: 193 (1.5%) (76.9% of them are naturalized citizens)
This zip code:
1.5%
Whole state:
5.0%
21%Honduras
18%Bolivia
17%Syria
12%Kuwait
8%Bhutan
5%Uruguay
4%Kazakhstan
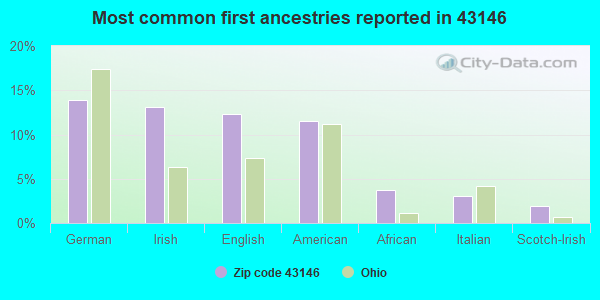
14%German
13%Irish
12%English
12%American
4%African
3%Italian
2%Scotch-Irish
Year of entry for the foreign-born population
952010 or later
682000 to 2009
131990 to 1999
44Before 1990
Facilities with environmental interests located in this zip code:
BELT CORP (5314 MILL ST in ORIENT, OH)
STATE MASTER (Ohio general info) - AIR MAJOR, RCRA-OHD004281309, HAZARDOUS WASTE PROGRAM Small Quantity Generators, between 100 kg and 1000 kg of hazardous waste/month (Resource Conservation and Recovery Act (tracking hazardous waste)) - notification
BIG THREE WELDING (9391 WELCH RD in ORIENT, OH)
TSD (Resource Conservation and Recovery Act (tracking hazardous waste)) Organizations: GEORGE STANTON (CONTACT/OWNER)
Housing units lacking complete plumbing facilities: 3.7% Housing units lacking complete kitchen facilities: 3.9%
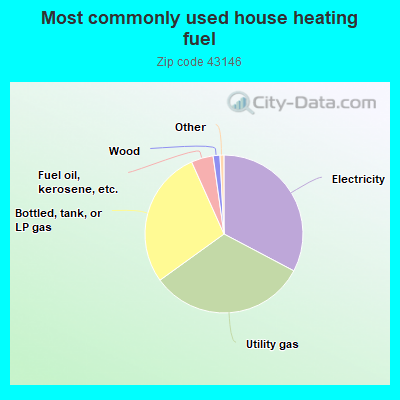
32.7%Electricity
32.3%Utility gas
28.2%Bottled, tank, or LP gas
4.5%Fuel oil, kerosene, etc.
1.4%Wood
Population in 1990: 13,491.
Place of birth for U.S.-born residents:
This state: 10,338
Northeast: 474
Midwest: 420
South: 1,114
West: 222
57% of the 43146 zip code residents lived in the same house 5 years ago. Out of people who lived in different houses, 22% lived in this county. Out of people who lived in different counties, 50% lived in Ohio.
83% of the 43146 zip code residents lived in the same house 1 year ago. Out of people who lived in different houses, 14% moved from this county. Out of people who lived in different houses, 85% moved from different county within same state. Out of people who lived in different houses, 3% moved from different state.
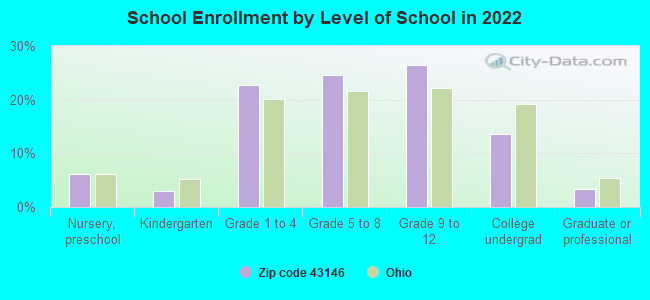
Private vs. public school enrollment:
Students in private schools in grades 1 to 8 (elementary and middle school): 76
Here:
7.3%
Ohio:
16.0%
Students in private schools in grades 9 to 12 (high school): 67
Here:
11.4%
Ohio:
13.1%
Students in private undergraduate colleges: 35
Here:
11.7%
Ohio:
22.3%
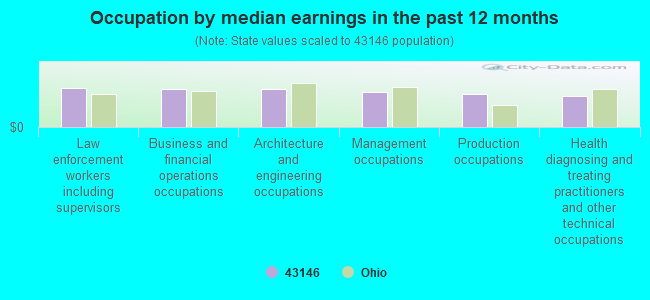
Occupation by median earnings in the past 12 months ($)
92,882Law enforcement workers including supervisors
91,470Business and financial operations occupations
90,532Architecture and engineering occupations
83,886Management occupations
77,874Production occupations
72,827Health diagnosing and treating practitioners and other technical occupations
Top industries in this zip code by the number of employees in 2005:
Construction: Poured Concrete Foundation and Structure Contractors (10-19 employees: 1 establishment, 5-9 employees: 1 establishment, 1-4 employees: 1 establishment)
Construction: Water and Sewer Line and Related Structures Construction (10-19: 1, 1-4: 2)
Construction: Plumbing, Heating, and Air-Conditioning Contractors (10-19: 1, 1-4: 2)
Administrative and Support and Waste Management and Remediation Services: Professional Employer Organizations (10-19: 1)
Arts, Entertainment, and Recreation: Other Spectator Sports (10-19: 1)
Wholesale Trade: Industrial Machinery and Equipment Merchant Wholesalers (5-9: 2)
People in group quarters in 2010:
3,598 people in state prisons
7 people in group homes intended for adults
People in group quarters in 2000:
3,659 people in state prisons
2,069 people in halfway houses
12 people in nursing homes
Fatal accident statistics in 2013:
Fatal accident count: 1
Vehicles involved in fatal accidents: 1
Fatal accidents caused by drunken drivers: 0
Fatalities: 1
Persons involved in fatal accidents: 1
Pedestrians involved in fatal accidents: 0
Fatal accident statistics in 2012:
Fatal accident count: 2
Vehicles involved in fatal accidents: 3
Fatal accidents caused by drunken drivers: 2
Fatalities: 2
Persons involved in fatal accidents: 4
Pedestrians involved in fatal accidents: 0
Home Mortgage Disclosure Act Aggregated Statistics For Year 2009 (Based on 2 full and 14 partial tracts)
A) FHA, FSA/RHS & VA Home Purchase Loans
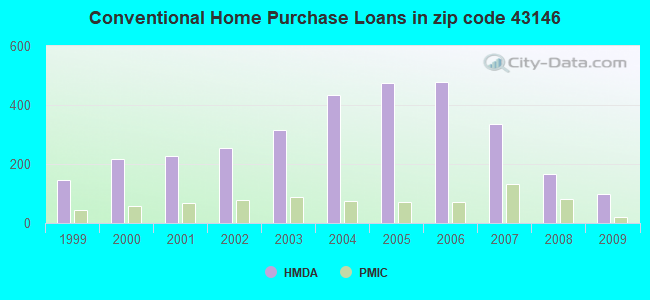
B) Conventional Home Purchase Loans
C) Refinancings
D) Home Improvement Loans
F) Non-occupant Loans on < 5 Family Dwellings (A B C & D)
G) Loans On Manufactured Home Dwelling (A B C & D)
Number
Average Value
Number
Average Value
Number
Average Value
Number
Average Value
Number
Average Value
Number
Average Value
LOANS ORIGINATED
182
$163,074
100
$164,362
567
$169,253
15
$63,051
9
$148,351
6
$85,425
APPLICATIONS APPROVED, NOT ACCEPTED
22
$165,280
11
$120,411
50
$159,223
4
$14,395
5
$88,588
2
$25,525
APPLICATIONS DENIED
18
$160,216
14
$143,092
217
$180,348
22
$50,100
7
$185,461
2
$87,385
APPLICATIONS WITHDRAWN
15
$157,360
12
$166,512
102
$169,301
4
$41,558
7
$142,749
1
$130,050
FILES CLOSED FOR INCOMPLETENESS
1
$104,520
0
$0
26
$187,396
3
$71,020
1
$48,620
0
$0
Aggregated Statistics For Year 2008 (Based on 2 full and 14 partial tracts)
A) FHA, FSA/RHS & VA Home Purchase Loans
B) Conventional Home Purchase Loans
C) Refinancings
D) Home Improvement Loans
F) Non-occupant Loans on < 5 Family Dwellings (A B C & D)
G) Loans On Manufactured Home Dwelling (A B C & D)
Number
Average Value
Number
Average Value
Number
Average Value
Number
Average Value
Number
Average Value
Number
Average Value
LOANS ORIGINATED
146
$159,856
167
$162,394
276
$163,292
49
$33,878
33
$117,192
8
$58,495
APPLICATIONS APPROVED, NOT ACCEPTED
23
$161,563
23
$172,993
49
$171,333
12
$39,298
4
$101,462
1
$88,720
APPLICATIONS DENIED
23
$162,322
36
$145,727
201
$156,173
59
$42,689
14
$85,729
8
$42,722
APPLICATIONS WITHDRAWN
11
$182,452
16
$155,542
80
$162,050
6
$72,517
4
$92,605
1
$104,420
FILES CLOSED FOR INCOMPLETENESS
3
$150,233
4
$154,015
18
$153,928
2
$41,380
1
$122,310
0
$0
Aggregated Statistics For Year 2007 (Based on 2 full and 14 partial tracts)
A) FHA, FSA/RHS & VA Home Purchase Loans
B) Conventional Home Purchase Loans
C) Refinancings
D) Home Improvement Loans
F) Non-occupant Loans on < 5 Family Dwellings (A B C & D)
G) Loans On Manufactured Home Dwelling (A B C & D)
Number
Average Value
Number
Average Value
Number
Average Value
Number
Average Value
Number
Average Value
Number
Average Value
LOANS ORIGINATED
77
$160,386
337
$154,875
316
$150,640
59
$49,921
30
$112,483
7
$68,771
APPLICATIONS APPROVED, NOT ACCEPTED
5
$151,952
49
$142,503
87
$146,548
16
$68,586
4
$85,075
2
$57,280
APPLICATIONS DENIED
20
$154,304
64
$118,964
349
$156,446
66
$37,862
18
$113,781
16
$36,628
APPLICATIONS WITHDRAWN
14
$164,071
47
$141,835
107
$156,092
12
$41,763
8
$111,228
0
$0
FILES CLOSED FOR INCOMPLETENESS
0
$0
6
$123,687
45
$196,228
2
$175,520
2
$156,025
0
$0
Aggregated Statistics For Year 2006 (Based on 2 full and 14 partial tracts)
A) FHA, FSA/RHS & VA Home Purchase Loans
B) Conventional Home Purchase Loans
C) Refinancings
D) Home Improvement Loans
F) Non-occupant Loans on < 5 Family Dwellings (A B C & D)
G) Loans On Manufactured Home Dwelling (A B C & D)
Number
Average Value
Number
Average Value
Number
Average Value
Number
Average Value
Number
Average Value
Number
Average Value
LOANS ORIGINATED
91
$167,074
478
$139,046
378
$133,163
68
$58,179
36
$118,072
16
$58,938
APPLICATIONS APPROVED, NOT ACCEPTED
7
$150,736
76
$134,166
97
$127,857
9
$37,104
7
$104,641
7
$47,417
APPLICATIONS DENIED
16
$167,541
92
$155,489
345
$137,832
58
$25,832
24
$135,754
20
$69,024
APPLICATIONS WITHDRAWN
13
$158,337
54
$119,172
158
$133,163
13
$51,709
14
$106,232
2
$55,545
FILES CLOSED FOR INCOMPLETENESS
1
$106,890
9
$157,072
52
$159,358
1
$413,000
1
$49,990
1
$33,320
Aggregated Statistics For Year 2005 (Based on 2 full and 14 partial tracts)
A) FHA, FSA/RHS & VA Home Purchase Loans
B) Conventional Home Purchase Loans
C) Refinancings
D) Home Improvement Loans
F) Non-occupant Loans on < 5 Family Dwellings (A B C & D)
G) Loans On Manufactured Home Dwelling (A B C & D)
Number
Average Value
Number
Average Value
Number
Average Value
Number
Average Value
Number
Average Value
Number
Average Value
LOANS ORIGINATED
116
$173,646
474
$139,688
498
$145,155
83
$51,989
52
$101,715
17
$71,668
APPLICATIONS APPROVED, NOT ACCEPTED
13
$165,569
75
$135,319
102
$145,234
21
$31,435
6
$133,490
3
$25,460
APPLICATIONS DENIED
28
$168,756
86
$113,365
403
$137,425
81
$31,420
24
$91,760
12
$47,646
APPLICATIONS WITHDRAWN
12
$172,279
59
$126,043
220
$162,022
45
$121,136
6
$139,942
2
$79,240
FILES CLOSED FOR INCOMPLETENESS
1
$213,900
30
$106,590
76
$154,410
1
$66,460
4
$113,258
1
$131,260
Aggregated Statistics For Year 2004 (Based on 2 full and 14 partial tracts)
A) FHA, FSA/RHS & VA Home Purchase Loans
B) Conventional Home Purchase Loans
C) Refinancings
D) Home Improvement Loans
F) Non-occupant Loans on < 5 Family Dwellings (A B C & D)
G) Loans On Manufactured Home Dwelling (A B C & D)
Number
Average Value
Number
Average Value
Number
Average Value
Number
Average Value
Number
Average Value
Number
Average Value
LOANS ORIGINATED
147
$158,912
435
$143,597
562
$143,894
56
$42,738
36
$98,779
16
$91,492
APPLICATIONS APPROVED, NOT ACCEPTED
23
$162,077
63
$134,653
136
$146,905
15
$43,751
3
$60,217
2
$96,280
APPLICATIONS DENIED
25
$143,754
78
$136,418
345
$138,882
57
$41,347
7
$109,067
28
$57,945
APPLICATIONS WITHDRAWN
36
$150,417
66
$140,509
227
$138,057
17
$59,632
6
$151,502
1
$158,000
FILES CLOSED FOR INCOMPLETENESS
4
$146,760
15
$115,709
64
$140,177
2
$43,270
0
$0
0
$0
Aggregated Statistics For Year 2003 (Based on 2 full and 14 partial tracts)
A) FHA, FSA/RHS & VA Home Purchase Loans
B) Conventional Home Purchase Loans
C) Refinancings
D) Home Improvement Loans
E) Loans on Dwellings For 5+ Families
F) Non-occupant Loans on < 5 Family Dwellings (A B C & D)
Number
Average Value
Number
Average Value
Number
Average Value
Number
Average Value
Number
Average Value
Number
Average Value
LOANS ORIGINATED
219
$152,381
314
$146,280
1,319
$135,737
43
$29,714
1
$318,580
36
$98,042
APPLICATIONS APPROVED, NOT ACCEPTED
9
$168,057
51
$123,907
188
$135,126
10
$15,442
0
$0
9
$70,474
APPLICATIONS DENIED
18
$152,897
63
$82,870
356
$134,859
44
$23,474
0
$0
7
$76,777
APPLICATIONS WITHDRAWN
9
$164,967
30
$133,618
201
$139,191
11
$25,302
0
$0
3
$98,223
FILES CLOSED FOR INCOMPLETENESS
2
$126,200
4
$118,310
60
$152,391
4
$35,515
0
$0
2
$45,070
Aggregated Statistics For Year 2002 (Based on 2 full and 12 partial tracts)
A) FHA, FSA/RHS & VA Home Purchase Loans
B) Conventional Home Purchase Loans
C) Refinancings
D) Home Improvement Loans
E) Loans on Dwellings For 5+ Families
F) Non-occupant Loans on < 5 Family Dwellings (A B C & D)
Number
Average Value
Number
Average Value
Number
Average Value
Number
Average Value
Number
Average Value
Number
Average Value
LOANS ORIGINATED
138
$150,818
254
$144,890
695
$127,802
40
$25,226
1
$777,560
19
$98,817
APPLICATIONS APPROVED, NOT ACCEPTED
8
$142,989
28
$121,503
129
$124,370
20
$28,614
0
$0
2
$76,050
APPLICATIONS DENIED
9
$144,166
79
$55,863
248
$118,560
47
$19,914
0
$0
9
$51,409
APPLICATIONS WITHDRAWN
7
$124,963
20
$161,972
166
$121,832
5
$30,302
0
$0
3
$84,647
FILES CLOSED FOR INCOMPLETENESS
2
$88,020
12
$89,408
56
$134,986
2
$12,235
0
$0
0
$0
Aggregated Statistics For Year 2001 (Based on 2 full and 12 partial tracts)
A) FHA, FSA/RHS & VA Home Purchase Loans
B) Conventional Home Purchase Loans
C) Refinancings
D) Home Improvement Loans
F) Non-occupant Loans on < 5 Family Dwellings (A B C & D)
Number
Average Value
Number
Average Value
Number
Average Value
Number
Average Value
Number
Average Value
LOANS ORIGINATED
78
$155,473
226
$127,836
636
$119,765
65
$22,397
19
$64,261
APPLICATIONS APPROVED, NOT ACCEPTED
5
$152,960
37
$84,172
113
$104,126
20
$34,247
3
$47,680
APPLICATIONS DENIED
7
$130,053
122
$39,440
235
$101,327
56
$22,783
10
$13,770
APPLICATIONS WITHDRAWN
6
$168,302
20
$109,343
134
$103,747
12
$23,329
2
$152,800
FILES CLOSED FOR INCOMPLETENESS
0
$0
3
$42,147
44
$126,912
1
$41,320
0
$0
Aggregated Statistics For Year 2000 (Based on 2 full and 12 partial tracts)
A) FHA, FSA/RHS & VA Home Purchase Loans
B) Conventional Home Purchase Loans
C) Refinancings
D) Home Improvement Loans
E) Loans on Dwellings For 5+ Families
F) Non-occupant Loans on < 5 Family Dwellings (A B C & D)
Number
Average Value
Number
Average Value
Number
Average Value
Number
Average Value
Number
Average Value
Number
Average Value
LOANS ORIGINATED
65
$135,636
216
$115,668
214
$100,968
66
$22,246
1
$324,310
14
$87,456
APPLICATIONS APPROVED, NOT ACCEPTED
6
$114,410
60
$51,494
66
$89,315
24
$12,635
0
$0
5
$38,996
APPLICATIONS DENIED
6
$96,455
168
$42,440
128
$85,769
42
$23,273
0
$0
5
$22,994
APPLICATIONS WITHDRAWN
4
$133,698
21
$95,400
57
$98,780
6
$34,083
1
$252,710
1
$28,330
FILES CLOSED FOR INCOMPLETENESS
1
$114,600
0
$0
11
$89,710
0
$0
0
$0
0
$0
Aggregated Statistics For Year 1999 (Based on 1 full and 7 partial tracts)
A) FHA, FSA/RHS & VA Home Purchase Loans
B) Conventional Home Purchase Loans
C) Refinancings
D) Home Improvement Loans
F) Non-occupant Loans on < 5 Family Dwellings (A B C & D)
2002 - 2018 National Fire Incident Reporting System (NFIRS) incidents
Based on the data from the years 2002 - 2018 the average number of fire incidents per year is 39. The highest number of reported fire incidents - 56 took place in 2010, and the least - 21 in 2015. The data has a constant trend.
When looking into fire subcategories, the most incidents belonged to: Structure Fires (53.1%), and Outside Fires (27.2%).
Fire incident types reported to NFIRS in Zip Code 43146


+$832
-$3,706
(% of AGI for various income ranges: -1.6% for AGIs below $10k, 0.1% for AGIs $25k-50k, 0.4% for AGIs $50k-75k, -0.2% for AGIs $75k-100k, 0.0% for AGIs over 100k)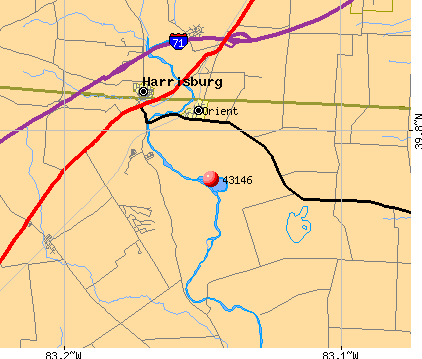 Nearest zip codes: 43126, 43117, 43116, 43123, 43137, 43143.
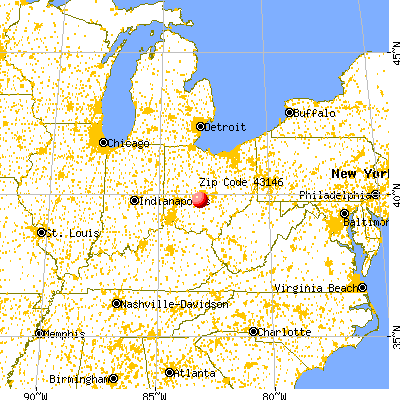


 Based on the data from the years 2002 - 2018 the average number of fire incidents per year is 39. The highest number of reported fire incidents - 56 took place in 2010, and the least - 21 in 2015. The data has a constant trend.
 When looking into fire subcategories, the most incidents belonged to: Structure Fires (53.1%), and Outside Fires (27.2%).