Estimated zip code population in 2022: 1,111 Zip code population in 2010: 971 Zip code population in 2000: 965
Houses and condos: 417 Renter-occupied apartments: 105
% of renters here:
28%
State:
33%
March 2022 cost of living index in zip code 43153: 83.8 (less than average, U.S. average is 100)
Land area: 52.7 sq. mi. Water area: 0.0 sq. mi.
Population density: 21 people per square mile
(very low).
OSM Map
General Map
Google Map
MSN Map
OSM Map
General Map
Google Map
MSN Map
OSM Map
General Map
Google Map
MSN Map
OSM Map
General Map
Google Map
MSN Map
Please wait while loading the map...
Real estate property taxes paid for housing units in 2022:
This zip code:
0.8% ($1,358)
Ohio:
1.3% ($2,639)
Median real estate property taxes paid for housing units with mortgages in 2022: $1,343 (0.7%) Median real estate property taxes paid for housing units with no mortgage in 2022: $1,480 (0.9%)
Business Search- 14 Million verified businesses
Males: 504
(45.4%)
Females: 606
(54.6%)
For population 25 years and over in 43153:
High school or higher: 90.3%
Bachelor's degree or higher: 34.3%
Graduate or professional degree: 11.5%
Unemployed: 1.0%
Mean travel time to work (commute): 30.9 minutes
For population 15 years and over in 43153:
Never married: 24.7%
Now married: 51.9%
Separated: 1.0%
Widowed: 13.3%
Divorced: 9.0%
Zip code 43153 compared to state average:
Unemployed percentage significantly below state average.
Black race population percentage significantly below state average.
Hispanic race population percentage significantly above state average.
Median age significantly above state average.
Foreign-born population percentage significantly above state average.
Length of stay since moving in significantly above state average.
Averages for the 2020 tax year for zip code 43153, filed in 2021:
Average Adjusted Gross Income (AGI) in 2020: $52,681 (Individual Income Tax Returns)
Here:
$52,681
State:
$67,288
Salary/wage: $44,332 (reported on 81.0% of returns)
Here:
$44,332
State:
$55,628
(% of AGI for various income ranges: 1236.7% for AGIs below $25k, 3644.4% for AGIs $25k-50k, 6175.0% for AGIs $50k-75k, 11820.0% for AGIs $75k-100k, 19486.7% for AGIs $100k-200k)
Taxable interest for individuals: $229 (reported on 16.7% of returns)
This zip code:
$229
Ohio:
$1,518
(% of AGI for various income ranges: 6.7% for AGIs below $25k, 5.0% for AGIs $50k-75k, 26.7% for AGIs $100k-200k)
Ordinary dividends: $1,300 (reported on 7.1% of returns)
Here:
$1,300
State:
$7,167
(% of AGI for various income ranges: 43.3% for AGIs $25k-50k)
Net capital gain/loss in AGI: +$5,033 (reported on 7.1% of returns)
Here:
+$5,033
State:
+$18,919
(% of AGI for various income ranges: 755.0% for AGIs $75k-100k)
Profit/loss from business: +$7,200 (reported on 9.5% of returns)
Here:
+$7,200
State:
+$13,744
(% of AGI for various income ranges: 320.0% for AGIs $25k-50k)
Earned income credit: $2,614 (reported on 16.7% of returns)
Here:
$2,614
State:
$2,304
(% of AGI for various income ranges: 116.7% for AGIs below $25k, 86.7% for AGIs $25k-50k)
Percentage of individuals using paid preparers for their 2020 taxes: 90.5%
Here:
90%
State:
94%
(% for various income ranges: 92.3% for AGIs below $25k, 91.7% for AGIs $25k-50k, 100.0% for AGIs $50k-75k, 75.0% for AGIs $75k-100k, 85.7% for AGIs $100k-200k)
Averages for the 2012 tax year for zip code 43153, filed in 2013:
Average Adjusted Gross Income (AGI) in 2012: $53,537 (Individual Income Tax Returns)
Here:
$53,537
State:
$54,926
Salary/wage: $39,086 (reported on 85.4% of returns)
Here:
$39,086
State:
$45,869
(% of AGI for various income ranges: 73.0% for AGIs below $25k, 82.2% for AGIs $25k-50k, 84.1% for AGIs $50k-75k, 92.0% for AGIs $75k-100k, 32.6% for AGIs $100k-200k)
Taxable interest for individuals: $490 (reported on 24.4% of returns)
This zip code:
$490
Ohio:
$1,297
(% of AGI for various income ranges: 0.6% for AGIs $25k-50k, 0.2% for AGIs $100k-200k)
Ordinary dividends: $700 (reported on 7.3% of returns)
Here:
$700
State:
$5,821
(% of AGI for various income ranges: 0.4% for AGIs $25k-50k)
Net capital gain/loss in AGI: +$1,000 (reported on 4.9% of returns)
Here:
+$1,000
State:
+$11,232
(% of AGI for various income ranges: 0.4% for AGIs $25k-50k)
Profit/loss from business: +$4,517 (reported on 14.6% of returns)
Here:
+$4,517
State:
+$12,773
(% of AGI for various income ranges: 8.7% for AGIs below $25k, 2.5% for AGIs $25k-50k)
Taxable individual retirement arrangement distribution: $4,300 (reported on 4.9% of returns)
43153:
$4,300
Ohio:
$14,511
(% of AGI for various income ranges: 5.3% for AGIs below $25k)
Total itemized deductions: $18,167 (16% of AGI, reported on 22.0% of returns)
Here:
$18,167
State:
$21,278
Here:
16.3% of AGI
State:
18.8% of AGI
(% of AGI for various income ranges: 6.2% for AGIs $25k-50k, 19.2% for AGIs $50k-75k, 7.6% for AGIs $100k-200k)
Charity contributions: $2,650 (reported on 14.6% of returns)
Here:
$2,650
State:
$3,943
(% of AGI for various income ranges: 2.8% for AGIs $50k-75k, 0.7% for AGIs $100k-200k)
Taxes paid: $6,378 (reported on 22.0% of returns)
43153:
$6,378
State:
$9,568
(% of AGI for various income ranges: 1.5% for AGIs $25k-50k, 5.7% for AGIs $50k-75k, 3.4% for AGIs $100k-200k)
Earned income credit: $2,038 (reported on 19.5% of returns)
Here:
$2,038
State:
$2,285
(% of AGI for various income ranges: 7.2% for AGIs below $25k, 0.9% for AGIs $25k-50k)
Percentage of individuals using paid preparers for their 2012 taxes: 58.5%
Here:
59%
State:
51%
(% for various income ranges: 50.0% for AGIs below $25k, 57.1% for AGIs $25k-50k, 100.0% for AGIs $50k-75k, 0.0% for AGIs $75k-100k, 80.0% for AGIs $100k-200k)
Averages for the 2004 tax year for zip code 43153, filed in 2005:
Average Adjusted Gross Income (AGI) in 2004: $28,383 (Individual Income Tax Returns)
Here:
$28,383
State:
$44,480
Salary/wage: $29,905 (reported on 86.1% of returns)
Here:
$29,905
State:
$39,198
(% of AGI for various income ranges: 78.2% for AGIs $10k-25k, 83.9% for AGIs $25k-50k, 79.7% for AGIs $50k-75k, 76.7% for AGIs $75k-100k)
Taxable interest for individuals: $792 (reported on 31.7% of returns)
This zip code:
$792
Ohio:
$1,532
(% of AGI for various income ranges: 3.0% for AGIs $10k-25k, 0.3% for AGIs $25k-50k, 0.2% for AGIs $50k-75k, 0.2% for AGIs $75k-100k)
Taxable dividends: $267 (reported on 9.9% of returns)
Here:
$267
State:
$3,496
(% of AGI for various income ranges: 0.1% for AGIs $10k-25k, 0.1% for AGIs $25k-50k, 0.0% for AGIs $50k-75k)
Net capital gain/loss: +$2,023 (reported on 9.7% of returns)
Here:
+$2,023
State:
+$8,582
Profit/loss from business: +$2,653 (reported on 10.8% of returns)
Here:
+$2,653
State:
+$10,813
Profit/loss from farming: +$8,528 (reported on 7.9% of returns)
Here:
+$8,528
State:
-$3,706
Total itemized deductions: $14,913 (26% of AGI, reported on 20.3% of returns)
Here:
$14,913
State:
$17,503
Here:
26.0% of AGI
State:
20.8% of AGI
(% of AGI for various income ranges: 8.1% for AGIs $10k-25k, 7.9% for AGIs $25k-50k, 9.6% for AGIs $50k-75k, 15.5% for AGIs $75k-100k)
Charity contributions deductions: $1,464 (2% of AGI, reported on 12.3% of returns)
Here:
$1,464
State:
$3,087
Here:
2.3% of AGI
State:
3.4% of AGI
Total tax: $3,456 (reported on 73.3% of returns)
43153:
$3,456
State:
$6,781
(% of AGI for various income ranges: 4.8% for AGIs $10k-25k, 7.3% for AGIs $25k-50k, 8.4% for AGIs $50k-75k, 12.0% for AGIs $75k-100k)
Earned income credit: $1,636 (reported on 14.5% of returns)
Here:
$1,636
State:
$1,696
Percentage of individuals using paid preparers for their 2004 taxes: 57.9%
Here:
58%
State:
55%
(% for various income ranges: 45.8% for AGIs below $10k, 58.9% for AGIs $10k-25k, 66.7% for AGIs $25k-50k, 56.7% for AGIs $50k-75k, 57.7% for AGIs $75k-100k)
Household received Food Stamps/SNAP in the past 12 months: 47 Household did not receive Food Stamps/SNAP in the past 12 months: 330
Women who had a birth in the past 12 months: 20 (0 now married, 19 unmarried) Women who did not have a birth in the past 12 months: 165 (81 now married, 84 unmarried)
Housing units in zip code 43153 with a mortgage: 188 (2 second mortgage, 1 both second mortgage and home equity loan) Houses without a mortgage: 18
Median monthly owner costs for units with a mortgage: $1,325 Median monthly owner costs for units without a mortgage: $579
Residents with income below the poverty level in 2022:
This zip code:
16.0%
Whole state:
13.4%
Residents with income below 50% of the poverty level in 2022:
This zip code:
5.6%
Whole state:
7.0%
Median number of rooms in houses and condos:
Here:
6.9
State:
6.7
Median number of rooms in apartments:
Here:
6.3
State:
4.4
Notable locations in this zip code not listed on our city pages
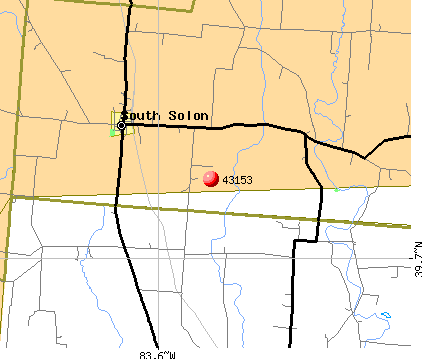
Notable locations in zip code 43153: Waters Christmas Tree Farm (A), Stardust Dairy (B), Twin Oak Dairy (C), Stokes Township Fire Department (D). Display/hide their locations on the map
Cemeteries: Counts Cemetery (1), Thomas Cemetery (2), Pancake Cemetery (3), Whiteman Cemetery (4), Range Cemetery (5), South Solon Cemetery (6). Display/hide their locations on the map
93 married couples with children.
95 single-parent households (51 men, 44 women).
89.2% of residents of 43153 zip code speak English at home.
11.0% of residents speak Spanish at home (37% very well, 19% well, 11% not well, 33% not at all).
0.1% of residents speak other Indo-European language at home (100% very well).
Foreign born population: 194 (17.5%) (0.5% of them are naturalized citizens)
This zip code:
17.5%
Whole state:
5.0%
51%France
26%Honduras
9%Chile
7%Costa Rica
7%Tanzania
1%Sweden
1%England
25%German
22%American
5%English
4%Irish
2%African
1%European
1%French
Year of entry for the foreign-born population
692010 or later
312000 to 2009
911990 to 1999
2Before 1990
Housing units lacking complete plumbing facilities: 0.8% Housing units lacking complete kitchen facilities: 2.5%
56.8%Utility gas
16.3%Electricity
14.4%Bottled, tank, or LP gas
7.9%Fuel oil, kerosene, etc.
3.0%Other fuel
2.4%Wood
Population in 1990: 766. Population change in the 1990s: +199 (+26.0%).
Place of birth for U.S.-born residents:
This state: 810
Northeast: 18
Midwest: 6
South: 55
West: 27
62% of the 43153 zip code residents lived in the same house 5 years ago. Out of people who lived in different houses, 45% lived in this county. Out of people who lived in different counties, 50% lived in Ohio.
86% of the 43153 zip code residents lived in the same house 1 year ago. Out of people who lived in different houses, 36% moved from this county. Out of people who lived in different houses, 37% moved from different county within same state. Out of people who lived in different houses, 32% moved from abroad.
Private vs. public school enrollment:
Students in private schools in grades 1 to 8 (elementary and middle school): 12
Here:
12.2%
Ohio:
16.0%
Students in private schools in grades 9 to 12 (high school): 1
Here:
3.4%
Ohio:
13.1%
Students in private undergraduate colleges:
Here:
0.0%
Ohio:
22.3%
Occupation by median earnings in the past 12 months ($)
77,139Architecture and engineering occupations
76,472Law enforcement workers including supervisors
73,703Computer and mathematical occupations
71,853Building and grounds cleaning and maintenance occupations
69,804Management occupations
69,070Sales and related occupations
Top industries in this zip code by the number of employees in 2005:
Wholesale Trade: Petroleum and Petroleum Products Merchant Wholesalers (except Bulk Stations and Terminals) (10-19 employees: 1 establishment)
Construction: Commercial and Institutional Building Construction (5-9: 1)
Professional, Scientific, and Technical Services: Veterinary Services (1-4: 2)
Other Services (except Public Administration): Religious Organizations (1-4: 2)
Wholesale Trade: Grain and Field Bean Merchant Wholesalers (1-4: 1)
Other Services (except Public Administration): Car Washes (1-4: 1)
Construction: New Single-Family Housing Construction (except Operative Builders) (1-4: 1)
Fatal accident statistics in 2014:
Fatal accident count: 1
Vehicles involved in fatal accidents: 3
Fatal accidents caused by drunken drivers: 1
Fatalities: 1
Persons involved in fatal accidents: 4
Pedestrians involved in fatal accidents: 0
Home Mortgage Disclosure Act Aggregated Statistics For Year 2009 (Based on 4 partial tracts)
A) FHA, FSA/RHS & VA Home Purchase Loans
B) Conventional Home Purchase Loans
C) Refinancings
D) Home Improvement Loans
F) Non-occupant Loans on < 5 Family Dwellings (A B C & D)
G) Loans On Manufactured Home Dwelling (A B C & D)
Number
Average Value
Number
Average Value
Number
Average Value
Number
Average Value
Number
Average Value
Number
Average Value
LOANS ORIGINATED
7
$104,534
4
$127,035
34
$138,469
6
$38,127
2
$56,315
1
$31,580
APPLICATIONS APPROVED, NOT ACCEPTED
1
$20,470
1
$112,940
4
$127,570
1
$3,410
0
$0
0
$0
APPLICATIONS DENIED
0
$0
4
$53,732
23
$141,917
4
$13,295
1
$9,100
1
$1,710
APPLICATIONS WITHDRAWN
0
$0
0
$0
6
$124,432
0
$0
1
$86,430
0
$0
FILES CLOSED FOR INCOMPLETENESS
0
$0
0
$0
2
$171,215
0
$0
0
$0
0
$0
Aggregated Statistics For Year 2008 (Based on 4 partial tracts)
A) FHA, FSA/RHS & VA Home Purchase Loans
B) Conventional Home Purchase Loans
C) Refinancings
D) Home Improvement Loans
F) Non-occupant Loans on < 5 Family Dwellings (A B C & D)
G) Loans On Manufactured Home Dwelling (A B C & D)
Number
Average Value
Number
Average Value
Number
Average Value
Number
Average Value
Number
Average Value
Number
Average Value
LOANS ORIGINATED
10
$100,865
10
$101,864
26
$128,371
6
$29,108
5
$91,050
2
$88,415
APPLICATIONS APPROVED, NOT ACCEPTED
0
$0
0
$0
5
$117,774
0
$0
0
$0
0
$0
APPLICATIONS DENIED
5
$72,848
4
$139,592
24
$104,817
5
$56,596
1
$56,440
1
$47,780
APPLICATIONS WITHDRAWN
0
$0
2
$97,230
9
$105,307
1
$16,050
0
$0
0
$0
FILES CLOSED FOR INCOMPLETENESS
0
$0
0
$0
1
$190,810
0
$0
0
$0
0
$0
Aggregated Statistics For Year 2007 (Based on 4 partial tracts)
A) FHA, FSA/RHS & VA Home Purchase Loans
B) Conventional Home Purchase Loans
C) Refinancings
D) Home Improvement Loans
F) Non-occupant Loans on < 5 Family Dwellings (A B C & D)
G) Loans On Manufactured Home Dwelling (A B C & D)
Number
Average Value
Number
Average Value
Number
Average Value
Number
Average Value
Number
Average Value
Number
Average Value
LOANS ORIGINATED
5
$93,212
18
$102,184
36
$114,510
8
$29,675
3
$81,950
1
$119,940
APPLICATIONS APPROVED, NOT ACCEPTED
0
$0
2
$126,310
5
$116,770
2
$50,665
1
$38,160
0
$0
APPLICATIONS DENIED
0
$0
9
$104,093
37
$120,634
5
$28,320
1
$39,230
1
$33,490
APPLICATIONS WITHDRAWN
0
$0
4
$191,445
10
$115,390
2
$47,110
0
$0
0
$0
FILES CLOSED FOR INCOMPLETENESS
0
$0
1
$99,500
3
$77,063
1
$95,520
0
$0
0
$0
Aggregated Statistics For Year 2006 (Based on 4 partial tracts)
A) FHA, FSA/RHS & VA Home Purchase Loans
B) Conventional Home Purchase Loans
C) Refinancings
D) Home Improvement Loans
F) Non-occupant Loans on < 5 Family Dwellings (A B C & D)
G) Loans On Manufactured Home Dwelling (A B C & D)
Number
Average Value
Number
Average Value
Number
Average Value
Number
Average Value
Number
Average Value
Number
Average Value
LOANS ORIGINATED
5
$113,194
31
$92,111
41
$104,490
11
$22,173
5
$94,572
2
$45,460
APPLICATIONS APPROVED, NOT ACCEPTED
0
$0
4
$90,902
8
$88,111
1
$138,360
1
$24,960
0
$0
APPLICATIONS DENIED
2
$83,880
13
$83,159
41
$124,536
9
$50,991
1
$80,070
2
$39,855
APPLICATIONS WITHDRAWN
1
$138,740
2
$112,845
17
$97,066
2
$36,830
0
$0
0
$0
FILES CLOSED FOR INCOMPLETENESS
1
$99,500
2
$86,425
4
$132,668
0
$0
0
$0
1
$71,640
Aggregated Statistics For Year 2005 (Based on 4 partial tracts)
A) FHA, FSA/RHS & VA Home Purchase Loans
B) Conventional Home Purchase Loans
C) Refinancings
D) Home Improvement Loans
F) Non-occupant Loans on < 5 Family Dwellings (A B C & D)
G) Loans On Manufactured Home Dwelling (A B C & D)
Number
Average Value
Number
Average Value
Number
Average Value
Number
Average Value
Number
Average Value
Number
Average Value
LOANS ORIGINATED
2
$75,420
37
$99,258
42
$113,803
7
$68,867
5
$66,550
0
$0
APPLICATIONS APPROVED, NOT ACCEPTED
0
$0
3
$109,173
10
$105,723
3
$19,033
0
$0
0
$0
APPLICATIONS DENIED
0
$0
7
$97,799
39
$93,604
9
$29,643
3
$73,330
1
$126,740
APPLICATIONS WITHDRAWN
1
$89,270
7
$93,056
22
$102,280
3
$167,443
2
$58,655
1
$150,110
FILES CLOSED FOR INCOMPLETENESS
0
$0
1
$183,280
9
$142,439
0
$0
0
$0
0
$0
Aggregated Statistics For Year 2004 (Based on 4 partial tracts)
A) FHA, FSA/RHS & VA Home Purchase Loans
B) Conventional Home Purchase Loans
C) Refinancings
D) Home Improvement Loans
E) Loans on Dwellings For 5+ Families
F) Non-occupant Loans on < 5 Family Dwellings (A B C & D)
G) Loans On Manufactured Home Dwelling (A B C & D)
Number
Average Value
Number
Average Value
Number
Average Value
Number
Average Value
Number
Average Value
Number
Average Value
Number
Average Value
LOANS ORIGINATED
8
$113,660
27
$99,468
52
$104,266
7
$15,137
1
$36,390
8
$64,512
1
$79,060
APPLICATIONS APPROVED, NOT ACCEPTED
1
$54,590
4
$85,782
16
$86,811
1
$78,450
0
$0
4
$58,732
1
$121,750
APPLICATIONS DENIED
1
$122,660
8
$63,330
42
$108,224
14
$27,205
0
$0
5
$65,846
1
$92,780
APPLICATIONS WITHDRAWN
0
$0
4
$89,250
20
$109,694
3
$37,237
0
$0
1
$36,390
1
$62,760
FILES CLOSED FOR INCOMPLETENESS
0
$0
1
$80,740
6
$95,862
0
$0
0
$0
1
$80,740
0
$0
Aggregated Statistics For Year 2003 (Based on 4 partial tracts)
A) FHA, FSA/RHS & VA Home Purchase Loans
B) Conventional Home Purchase Loans
C) Refinancings
D) Home Improvement Loans
F) Non-occupant Loans on < 5 Family Dwellings (A B C & D)
Number
Average Value
Number
Average Value
Number
Average Value
Number
Average Value
Number
Average Value
LOANS ORIGINATED
5
$101,738
22
$117,082
79
$100,776
10
$15,166
6
$84,885
APPLICATIONS APPROVED, NOT ACCEPTED
0
$0
3
$90,277
18
$92,374
1
$16,490
0
$0
APPLICATIONS DENIED
1
$69,370
6
$73,325
40
$106,171
5
$20,326
0
$0
APPLICATIONS WITHDRAWN
1
$179,030
2
$118,485
19
$126,813
0
$0
0
$0
FILES CLOSED FOR INCOMPLETENESS
1
$65,960
0
$0
5
$113,374
0
$0
0
$0
Aggregated Statistics For Year 2002 (Based on 2 partial tracts)
A) FHA, FSA/RHS & VA Home Purchase Loans
B) Conventional Home Purchase Loans
C) Refinancings
D) Home Improvement Loans
F) Non-occupant Loans on < 5 Family Dwellings (A B C & D)
Number
Average Value
Number
Average Value
Number
Average Value
Number
Average Value
Number
Average Value
LOANS ORIGINATED
5
$88,722
8
$80,101
36
$97,144
2
$9,270
2
$41,185
APPLICATIONS APPROVED, NOT ACCEPTED
0
$0
0
$0
6
$94,202
1
$10,340
0
$0
APPLICATIONS DENIED
0
$0
1
$49,210
14
$87,418
2
$12,305
0
$0
APPLICATIONS WITHDRAWN
0
$0
0
$0
10
$80,235
0
$0
0
$0
FILES CLOSED FOR INCOMPLETENESS
0
$0
0
$0
3
$86,297
0
$0
0
$0
Aggregated Statistics For Year 2001 (Based on 2 partial tracts)
A) FHA, FSA/RHS & VA Home Purchase Loans
B) Conventional Home Purchase Loans
C) Refinancings
D) Home Improvement Loans
F) Non-occupant Loans on < 5 Family Dwellings (A B C & D)
Number
Average Value
Number
Average Value
Number
Average Value
Number
Average Value
Number
Average Value
LOANS ORIGINATED
3
$84,513
7
$100,460
32
$90,666
7
$17,167
1
$58,130
APPLICATIONS APPROVED, NOT ACCEPTED
0
$0
1
$87,370
8
$74,752
1
$28,880
0
$0
APPLICATIONS DENIED
0
$0
2
$69,000
12
$77,828
4
$21,752
0
$0
APPLICATIONS WITHDRAWN
0
$0
1
$173,310
9
$97,193
0
$0
0
$0
FILES CLOSED FOR INCOMPLETENESS
0
$0
0
$0
1
$127,310
0
$0
0
$0
Aggregated Statistics For Year 2000 (Based on 2 partial tracts)
A) FHA, FSA/RHS & VA Home Purchase Loans
B) Conventional Home Purchase Loans
C) Refinancings
D) Home Improvement Loans
F) Non-occupant Loans on < 5 Family Dwellings (A B C & D)
Number
Average Value
Number
Average Value
Number
Average Value
Number
Average Value
Number
Average Value
LOANS ORIGINATED
3
$79,997
9
$76,550
11
$66,555
4
$20,415
1
$41,720
APPLICATIONS APPROVED, NOT ACCEPTED
0
$0
2
$89,150
5
$59,694
2
$17,650
0
$0
APPLICATIONS DENIED
0
$0
4
$57,055
15
$86,297
5
$19,256
0
$0
APPLICATIONS WITHDRAWN
0
$0
0
$0
5
$74,600
1
$27,100
0
$0
FILES CLOSED FOR INCOMPLETENESS
0
$0
1
$32,090
2
$90,575
0
$0
0
$0
Aggregated Statistics For Year 1999 (Based on 2 partial tracts)
A) FHA, FSA/RHS & VA Home Purchase Loans
B) Conventional Home Purchase Loans
C) Refinancings
D) Home Improvement Loans
F) Non-occupant Loans on < 5 Family Dwellings (A B C & D)
Detailed PMIC statistics for the following Tracts:0033.02
, 0413.00
2003 - 2018 National Fire Incident Reporting System (NFIRS) incidents
According to the data from the years 2003 - 2018 the average number of fire incidents per year is 9. The highest number of fire incidents - 23 took place in 2015, and the least - 2 in 2003. The data has a rising trend.
When looking into fire subcategories, the most reports belonged to: Structure Fires (47.9%), and Outside Fires (44.4%).
Fire incident types reported to NFIRS in Zip Code 43153


+$8,528
-$3,706
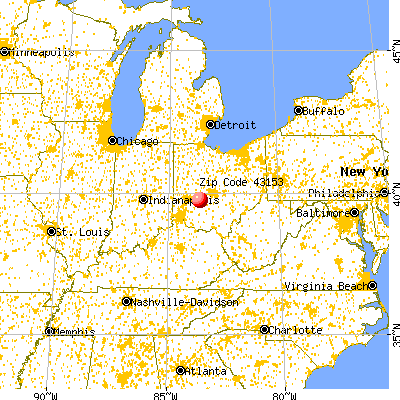
 Nearest zip codes: 43151, 43128, 45368, 43142, 43106, 43140.


 According to the data from the years 2003 - 2018 the average number of fire incidents per year is 9. The highest number of fire incidents - 23 took place in 2015, and the least - 2 in 2003. The data has a rising trend.
 When looking into fire subcategories, the most reports belonged to: Structure Fires (47.9%), and Outside Fires (44.4%).