Estimated zip code population in 2022: 4,178 Zip code population in 2010: 3,864 Zip code population in 2000: 3,527
Houses and condos: 1,791 Renter-occupied apartments: 234
% of renters here:
13%
State:
33%
March 2022 cost of living index in zip code 43318: 83.5 (less than average, U.S. average is 100)
Land area: 68.2 sq. mi. Water area: 0.1 sq. mi.
Population density: 61 people per square mile
(very low).
OSM Map
General Map
Google Map
MSN Map
OSM Map
General Map
Google Map
MSN Map
OSM Map
General Map
Google Map
MSN Map
OSM Map
General Map
Google Map
MSN Map
Please wait while loading the map...
Real estate property taxes paid for housing units in 2022:
This zip code:
0.8% ($1,602)
Ohio:
1.3% ($2,639)
Median real estate property taxes paid for housing units with mortgages in 2022: $1,589 (0.8%) Median real estate property taxes paid for housing units with no mortgage in 2022: $1,654 (0.6%)
Business Search- 14 Million verified businesses
Males: 2,307
(55.2%)
Females: 1,871
(44.8%)
For population 25 years and over in 43318:
High school or higher: 92.0%
Bachelor's degree or higher: 19.5%
Graduate or professional degree: 9.0%
Unemployed: 2.3%
Mean travel time to work (commute): 26.3 minutes
For population 15 years and over in 43318:
Never married: 22.3%
Now married: 56.3%
Separated: 4.6%
Widowed: 3.4%
Divorced: 13.4%
Zip code 43318 compared to state average:
Black race population percentage significantly below state average.
Hispanic race population percentage significantly below state average.
Foreign-born population percentage significantly below state average.
Renting percentage significantly below state average.
Length of stay since moving in significantly above state average.
Number of college students below state average.
Percentage of population with a bachelor's degree or higher below state average.
Estimated median house/condo value in 2022: $197,530
43318:
$197,530
Ohio:
$204,100
According to our research of Ohio and other state lists, there were 7 registered sex offenders living in 43318 zip code as of May 28, 2024. The ratio of all residents to sex offenders in zip code 43318 is 638 to 1. The ratio of registered sex offenders to all residents in this zip code is near the state average.
Median resident age:
This zip code:
43.0 years
Ohio median age:
39.9 years
Average household size:
This zip code:
2.4 people
Ohio:
2.4 people
Averages for the 2020 tax year for zip code 43318, filed in 2021:
Average Adjusted Gross Income (AGI) in 2020: $53,383 (Individual Income Tax Returns)
Here:
$53,383
State:
$67,288
Salary/wage: $45,850 (reported on 81.6% of returns)
Here:
$45,850
State:
$55,628
(% of AGI for various income ranges: 1225.2% for AGIs below $25k, 3734.4% for AGIs $25k-50k, 6049.2% for AGIs $50k-75k, 8850.8% for AGIs $75k-100k, 17038.2% for AGIs $100k-200k)
Taxable interest for individuals: $1,024 (reported on 30.1% of returns)
This zip code:
$1,024
Ohio:
$1,518
(% of AGI for various income ranges: 14.8% for AGIs below $25k, 17.4% for AGIs $25k-50k, 45.6% for AGIs $50k-75k, 50.8% for AGIs $75k-100k, 201.8% for AGIs $100k-200k)
Ordinary dividends: $1,818 (reported on 13.5% of returns)
Here:
$1,818
State:
$7,167
(% of AGI for various income ranges: 3.5% for AGIs below $25k, 8.5% for AGIs $25k-50k, 21.6% for AGIs $50k-75k, 64.2% for AGIs $75k-100k, 208.2% for AGIs $100k-200k)
Net capital gain/loss in AGI: +$8,372 (reported on 11.0% of returns)
Here:
+$8,372
State:
+$18,919
(% of AGI for various income ranges: 6.5% for AGIs below $25k, 24.4% for AGIs $25k-50k, 40.0% for AGIs $50k-75k, 118.3% for AGIs $75k-100k, 1056.4% for AGIs $100k-200k)
Profit/loss from business: +$9,217 (reported on 14.1% of returns)
Here:
+$9,217
State:
+$13,744
(% of AGI for various income ranges: 83.5% for AGIs below $25k, 109.1% for AGIs $25k-50k, 269.2% for AGIs $50k-75k, 393.3% for AGIs $75k-100k, 313.6% for AGIs $100k-200k)
Taxable individual retirement arrangement distribution: $15,420 (reported on 9.2% of returns)
43318:
$15,420
Ohio:
$18,876
(% of AGI for various income ranges: 92.9% for AGIs below $25k, 130.3% for AGIs $25k-50k, 196.0% for AGIs $50k-75k, 378.3% for AGIs $75k-100k, 580.0% for AGIs $100k-200k)
Total itemized deductions: $35,800 (reported on 1.8% of returns)
Here:
$35,800
State:
$33,869
(% of AGI for various income ranges: 429.6% for AGIs $50k-75k)
Charity contributions: $11,050 (reported on 1.2% of returns)
Here:
$11,050
State:
$14,577
(% of AGI for various income ranges: 65.0% for AGIs $25k-50k)
Taxes paid: $5,800 (reported on 1.8% of returns)
43318:
$5,800
State:
$7,681
(% of AGI for various income ranges: 69.6% for AGIs $50k-75k)
Earned income credit: $2,135 (reported on 12.3% of returns)
Here:
$2,135
State:
$2,304
(% of AGI for various income ranges: 68.7% for AGIs below $25k, 62.9% for AGIs $25k-50k)
Percentage of individuals using paid preparers for their 2020 taxes: 95.7%
Here:
96%
State:
94%
(% for various income ranges: 95.7% for AGIs below $25k, 95.6% for AGIs $25k-50k, 94.1% for AGIs $50k-75k, 100.0% for AGIs $75k-100k, 95.2% for AGIs $100k-200k)
Averages for the 2012 tax year for zip code 43318, filed in 2013:
Average Adjusted Gross Income (AGI) in 2012: $45,118 (Individual Income Tax Returns)
Here:
$45,118
State:
$54,926
Salary/wage: $40,552 (reported on 84.2% of returns)
Here:
$40,552
State:
$45,869
(% of AGI for various income ranges: 68.5% for AGIs below $25k, 79.3% for AGIs $25k-50k, 81.7% for AGIs $50k-75k, 82.8% for AGIs $75k-100k, 62.3% for AGIs $100k-200k)
Taxable interest for individuals: $730 (reported on 31.6% of returns)
This zip code:
$730
Ohio:
$1,297
(% of AGI for various income ranges: 1.2% for AGIs below $25k, 0.5% for AGIs $25k-50k, 0.2% for AGIs $50k-75k, 0.5% for AGIs $75k-100k, 0.6% for AGIs $100k-200k)
Ordinary dividends: $1,332 (reported on 15.8% of returns)
Here:
$1,332
State:
$5,821
(% of AGI for various income ranges: 0.4% for AGIs below $25k, 0.3% for AGIs $25k-50k, 0.2% for AGIs $50k-75k, 0.7% for AGIs $75k-100k, 0.7% for AGIs $100k-200k)
Net capital gain/loss in AGI: +$1,900 (reported on 9.5% of returns)
Here:
+$1,900
State:
+$11,232
(% of AGI for various income ranges: 0.2% for AGIs $25k-50k, 0.6% for AGIs $50k-75k, 1.0% for AGIs $75k-100k, 0.2% for AGIs $100k-200k)
Profit/loss from business: +$6,761 (reported on 14.6% of returns)
Here:
+$6,761
State:
+$12,773
(% of AGI for various income ranges: 6.2% for AGIs below $25k, 2.5% for AGIs $25k-50k, 2.0% for AGIs $50k-75k, 0.8% for AGIs $75k-100k, 1.4% for AGIs $100k-200k)
Taxable individual retirement arrangement distribution: $10,533 (reported on 7.6% of returns)
43318:
$10,533
Ohio:
$14,511
(% of AGI for various income ranges: 2.4% for AGIs below $25k, 2.1% for AGIs $25k-50k, 1.3% for AGIs $50k-75k, 3.8% for AGIs $75k-100k)
Total itemized deductions: $15,409 (19% of AGI, reported on 21.5% of returns)
Here:
$15,409
State:
$21,278
Here:
19.5% of AGI
State:
18.8% of AGI
(% of AGI for various income ranges: 6.9% for AGIs $25k-50k, 7.1% for AGIs $50k-75k, 7.4% for AGIs $75k-100k, 11.2% for AGIs $100k-200k)
Charity contributions: $3,912 (reported on 16.5% of returns)
Here:
$3,912
State:
$3,943
(% of AGI for various income ranges: 0.9% for AGIs $25k-50k, 1.2% for AGIs $50k-75k, 1.2% for AGIs $75k-100k, 3.0% for AGIs $100k-200k)
Taxes paid: $5,944 (reported on 21.5% of returns)
43318:
$5,944
State:
$9,568
(% of AGI for various income ranges: 0.9% for AGIs below $25k, 1.7% for AGIs $25k-50k, 2.4% for AGIs $50k-75k, 2.8% for AGIs $75k-100k, 5.4% for AGIs $100k-200k)
Earned income credit: $2,400 (reported on 15.8% of returns)
Here:
$2,400
State:
$2,285
(% of AGI for various income ranges: 5.5% for AGIs below $25k, 1.3% for AGIs $25k-50k)
Percentage of individuals using paid preparers for their 2012 taxes: 60.1%
Here:
60%
State:
51%
(% for various income ranges: 53.7% for AGIs below $25k, 62.5% for AGIs $25k-50k, 65.5% for AGIs $50k-75k, 60.0% for AGIs $75k-100k, 66.7% for AGIs $100k-200k)
Averages for the 2004 tax year for zip code 43318, filed in 2005:
Average Adjusted Gross Income (AGI) in 2004: $36,744 (Individual Income Tax Returns)
Here:
$36,744
State:
$44,480
Salary/wage: $35,475 (reported on 88.8% of returns)
Here:
$35,475
State:
$39,198
(% of AGI for various income ranges: 121.1% for AGIs below $10k, 76.1% for AGIs $10k-25k, 83.2% for AGIs $25k-50k, 89.2% for AGIs $50k-75k, 90.4% for AGIs $75k-100k, 82.6% for AGIs over 100k)
Taxable interest for individuals: $1,010 (reported on 42.6% of returns)
This zip code:
$1,010
Ohio:
$1,532
(% of AGI for various income ranges: 6.8% for AGIs below $10k, 2.3% for AGIs $10k-25k, 1.0% for AGIs $25k-50k, 1.4% for AGIs $50k-75k, 0.4% for AGIs $75k-100k, 0.3% for AGIs over 100k)
Taxable dividends: $686 (reported on 14.6% of returns)
Here:
$686
State:
$3,496
(% of AGI for various income ranges: 1.7% for AGIs below $10k, 0.2% for AGIs $10k-25k, 0.3% for AGIs $25k-50k, 0.2% for AGIs $50k-75k, 0.2% for AGIs $75k-100k, 0.3% for AGIs over 100k)
Net capital gain/loss: +$3,222 (reported on 10.3% of returns)
Here:
+$3,222
State:
+$8,582
(% of AGI for various income ranges: 1.5% for AGIs below $10k, 0.9% for AGIs $10k-25k, 0.6% for AGIs $25k-50k, 0.9% for AGIs $50k-75k, 0.1% for AGIs $75k-100k, 2.8% for AGIs over 100k)
Profit/loss from business: +$4,848 (reported on 15.9% of returns)
Here:
+$4,848
State:
+$10,813
(% of AGI for various income ranges: 3.1% for AGIs below $10k, 4.3% for AGIs $10k-25k, 3.7% for AGIs $25k-50k, 1.7% for AGIs $50k-75k, -0.4% for AGIs $75k-100k, 0.1% for AGIs over 100k)
IRA payment deduction: $2,621 (reported on 1.8% of returns)
43318:
$2,621
Ohio:
$2,794
Total itemized deductions: $12,790 (21% of AGI, reported on 27.4% of returns)
Here:
$12,790
State:
$17,503
Here:
21.2% of AGI
State:
20.8% of AGI
(% of AGI for various income ranges: 5.7% for AGIs $10k-25k, 9.4% for AGIs $25k-50k, 10.3% for AGIs $50k-75k, 10.1% for AGIs $75k-100k, 12.5% for AGIs over 100k)
Charity contributions deductions: $2,466 (4% of AGI, reported on 21.5% of returns)
Here:
$2,466
State:
$3,087
Here:
3.9% of AGI
State:
3.4% of AGI
(% of AGI for various income ranges: 0.7% for AGIs $10k-25k, 0.9% for AGIs $25k-50k, 1.8% for AGIs $50k-75k, 2.1% for AGIs $75k-100k, 1.9% for AGIs over 100k)
Total tax: $4,097 (reported on 77.5% of returns)
43318:
$4,097
State:
$6,781
(% of AGI for various income ranges: 2.9% for AGIs below $10k, 4.5% for AGIs $10k-25k, 7.0% for AGIs $25k-50k, 9.0% for AGIs $50k-75k, 10.7% for AGIs $75k-100k, 14.4% for AGIs over 100k)
Earned income credit: $1,651 (reported on 12.9% of returns)
Here:
$1,651
State:
$1,696
Percentage of individuals using paid preparers for their 2004 taxes: 63.5%
Here:
63%
State:
55%
(% for various income ranges: 58.9% for AGIs below $10k, 58.6% for AGIs $10k-25k, 69.2% for AGIs $25k-50k, 67.1% for AGIs $50k-75k, 55.0% for AGIs $75k-100k, 72.2% for AGIs over 100k)
Household received Food Stamps/SNAP in the past 12 months: 82 Household did not receive Food Stamps/SNAP in the past 12 months: 1,653
Women who had a birth in the past 12 months: 108 (111 now married, 0 unmarried) Women who did not have a birth in the past 12 months: 754 (329 now married, 424 unmarried)
Housing units in zip code 43318 with a mortgage: 929 (64 second mortgage, 10 home equity loan, 40 both second mortgage and home equity loan) Houses without a mortgage: 8
Median monthly owner costs for units with a mortgage: $1,217 Median monthly owner costs for units without a mortgage: $602
Residents with income below the poverty level in 2022:
This zip code:
5.4%
Whole state:
13.4%
Residents with income below 50% of the poverty level in 2022:
This zip code:
4.0%
Whole state:
7.0%
Median number of rooms in houses and condos:
Here:
6.8
State:
6.7
Median number of rooms in apartments:
Here:
6.6
State:
4.4
Notable locations in this zip code not listed on our city pages
Notable locations in zip code 43318: Shady Bowl Speedway (A), Sunnyside Farm (B), De Graff Branch Logan County District Library (C), Riverside Emergency Medical Services (D), Rosewood Fire Department (E), Degraff Fire Department (F). Display/hide their locations on the map
Churches in zip code 43318 include: Open Door Chapel (A), Stony Creek Church (B), Mount Tabor Church (C), First United Presbyterian Church (D), De Graff Baptist Church (E), De Graff United Methodist Church (F), Logansville Community Church (G). Display/hide their locations on the map
Cemeteries: Salem Cemetery (1), Calland Cemetery (2), Greenwood Cemetery (3), Halterman Cemetery (4), Hearst Cemetery (5), Huber Cemetery (6), Wilkson Cemetery (7). Display/hide their locations on the map
Creeks: Lee Creek (A), Indian Creek (B), Graves Creek (C), Rum Creek (D), Stony Creek (E), McKees Creek (F), Bokengehalas Creek (G), Brandywine Creek (H), Wheeler Creek (I). Display/hide their locations on the map
Size of family households: 485 2-persons, 464 3-persons, 171 4-persons, 97 5-persons, 30 6-persons, 29 7-or-more-persons
Size of nonfamily households: 352 1-person, 98 2-persons, 2 3-persons
527 married couples with children.
298 single-parent households (58 men, 240 women).
98.9% of residents of 43318 zip code speak English at home.
0.4% of residents speak Spanish at home (27% very well, 60% well, 13% not well).
Foreign born population: 16 (0.4%) (0.0% of them are naturalized citizens)
:
0.4%
Whole state:
5.0%
88%Honduras
32%German
17%American
13%Irish
12%English
3%Italian
2%Swiss
1%Eastern European
Year of entry for the foreign-born population
32010 or later
122000 to 2009
01990 to 1999
1Before 1990
Facilities with environmental interests located in this zip code:
CHAMPAIGN LANDMARK INC * (113 S KOKE ST in DE GRAFF, OH)
COMPLIANCE ACTIVITY (Tracking inspections of insecticide, fungicide, and rodenticide, and toxic substances) STATE MASTER (Ohio general info) - AIR MAJOR, EPCRA Business SIC classification: FERTILIZERS, MIXING ONLY
CHAMPAIGN LANDMARK DEGROFF (133 S KOKE ST in DE GRAFF, OH)
COMPLIANCE ACTIVITY (Tracking inspections of insecticide, fungicide, and rodenticide, and toxic substances)
Housing units lacking complete plumbing facilities: 3.7% Housing units lacking complete kitchen facilities: 3.5%
35.4%Bottled, tank, or LP gas
23.9%Utility gas
22.2%Electricity
14.1%Wood
2.8%Other fuel
1.5%Fuel oil, kerosene, etc.
Population in 1990: 3,452. Population change in the 1990s: +75 (+2.2%).
Place of birth for U.S.-born residents:
This state: 3,777
Northeast: 89
Midwest: 99
South: 178
West: 9
69% of the 43318 zip code residents lived in the same house 5 years ago. Out of people who lived in different houses, 72% lived in this county. Out of people who lived in different counties, 50% lived in Ohio.
97% of the 43318 zip code residents lived in the same house 1 year ago. Out of people who lived in different houses, 53% moved from this county. Out of people who lived in different houses, 46% moved from different county within same state. Out of people who lived in different houses, 10% moved from different state. Out of people who lived in different houses, 12% moved from abroad.
Private vs. public school enrollment:
Students in private schools in grades 1 to 8 (elementary and middle school): 18
Here:
4.5%
Ohio:
16.0%
Students in private schools in grades 9 to 12 (high school): 3
Here:
1.0%
Ohio:
13.1%
Students in private undergraduate colleges: 76
Here:
80.3%
Ohio:
22.3%
Occupation by median earnings in the past 12 months ($)
116,102Architecture and engineering occupations
89,486Community and social service occupations
82,031Management occupations
80,581Installation, maintenance, and repair occupations
65,791Transportation occupations
63,890Business and financial operations occupations
Top industries in this zip code by the number of employees in 2005:
Management of Companies and Enterprises: Corporate, Subsidiary, and Regional Managing Offices (50-99 employees: 1 establishment)
Accommodation and Food Services: Full-Service Restaurants (10-19: 1, 5-9: 2)
Finance and Insurance: Commercial Banking (10-19: 1)
Finance and Insurance: Savings Institutions (10-19: 1)
Construction: New Single-Family Housing Construction (except Operative Builders) (5-9: 1, 1-4: 3)
Construction: Residential Remodelers (5-9: 1)
Fatal accident statistics in 2010:
Fatal accident count: 2
Vehicles involved in fatal accidents: 2
Fatal accidents caused by drunken drivers: 2
Fatalities: 2
Persons involved in fatal accidents: 2
Pedestrians involved in fatal accidents: 0
2002 - 2018 National Fire Incident Reporting System (NFIRS) incidents
According to the data from the years 2002 - 2018 the average number of fire incidents per year is 28. The highest number of reported fires - 46 took place in 2009, and the least - 8 in 2014. The data has a rising trend.
When looking into fire subcategories, the most reports belonged to: Structure Fires (48.4%), and Outside Fires (39.5%).
Fire incident types reported to NFIRS in Zip Code 43318

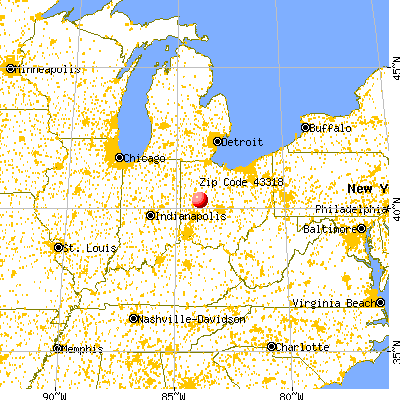


 Nearest zip codes: 43343, 43070, 45317, 45353, 43333, 45340.


 According to the data from the years 2002 - 2018 the average number of fire incidents per year is 28. The highest number of reported fires - 46 took place in 2009, and the least - 8 in 2014. The data has a rising trend.
 When looking into fire subcategories, the most reports belonged to: Structure Fires (48.4%), and Outside Fires (39.5%).