Estimated zip code population in 2022: 1,582 Zip code population in 2010: 2,323 Zip code population in 2000: 2,249
Houses and condos: 862 Renter-occupied apartments: 111
% of renters here:
15%
State:
33%
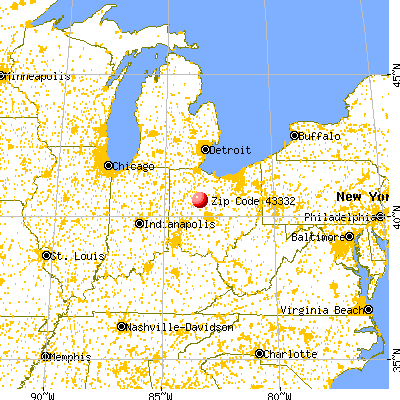
March 2022 cost of living index in zip code 43332: 81.7 (low, U.S. average is 100)
Land area: 63.2 sq. mi. Water area: 0.0 sq. mi.
Population density: 25 people per square mile
(very low).
OSM Map
General Map
Google Map
MSN Map
OSM Map
General Map
Google Map
MSN Map
OSM Map
General Map
Google Map
MSN Map
OSM Map
General Map
Google Map
MSN Map
Please wait while loading the map...
Real estate property taxes paid for housing units in 2022:
This zip code:
1.0% ($1,304)
Ohio:
1.3% ($2,639)
Median real estate property taxes paid for housing units with mortgages in 2022: $1,363 (1.0%) Median real estate property taxes paid for housing units with no mortgage in 2022: $1,175 (1.0%)
Business Search- 14 Million verified businesses
Males: 868
(54.9%)
Females: 714
(45.1%)
For population 25 years and over in 43332:
High school or higher: 93.5%
Bachelor's degree or higher: 17.8%
Graduate or professional degree: 9.1%
Unemployed: 0.9%
Mean travel time to work (commute): 28.1 minutes
For population 15 years and over in 43332:
Never married: 20.2%
Now married: 54.5%
Separated: 1.5%
Widowed: 8.7%
Divorced: 15.1%
Zip code 43332 compared to state average:
Median house value below state average.
Unemployed percentage significantly below state average.
Black race population percentage significantly below state average.
Hispanic race population percentage below state average.
Median age above state average.
Foreign-born population percentage significantly below state average.
Renting percentage below state average.
Length of stay since moving in significantly above state average.
House age above state average.
Percentage of population with a bachelor's degree or higher below state average.
Averages for the 2020 tax year for zip code 43332, filed in 2021:
Average Adjusted Gross Income (AGI) in 2020: $54,561 (Individual Income Tax Returns)
Here:
$54,561
State:
$67,288
Salary/wage: $45,118 (reported on 80.2% of returns)
Here:
$45,118
State:
$55,628
(% of AGI for various income ranges: 1016.7% for AGIs below $25k, 3616.1% for AGIs $25k-50k, 6485.8% for AGIs $50k-75k, 8044.3% for AGIs $75k-100k, 15535.7% for AGIs $100k-200k)
Taxable interest for individuals: $736 (reported on 26.0% of returns)
This zip code:
$736
Ohio:
$1,518
(% of AGI for various income ranges: 17.1% for AGIs below $25k, 5.2% for AGIs $25k-50k, 8.3% for AGIs $50k-75k, 44.3% for AGIs $75k-100k, 135.7% for AGIs $100k-200k)
Ordinary dividends: $1,629 (reported on 14.6% of returns)
Here:
$1,629
State:
$7,167
(% of AGI for various income ranges: 6.7% for AGIs below $25k, 3.5% for AGIs $25k-50k, 73.3% for AGIs $50k-75k, 168.6% for AGIs $100k-200k)
Net capital gain/loss in AGI: +$6,382 (reported on 11.5% of returns)
Here:
+$6,382
State:
+$18,919
(% of AGI for various income ranges: 14.3% for AGIs below $25k, 37.5% for AGIs $50k-75k, 895.7% for AGIs $100k-200k)
Profit/loss from business: +$7,790 (reported on 10.4% of returns)
Here:
+$7,790
State:
+$13,744
(% of AGI for various income ranges: 96.7% for AGIs below $25k, 87.4% for AGIs $25k-50k, 535.7% for AGIs $75k-100k)
Taxable individual retirement arrangement distribution: $16,064 (reported on 11.5% of returns)
43332:
$16,064
Ohio:
$18,876
(% of AGI for various income ranges: 214.3% for AGIs below $25k, 306.7% for AGIs $50k-75k, 1355.7% for AGIs $75k-100k)
Earned income credit: $2,173 (reported on 15.6% of returns)
Here:
$2,173
State:
$2,304
(% of AGI for various income ranges: 74.8% for AGIs below $25k, 73.5% for AGIs $25k-50k)
Percentage of individuals using paid preparers for their 2020 taxes: 96.9%
Here:
97%
State:
94%
(% for various income ranges: 93.1% for AGIs below $25k, 100.0% for AGIs $25k-50k, 94.1% for AGIs $50k-75k, 100.0% for AGIs $75k-100k, 100.0% for AGIs $100k-200k, 100.0% for AGIs over 200k)
Averages for the 2012 tax year for zip code 43332, filed in 2013:
Average Adjusted Gross Income (AGI) in 2012: $43,678 (Individual Income Tax Returns)
Here:
$43,678
State:
$54,926
Salary/wage: $37,046 (reported on 82.0% of returns)
Here:
$37,046
State:
$45,869
(% of AGI for various income ranges: 72.0% for AGIs below $25k, 79.7% for AGIs $25k-50k, 80.1% for AGIs $50k-75k, 78.5% for AGIs $75k-100k, 46.6% for AGIs $100k-200k)
Taxable interest for individuals: $773 (reported on 30.0% of returns)
This zip code:
$773
Ohio:
$1,297
(% of AGI for various income ranges: 1.0% for AGIs below $25k, 0.8% for AGIs $25k-50k, 0.3% for AGIs $50k-75k, 0.2% for AGIs $75k-100k, 0.5% for AGIs $100k-200k)
Ordinary dividends: $913 (reported on 15.0% of returns)
Here:
$913
State:
$5,821
(% of AGI for various income ranges: 0.2% for AGIs below $25k, 0.1% for AGIs $25k-50k, 0.2% for AGIs $50k-75k, 0.3% for AGIs $75k-100k, 0.6% for AGIs $100k-200k)
Net capital gain/loss in AGI: +$1,138 (reported on 8.0% of returns)
Here:
+$1,138
State:
+$11,232
(% of AGI for various income ranges: 0.4% for AGIs below $25k, 0.1% for AGIs $50k-75k, 0.5% for AGIs $100k-200k)
Profit/loss from business: +$7,327 (reported on 11.0% of returns)
Here:
+$7,327
State:
+$12,773
(% of AGI for various income ranges: 4.8% for AGIs below $25k, 1.0% for AGIs $25k-50k, 5.7% for AGIs $75k-100k)
Taxable individual retirement arrangement distribution: $8,260 (reported on 10.0% of returns)
43332:
$8,260
Ohio:
$14,511
(% of AGI for various income ranges: 2.2% for AGIs below $25k, 2.0% for AGIs $25k-50k, 6.1% for AGIs $50k-75k)
Total itemized deductions: $16,756 (19% of AGI, reported on 16.0% of returns)
Here:
$16,756
State:
$21,278
Here:
19.1% of AGI
State:
18.8% of AGI
(% of AGI for various income ranges: 5.0% for AGIs $25k-50k, 8.5% for AGIs $50k-75k, 6.2% for AGIs $75k-100k, 7.9% for AGIs $100k-200k)
Charity contributions: $2,627 (reported on 11.0% of returns)
Here:
$2,627
State:
$3,943
(% of AGI for various income ranges: 1.2% for AGIs $50k-75k, 1.0% for AGIs $75k-100k, 0.8% for AGIs $100k-200k)
Taxes paid: $6,300 (reported on 16.0% of returns)
43332:
$6,300
State:
$9,568
(% of AGI for various income ranges: 1.0% for AGIs $25k-50k, 2.5% for AGIs $50k-75k, 2.6% for AGIs $75k-100k, 4.0% for AGIs $100k-200k)
Earned income credit: $2,406 (reported on 18.0% of returns)
Here:
$2,406
State:
$2,285
(% of AGI for various income ranges: 6.5% for AGIs below $25k, 1.2% for AGIs $25k-50k)
Percentage of individuals using paid preparers for their 2012 taxes: 56.0%
Here:
56%
State:
51%
(% for various income ranges: 52.5% for AGIs below $25k, 60.7% for AGIs $25k-50k, 50.0% for AGIs $50k-75k, 60.0% for AGIs $75k-100k, 62.5% for AGIs $100k-200k)
Averages for the 2004 tax year for zip code 43332, filed in 2005:
Average Adjusted Gross Income (AGI) in 2004: $34,272 (Individual Income Tax Returns)
Here:
$34,272
State:
$44,480
Salary/wage: $33,638 (reported on 84.7% of returns)
Here:
$33,638
State:
$39,198
(% of AGI for various income ranges: 128.3% for AGIs below $10k, 75.0% for AGIs $10k-25k, 85.6% for AGIs $25k-50k, 83.7% for AGIs $50k-75k, 86.7% for AGIs $75k-100k, 72.3% for AGIs over 100k)
Taxable interest for individuals: $1,015 (reported on 38.1% of returns)
This zip code:
$1,015
Ohio:
$1,532
(% of AGI for various income ranges: 5.7% for AGIs below $10k, 2.8% for AGIs $10k-25k, 0.7% for AGIs $25k-50k, 0.9% for AGIs $50k-75k, 0.6% for AGIs $75k-100k, 0.9% for AGIs over 100k)
Taxable dividends: $568 (reported on 17.3% of returns)
Here:
$568
State:
$3,496
(% of AGI for various income ranges: 5.2% for AGIs below $10k, 0.6% for AGIs $10k-25k, 0.1% for AGIs $25k-50k, 0.2% for AGIs $50k-75k, 0.3% for AGIs $75k-100k, 0.1% for AGIs over 100k)
Net capital gain/loss: +$1,800 (reported on 12.3% of returns)
Here:
+$1,800
State:
+$8,582
(% of AGI for various income ranges: 2.7% for AGIs below $10k, 0.1% for AGIs $10k-25k, -0.0% for AGIs $25k-50k, 0.6% for AGIs $50k-75k, 2.2% for AGIs $75k-100k, 1.4% for AGIs over 100k)
Profit/loss from business: +$5,279 (reported on 12.2% of returns)
Here:
+$5,279
State:
+$10,813
(% of AGI for various income ranges: 10.5% for AGIs below $10k, 6.5% for AGIs $10k-25k, 0.7% for AGIs $25k-50k, 2.2% for AGIs $50k-75k)
IRA payment deduction: $3,000 (reported on 1.6% of returns)
43332:
$3,000
Ohio:
$2,794
Total itemized deductions: $12,399 (21% of AGI, reported on 17.8% of returns)
Here:
$12,399
State:
$17,503
Here:
20.9% of AGI
State:
20.8% of AGI
(% of AGI for various income ranges: 6.2% for AGIs $10k-25k, 5.2% for AGIs $25k-50k, 5.8% for AGIs $50k-75k, 8.1% for AGIs $75k-100k, 11.4% for AGIs over 100k)
Charity contributions deductions: $1,810 (3% of AGI, reported on 11.9% of returns)
Here:
$1,810
State:
$3,087
Here:
2.8% of AGI
State:
3.4% of AGI
(% of AGI for various income ranges: 0.3% for AGIs $10k-25k, 0.4% for AGIs $25k-50k, 1.0% for AGIs $50k-75k, 0.8% for AGIs $75k-100k, 0.7% for AGIs over 100k)
Total tax: $3,777 (reported on 77.0% of returns)
43332:
$3,777
State:
$6,781
(% of AGI for various income ranges: 5.5% for AGIs below $10k, 4.5% for AGIs $10k-25k, 6.9% for AGIs $25k-50k, 9.1% for AGIs $50k-75k, 10.0% for AGIs $75k-100k, 16.0% for AGIs over 100k)
Earned income credit: $1,560 (reported on 15.0% of returns)
Here:
$1,560
State:
$1,696
Percentage of individuals using paid preparers for their 2004 taxes: 53.5%
Here:
54%
State:
55%
(% for various income ranges: 43.9% for AGIs below $10k, 56.9% for AGIs $10k-25k, 54.5% for AGIs $25k-50k, 53.4% for AGIs $50k-75k, 53.3% for AGIs $75k-100k, 76.0% for AGIs over 100k)
Likely homosexual households (counted as self-reported same-sex unmarried-partner households)
Lesbian couples: 0.3% of all households
Gay men: 0.5% of all households
Household received Food Stamps/SNAP in the past 12 months: 68 Household did not receive Food Stamps/SNAP in the past 12 months: 668
Women who did not have a birth in the past 12 months: 291 (150 now married, 141 unmarried)
Housing units in zip code 43332 with a mortgage: 363 (114 second mortgage, 117 both second mortgage and home equity loan) Median monthly owner costs for units with a mortgage: $923 Median monthly owner costs for units without a mortgage: $495
Residents with income below the poverty level in 2022:
This zip code:
12.8%
Whole state:
13.4%
Residents with income below 50% of the poverty level in 2022:
This zip code:
4.7%
Whole state:
7.0%
Median number of rooms in houses and condos:
Here:
7.3
State:
6.7
Median number of rooms in apartments:
Here:
5.9
State:
4.4
Notable locations in this zip code not listed on our city pages
Notable locations in zip code 43332: Bell Corners (A), Devries Dairy (B), Stofcheck Ambulance Service (C), Scioto Valley Fire District (D). Display/hide their locations on the map
Streams, rivers, and creeks: Dudley Run (A), Brown Run (B), Ash Run (C), Little Tymochtee Creek (D), Pawpaw Run (E), McDonald Creek (F), Wildcat Creek (G). Display/hide their locations on the map
Size of family households: 276 2-persons, 64 3-persons, 41 4-persons, 1 5-persons, 16 6-persons, 5 7-or-more-persons
Size of nonfamily households: 257 1-person, 77 2-persons
168 married couples with children.
64 single-parent households (17 men, 47 women).
98.1% of residents of 43332 zip code speak English at home.
1.0% of residents speak Spanish at home (19% very well, 81% well).
0.6% of residents speak other Indo-European language at home (100% very well).
0.1% of residents speak Asian or Pacific Island language at home (100% very well).
Foreign born population: 10 (0.6%) (20.3% of them are naturalized citizens)
This zip code:
0.6%
Whole state:
5.0%
80%Honduras
20%France
34%American
17%German
8%English
7%Irish
7%Romanian
4%Italian
3%Norwegian
Year of entry for the foreign-born population
52010 or later
22000 to 2009
01990 to 1999
1Before 1990
Facilities with environmental interests located in this zip code:
AMOCO FERTILIZER PLANT (DECLIFF RD SOUTH OF HWY 309 in LA RUE, OH)
STATE MASTER (Ohio general info) - RCRA-OHD000721894, HAZARDOUS WASTE PROGRAM (Resource Conservation and Recovery Act (tracking hazardous waste))
Housing units lacking complete plumbing facilities: 3.2% Housing units lacking complete kitchen facilities: 4.3%
36.6%Bottled, tank, or LP gas
34.8%Utility gas
17.3%Wood
11.6%Electricity
Population in 1990: 2,120. Population change in the 1990s: +129 (+6.1%).
Place of birth for U.S.-born residents:
This state: 1,340
Northeast: 9
Midwest: 81
South: 56
West: 84
79% of the 43332 zip code residents lived in the same house 5 years ago. Out of people who lived in different houses, 70% lived in this county. Out of people who lived in different counties, 50% lived in Ohio.
99% of the 43332 zip code residents lived in the same house 1 year ago. Out of people who lived in different houses, 122% moved from this county. Out of people who lived in different houses, 11% moved from different state.
Private vs. public school enrollment:
Students in private schools in grades 1 to 8 (elementary and middle school): 26
Here:
17.0%
Ohio:
16.0%
Students in private schools in grades 9 to 12 (high school):
Here:
0.0%
Ohio:
13.1%
Students in private undergraduate colleges:
Here:
0.0%
Ohio:
22.3%
Occupation by median earnings in the past 12 months ($)
66,591Education, training, and library occupations
64,904Management occupations
56,998Health diagnosing and treating practitioners and other technical occupations
49,606Construction and extraction occupations
48,497Office and administrative support occupations
44,284Production occupations
Top industries in this zip code by the number of employees in 2005:
Construction: Other Building Equipment Contractors (10-19 employees: 1 establishment)
Construction: Commercial and Institutional Building Construction (5-9: 2)
Finance and Insurance: Insurance Agencies and Brokerages (5-9: 1, 1-4: 1)
Health Care and Social Assistance: Ambulance Services (5-9: 1)
Construction: Framing Contractors (5-9: 1)
Finance and Insurance: Commercial Banking (5-9: 1)
Accommodation and Food Services: Full-Service Restaurants (5-9: 1)
Other Services (except Public Administration): Religious Organizations (1-4: 3)
Fatal accident statistics in 2014:
Fatal accident count: 1
Vehicles involved in fatal accidents: 2
Fatal accidents caused by drunken drivers: 0
Fatalities: 1
Persons involved in fatal accidents: 2
Pedestrians involved in fatal accidents: 0
Fatal accident statistics in 2013:
Fatal accident count: 1
Vehicles involved in fatal accidents: 1
Fatal accidents caused by drunken drivers: 0
Fatalities: 1
Persons involved in fatal accidents: 1
Pedestrians involved in fatal accidents: 0
2002 - 2018 National Fire Incident Reporting System (NFIRS) incidents
According to the data from the years 2002 - 2018 the average number of fires per year is 23. The highest number of reported fire incidents - 45 took place in 2007, and the least - 8 in 2011. The data has a dropping trend.
When looking into fire subcategories, the most reports belonged to: Structure Fires (61.4%), and Outside Fires (26.1%).
Fire incident types reported to NFIRS in Zip Code 43332


 Nearest zip codes: 43341, 43340, 43337, 43344, 43322, 43323.


 According to the data from the years 2002 - 2018 the average number of fires per year is 23. The highest number of reported fire incidents - 45 took place in 2007, and the least - 8 in 2011. The data has a dropping trend.
 When looking into fire subcategories, the most reports belonged to: Structure Fires (61.4%), and Outside Fires (26.1%).