Estimated zip code population in 2022: 4,159 Zip code population in 2010: 4,362 Zip code population in 2000: 4,462
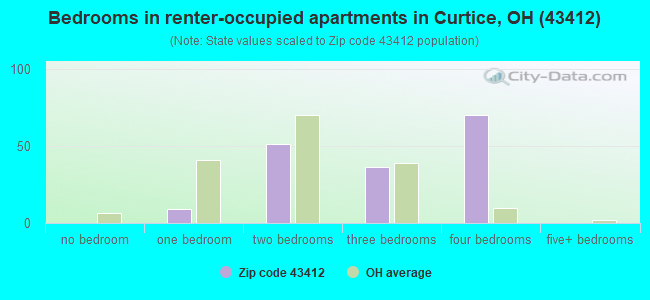
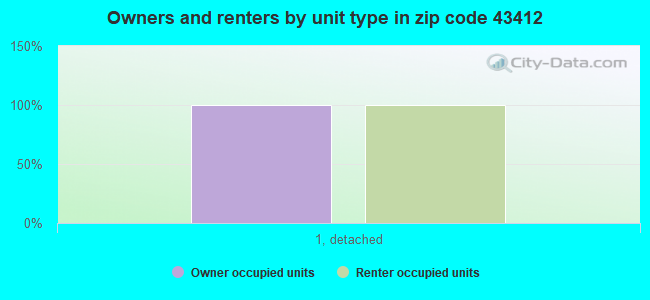
Houses and condos: 1,779 Renter-occupied apartments: 169
% of renters here:
11%
State:
33%
March 2022 cost of living index in zip code 43412: 83.6 (less than average, U.S. average is 100)
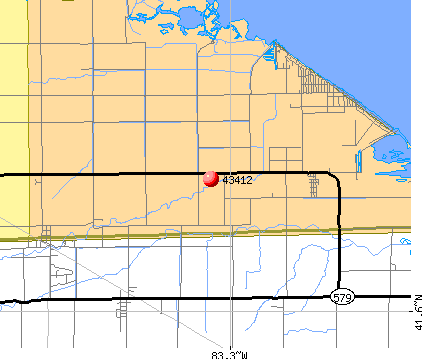
Land area: 28.9 sq. mi. Water area: 0.8 sq. mi.
Population density: 144 people per square mile
(very low).
OSM Map
General Map
Google Map
MSN Map
OSM Map
General Map
Google Map
MSN Map
OSM Map
General Map
Google Map
MSN Map
OSM Map
General Map
Google Map
MSN Map
Please wait while loading the map...
Real estate property taxes paid for housing units in 2022:
This zip code:
1.3% ($2,958)
Ohio:
1.3% ($2,639)
Median real estate property taxes paid for housing units with mortgages in 2022: $2,784 (1.2%) Median real estate property taxes paid for housing units with no mortgage in 2022: $3,245 (1.5%)
Business Search- 14 Million verified businesses
Males: 2,258
(54.3%)
Females: 1,901
(45.7%)
For population 25 years and over in 43412:
High school or higher: 97.0%
Bachelor's degree or higher: 26.6%
Graduate or professional degree: 11.4%
Unemployed: 1.0%
Mean travel time to work (commute): 25.2 minutes
For population 15 years and over in 43412:
Never married: 19.6%
Now married: 68.1%
Separated: 0.8%
Widowed: 3.1%
Divorced: 8.4%
Zip code 43412 compared to state average:
Unemployed percentage significantly below state average.
Black race population percentage significantly below state average.
Median age above state average.
Foreign-born population percentage below state average.
Renting percentage significantly below state average.
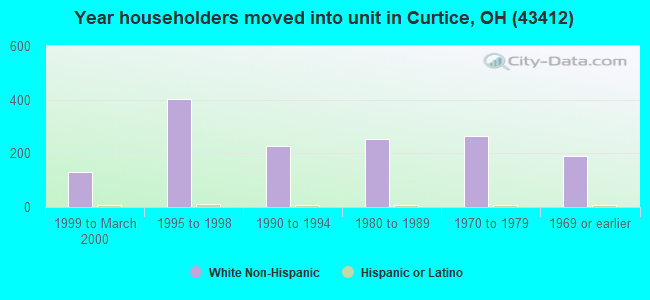
Length of stay since moving in significantly above state average.
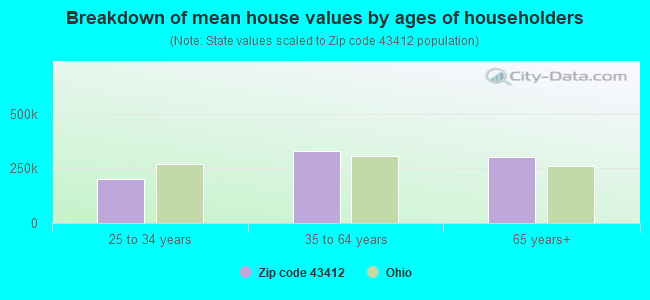
Estimated median house/condo value in 2022: $227,928
43412:
$227,928
Ohio:
$204,100
According to our research of Ohio and other state lists, there were 5 registered sex offenders living in 43412 zip code as of May 28, 2024. The ratio of all residents to sex offenders in zip code 43412 is 944 to 1. The ratio of registered sex offenders to all residents in this zip code is lower than the state average.
Median resident age:
This zip code:
47.4 years
Ohio median age:
39.9 years
Average household size:
This zip code:
2.7 people
Ohio:
2.4 people
Averages for the 2020 tax year for zip code 43412, filed in 2021:
Average Adjusted Gross Income (AGI) in 2020: $71,128 (Individual Income Tax Returns)
Here:
$71,128
State:
$67,288
Salary/wage: $61,376 (reported on 79.6% of returns)
Here:
$61,376
State:
$55,628
(% of AGI for various income ranges: 1053.4% for AGIs below $25k, 3288.3% for AGIs $25k-50k, 6049.1% for AGIs $50k-75k, 8417.9% for AGIs $75k-100k, 15825.5% for AGIs $100k-200k, 53546.7% for AGIs over 200k)
Taxable interest for individuals: $1,097 (reported on 31.2% of returns)
This zip code:
$1,097
Ohio:
$1,518
(% of AGI for various income ranges: 19.5% for AGIs below $25k, 22.5% for AGIs $25k-50k, 60.9% for AGIs $50k-75k, 27.9% for AGIs $75k-100k, 75.5% for AGIs $100k-200k, 613.3% for AGIs over 200k)
Ordinary dividends: $3,064 (reported on 21.3% of returns)
Here:
$3,064
State:
$7,167
(% of AGI for various income ranges: 17.6% for AGIs below $25k, 40.6% for AGIs $25k-50k, 71.7% for AGIs $50k-75k, 73.7% for AGIs $75k-100k, 194.1% for AGIs $100k-200k, 1180.0% for AGIs over 200k)
Net capital gain/loss in AGI: +$4,998 (reported on 20.4% of returns)
Here:
+$4,998
State:
+$18,919
(% of AGI for various income ranges: 11.2% for AGIs below $25k, 32.8% for AGIs $25k-50k, 88.3% for AGIs $50k-75k, 128.9% for AGIs $75k-100k, 399.0% for AGIs $100k-200k, 1600.0% for AGIs over 200k)
Profit/loss from business: +$12,971 (reported on 12.7% of returns)
Here:
+$12,971
State:
+$13,744
(% of AGI for various income ranges: 96.8% for AGIs below $25k, 104.4% for AGIs $25k-50k, 202.2% for AGIs $50k-75k, 213.7% for AGIs $75k-100k, 685.5% for AGIs $100k-200k)
Taxable individual retirement arrangement distribution: $19,074 (reported on 12.2% of returns)
43412:
$19,074
Ohio:
$18,876
(% of AGI for various income ranges: 60.2% for AGIs below $25k, 174.2% for AGIs $25k-50k, 389.1% for AGIs $50k-75k, 467.4% for AGIs $75k-100k, 859.7% for AGIs $100k-200k)
Total itemized deductions: $25,200 (reported on 5.0% of returns)
Here:
$25,200
State:
$33,869
(% of AGI for various income ranges: 176.1% for AGIs $25k-50k, 226.3% for AGIs $75k-100k, 589.0% for AGIs $100k-200k)
Charity contributions: $6,814 (reported on 3.2% of returns)
Here:
$6,814
State:
$14,577
(% of AGI for various income ranges: 35.2% for AGIs $50k-75k, 136.6% for AGIs $100k-200k)
Taxes paid: $6,855 (reported on 5.0% of returns)
43412:
$6,855
State:
$7,681
(% of AGI for various income ranges: 33.9% for AGIs $25k-50k, 64.2% for AGIs $75k-100k, 175.9% for AGIs $100k-200k)
Earned income credit: $2,215 (reported on 9.0% of returns)
Here:
$2,215
State:
$2,304
(% of AGI for various income ranges: 69.0% for AGIs below $25k, 44.4% for AGIs $25k-50k)
Percentage of individuals using paid preparers for their 2020 taxes: 95.0%
Here:
95%
State:
94%
(% for various income ranges: 94.9% for AGIs below $25k, 93.9% for AGIs $25k-50k, 97.0% for AGIs $50k-75k, 96.2% for AGIs $75k-100k, 93.5% for AGIs $100k-200k, 100.0% for AGIs over 200k)
Averages for the 2012 tax year for zip code 43412, filed in 2013:
Average Adjusted Gross Income (AGI) in 2012: $59,552 (Individual Income Tax Returns)
Here:
$59,552
State:
$54,926
Salary/wage: $52,578 (reported on 84.1% of returns)
Here:
$52,578
State:
$45,869
(% of AGI for various income ranges: 69.3% for AGIs below $25k, 69.5% for AGIs $25k-50k, 73.8% for AGIs $50k-75k, 78.9% for AGIs $75k-100k, 79.2% for AGIs $100k-200k, 63.8% for AGIs over 200k)
Taxable interest for individuals: $1,206 (reported on 36.0% of returns)
This zip code:
$1,206
Ohio:
$1,297
(% of AGI for various income ranges: 1.4% for AGIs below $25k, 0.8% for AGIs $25k-50k, 0.5% for AGIs $50k-75k, 0.5% for AGIs $75k-100k, 0.4% for AGIs $100k-200k, 1.7% for AGIs over 200k)
Ordinary dividends: $2,102 (reported on 22.4% of returns)
Here:
$2,102
State:
$5,821
(% of AGI for various income ranges: 0.8% for AGIs below $25k, 1.0% for AGIs $25k-50k, 0.6% for AGIs $50k-75k, 0.4% for AGIs $75k-100k, 0.9% for AGIs $100k-200k, 1.0% for AGIs over 200k)
Net capital gain/loss in AGI: +$1,449 (reported on 16.4% of returns)
Here:
+$1,449
State:
+$11,232
(% of AGI for various income ranges: 0.1% for AGIs $25k-50k, 0.7% for AGIs $100k-200k, 1.3% for AGIs over 200k)
Profit/loss from business: +$12,936 (reported on 11.7% of returns)
Here:
+$12,936
State:
+$12,773
(% of AGI for various income ranges: 4.4% for AGIs below $25k, 2.8% for AGIs $25k-50k, 2.1% for AGIs $50k-75k, 1.9% for AGIs $75k-100k, 3.7% for AGIs $100k-200k)
Taxable individual retirement arrangement distribution: $14,992 (reported on 11.7% of returns)
43412:
$14,992
Ohio:
$14,511
(% of AGI for various income ranges: 4.7% for AGIs below $25k, 3.7% for AGIs $25k-50k, 3.1% for AGIs $50k-75k, 2.8% for AGIs $75k-100k, 3.5% for AGIs $100k-200k)
Total itemized deductions: $18,932 (18% of AGI, reported on 36.9% of returns)
Here:
$18,932
State:
$21,278
Here:
18.4% of AGI
State:
18.8% of AGI
(% of AGI for various income ranges: 8.1% for AGIs below $25k, 10.2% for AGIs $25k-50k, 10.7% for AGIs $50k-75k, 11.5% for AGIs $75k-100k, 14.0% for AGIs $100k-200k, 11.3% for AGIs over 200k)
Charity contributions: $2,374 (reported on 29.0% of returns)
Here:
$2,374
State:
$3,943
(% of AGI for various income ranges: 0.6% for AGIs below $25k, 1.0% for AGIs $25k-50k, 1.0% for AGIs $50k-75k, 0.7% for AGIs $75k-100k, 1.5% for AGIs $100k-200k, 1.5% for AGIs over 200k)
Taxes paid: $8,128 (reported on 36.9% of returns)
43412:
$8,128
State:
$9,568
(% of AGI for various income ranges: 1.7% for AGIs below $25k, 3.2% for AGIs $25k-50k, 3.9% for AGIs $50k-75k, 4.5% for AGIs $75k-100k, 6.5% for AGIs $100k-200k, 6.8% for AGIs over 200k)
Earned income credit: $2,113 (reported on 10.7% of returns)
Here:
$2,113
State:
$2,285
(% of AGI for various income ranges: 4.3% for AGIs below $25k, 0.7% for AGIs $25k-50k)
Percentage of individuals using paid preparers for their 2012 taxes: 59.3%
Here:
59%
State:
51%
(% for various income ranges: 52.1% for AGIs below $25k, 62.8% for AGIs $25k-50k, 61.8% for AGIs $50k-75k, 63.0% for AGIs $75k-100k, 62.5% for AGIs $100k-200k, 80.0% for AGIs over 200k)
Averages for the 2004 tax year for zip code 43412, filed in 2005:
Average Adjusted Gross Income (AGI) in 2004: $46,360 (Individual Income Tax Returns)
Here:
$46,360
State:
$44,480
Salary/wage: $43,666 (reported on 85.8% of returns)
Here:
$43,666
State:
$39,198
(% of AGI for various income ranges: 97.6% for AGIs below $10k, 70.5% for AGIs $10k-25k, 78.3% for AGIs $25k-50k, 81.9% for AGIs $50k-75k, 90.8% for AGIs $75k-100k, 75.8% for AGIs over 100k)
Taxable interest for individuals: $1,232 (reported on 49.5% of returns)
This zip code:
$1,232
Ohio:
$1,532
(% of AGI for various income ranges: 4.3% for AGIs below $10k, 3.3% for AGIs $10k-25k, 1.5% for AGIs $25k-50k, 0.9% for AGIs $50k-75k, 0.7% for AGIs $75k-100k, 1.3% for AGIs over 100k)
Taxable dividends: $1,307 (reported on 24.6% of returns)
Here:
$1,307
State:
$3,496
(% of AGI for various income ranges: 3.5% for AGIs below $10k, 0.8% for AGIs $10k-25k, 0.7% for AGIs $25k-50k, 0.5% for AGIs $50k-75k, 0.3% for AGIs $75k-100k, 1.0% for AGIs over 100k)
Net capital gain/loss: +$2,588 (reported on 18.0% of returns)
Here:
+$2,588
State:
+$8,582
(% of AGI for various income ranges: 2.9% for AGIs below $10k, -0.2% for AGIs $10k-25k, 0.5% for AGIs $25k-50k, 0.5% for AGIs $50k-75k, 0.2% for AGIs $75k-100k, 2.7% for AGIs over 100k)
Profit/loss from business: +$13,020 (reported on 11.3% of returns)
Here:
+$13,020
State:
+$10,813
(% of AGI for various income ranges: -0.3% for AGIs below $10k, 4.9% for AGIs $10k-25k, 3.3% for AGIs $25k-50k, 2.6% for AGIs $50k-75k, 0.7% for AGIs $75k-100k, 5.3% for AGIs over 100k)
IRA payment deduction: $3,429 (reported on 2.3% of returns)
43412:
$3,429
Ohio:
$2,794
Total itemized deductions: $15,887 (21% of AGI, reported on 40.9% of returns)
Here:
$15,887
State:
$17,503
Here:
21.1% of AGI
State:
20.8% of AGI
(% of AGI for various income ranges: 7.3% for AGIs $10k-25k, 11.7% for AGIs $25k-50k, 15.3% for AGIs $50k-75k, 15.5% for AGIs $75k-100k, 16.1% for AGIs over 100k)
Charity contributions deductions: $1,760 (2% of AGI, reported on 34.3% of returns)
Here:
$1,760
State:
$3,087
Here:
2.2% of AGI
State:
3.4% of AGI
(% of AGI for various income ranges: 0.6% for AGIs $10k-25k, 1.1% for AGIs $25k-50k, 1.3% for AGIs $50k-75k, 1.1% for AGIs $75k-100k, 1.9% for AGIs over 100k)
Total tax: $6,010 (reported on 80.6% of returns)
43412:
$6,010
State:
$6,781
(% of AGI for various income ranges: 2.0% for AGIs below $10k, 4.4% for AGIs $10k-25k, 7.7% for AGIs $25k-50k, 9.3% for AGIs $50k-75k, 10.2% for AGIs $75k-100k, 16.0% for AGIs over 100k)
Earned income credit: $1,672 (reported on 8.6% of returns)
Here:
$1,672
State:
$1,696
Percentage of individuals using paid preparers for their 2004 taxes: 58.1%
Here:
58%
State:
55%
(% for various income ranges: 43.5% for AGIs below $10k, 53.9% for AGIs $10k-25k, 64.7% for AGIs $25k-50k, 62.3% for AGIs $50k-75k, 62.9% for AGIs $75k-100k, 63.5% for AGIs over 100k)
Household received Food Stamps/SNAP in the past 12 months: 8 Household did not receive Food Stamps/SNAP in the past 12 months: 1,542
Women who had a birth in the past 12 months: 54 (55 now married, 0 unmarried) Women who did not have a birth in the past 12 months: 636 (356 now married, 279 unmarried)
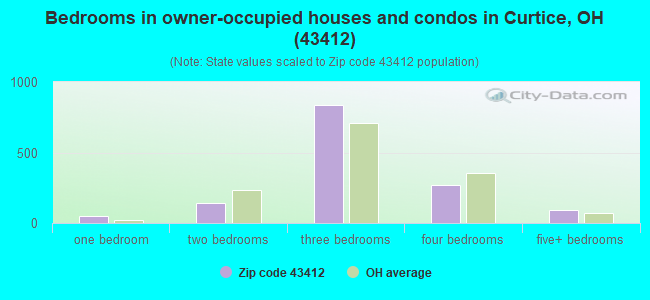
Housing units in zip code 43412 with a mortgage: 873 (124 second mortgage, 24 home equity loan, 103 both second mortgage and home equity loan) Houses without a mortgage: 118
Median monthly owner costs for units with a mortgage: $1,397 Median monthly owner costs for units without a mortgage: $586
Residents with income below the poverty level in 2022:
This zip code:
8.9%
Whole state:
13.4%
Residents with income below 50% of the poverty level in 2022:
This zip code:
5.5%
Whole state:
7.0%
Median number of rooms in houses and condos:
Here:
6.8
State:
6.7
Median number of rooms in apartments:
Here:
5.9
State:
4.4
Notable locations in this zip code not listed on our city pages
Notable locations in zip code 43412: Willow Club (A), Anchor Point Marina (B), Jerusalem Township Fire Department (C). Display/hide their locations on the map
Size of family households: 607 2-persons, 289 3-persons, 198 4-persons, 151 5-persons, 10 6-persons, 9 7-or-more-persons
Size of nonfamily households: 254 1-person, 24 2-persons
667 married couples with children.
97 single-parent households (79 men, 18 women).
95.0% of residents of 43412 zip code speak English at home.
0.6% of residents speak Spanish at home (100% very well).
0.4% of residents speak other Indo-European language at home (100% very well).
3.7% of residents speak other language at home (81% very well, 19% well).
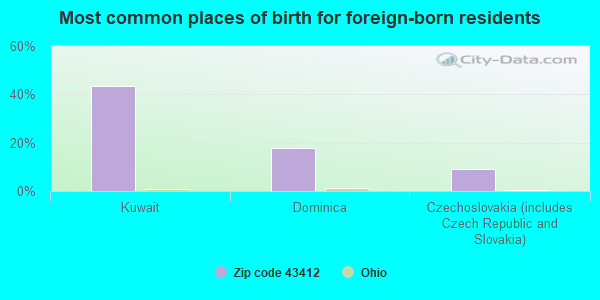
Foreign born population: 129 (3.1%) (84.4% of them are naturalized citizens)
This zip code:
3.1%
Whole state:
5.0%
43%Kuwait
18%Dominica
9%Czechoslovakia (includes Czech Republic and Slovakia)
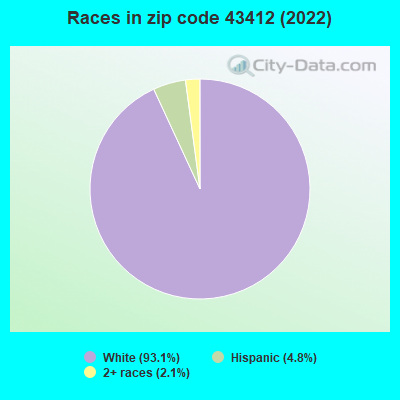
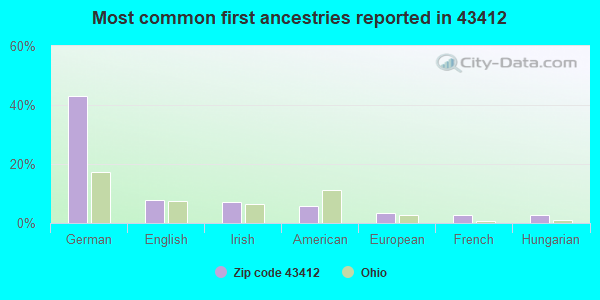
43%German
8%English
7%Irish
6%American
3%European
3%French
3%Hungarian
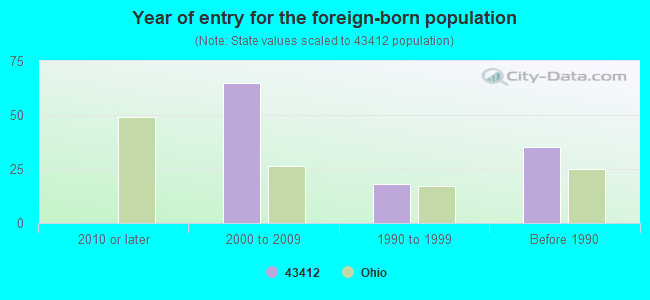
Year of entry for the foreign-born population
02010 or later
652000 to 2009
181990 to 1999
35Before 1990
Facilities with environmental interests located in this zip code:
ACKERMAN GEORGE F CO (300 MILL ST in CURTICE, OH)
ENFORCEMENT/COMPLIANCE ACTIVITY (Integrated Compliance Information System) - ICIS-HQ-2000-0179, FORMAL ENFORCEMENT ACTION (Integrated Compliance Information System) - ICIS-HQ-2000-0179, FORMAL ENFORCEMENT ACTION STATE MASTER (Ohio general info) - RCRA-OHD986998060, HAZARDOUS WASTE PROGRAM Small Quantity Generators, between 100 kg and 1000 kg of hazardous waste/month (Resource Conservation and Recovery Act (tracking hazardous waste)) - notification Business SIC classification: CONSTRUCTION AND MINING (EXCEPT PETROLEUM) MACHINERY AND EQUIPMENT Organizations: UNKNOWN (CONTACT/OWNER)
ALLEN PARK MOBILE COURT (24521 W RESERVATION LINE RD in CURTICE, OH)
(Integrated Compliance Information System) - ICIS-05-2003-4111, FORMAL ENFORCEMENT ACTION ENFORCEMENT/COMPLIANCE ACTIVITY (Integrated Compliance Information System) STATE MASTER (Ohio general info) - SDWIS-6204112, DRINKING WATER PROGRAM COMMUNITY WATER SYSTEM (SDWIS) - SDWIS-OH6204112 1, WATER TREATMENT PLANT WATER TREATMENT PLANT (SDWIS)
ANCHOR POINTE MARINA F-G BANK (10905 COURDEROY RD in CURTICE, OH)
STATE MASTER (Ohio general info) - RCRA-OHD987009677, HAZARDOUS WASTE PROGRAM, AIR MAJOR, SDWIS-4839312, DRINKING WATER PROGRAM STATE MASTER (Ohio general info) - SDWIS-4839112, DRINKING WATER PROGRAM Conditionally Exempt Small Quantity Generators, less than 100 kg/month of hazardous waste (Resource Conservation and Recovery Act (tracking hazardous waste)) Organizations: ANCHORPOINT BOAT (CONTACT/OWNER)
, ANCHOR POINTE MARINA C-BANK (CONTACT/OWNER)
Alternative names: ANCHOR POINTE MARINA C-BANK, ANCHORPOINT MARINA
ALLEN ELEMENTARY SCHOOL (4865 N GENOA CLAY CENTER RD in CURTICE, OH)
(Geographic Names Information System) (National Center for Education Statistics) - STATE ID-000356 Organizations: GENOA AREA LOCAL SD (SCHOOL DISTRICT)
Housing units lacking complete plumbing facilities: 4.6% Housing units lacking complete kitchen facilities: 4.7%
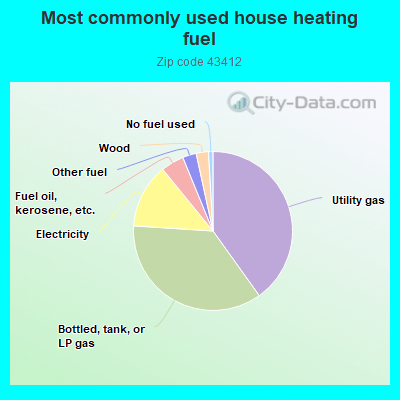
40.2%Utility gas
36.0%Bottled, tank, or LP gas
13.1%Electricity
4.7%Fuel oil, kerosene, etc.
2.8%Other fuel
2.5%Wood
0.9%No fuel used
Population in 1990: 2,426. Population change in the 1990s: +2,036 (+83.9%).
Place of birth for U.S.-born residents:
This state: 3,646
Northeast: 24
Midwest: 187
South: 106
West: 64
69% of the 43412 zip code residents lived in the same house 5 years ago. Out of people who lived in different houses, 44% lived in this county. Out of people who lived in different counties, 50% lived in Ohio.
95% of the 43412 zip code residents lived in the same house 1 year ago. Out of people who lived in different houses, 81% moved from this county. Out of people who lived in different houses, 8% moved from different county within same state. Out of people who lived in different houses, 9% moved from different state. Out of people who lived in different houses, 7% moved from abroad.
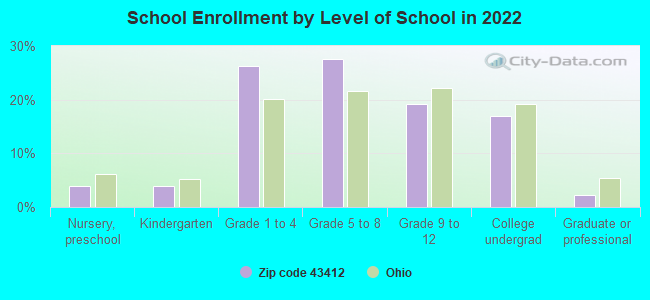
Private vs. public school enrollment:
Students in private schools in grades 1 to 8 (elementary and middle school): 97
Here:
21.4%
Ohio:
16.0%
Students in private schools in grades 9 to 12 (high school): 22
Here:
14.0%
Ohio:
13.1%
Students in private undergraduate colleges: 59
Here:
41.9%
Ohio:
22.3%
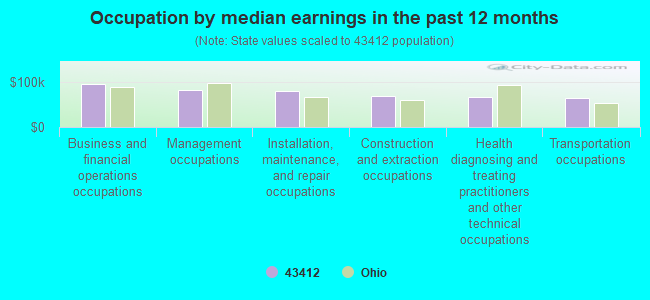
Occupation by median earnings in the past 12 months ($)
95,054Business and financial operations occupations
81,315Management occupations
79,614Installation, maintenance, and repair occupations
69,168Construction and extraction occupations
67,382Health diagnosing and treating practitioners and other technical occupations
64,972Transportation occupations
Top industries in this zip code by the number of employees in 2005:
Health Care and Social Assistance: Child and Youth Services (20-49 employees: 1 establishment)
Arts, Entertainment, and Recreation: Marinas (10-19: 1, 1-4: 1)
Wholesale Trade: Farm and Garden Machinery and Equipment Merchant Wholesalers (10-19: 1)
Real Estate and Rental and Leasing: Other Commercial and Industrial Machinery and Equipment Rental and Leasing (10-19: 1)
Administrative and Support and Waste Management and Remediation Services: Janitorial Services (5-9: 1, 1-4: 2)
Construction: Site Preparation Contractors (5-9: 1, 1-4: 1)
People in group quarters in 2000:
130 people in schools, hospitals, or wards for the intellectually disabled
5 people in agriculture workers' dormitories on farms
Fatal accident statistics in 2014:
Fatal accident count: 1
Vehicles involved in fatal accidents: 1
Fatal accidents caused by drunken drivers: 0
Fatalities: 1
Persons involved in fatal accidents: 3
Pedestrians involved in fatal accidents: 0
Fatal accident statistics in 2013:
Fatal accident count: 1
Vehicles involved in fatal accidents: 2
Fatal accidents caused by drunken drivers: 1
Fatalities: 1
Persons involved in fatal accidents: 1
Pedestrians involved in fatal accidents: 0
Home Mortgage Disclosure Act Aggregated Statistics For Year 2009 (Based on 4 partial tracts)
A) FHA, FSA/RHS & VA Home Purchase Loans
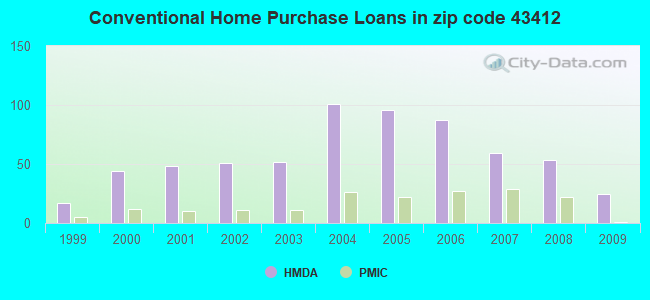
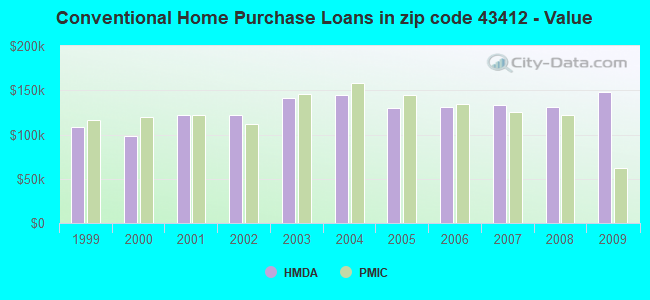
B) Conventional Home Purchase Loans
C) Refinancings
D) Home Improvement Loans
F) Non-occupant Loans on < 5 Family Dwellings (A B C & D)
Number
Average Value
Number
Average Value
Number
Average Value
Number
Average Value
Number
Average Value
LOANS ORIGINATED
7
$92,260
25
$147,472
148
$138,511
8
$22,155
3
$164,220
APPLICATIONS APPROVED, NOT ACCEPTED
5
$117,492
2
$208,305
13
$166,314
2
$12,105
1
$146,560
APPLICATIONS DENIED
1
$99,210
1
$62,010
64
$144,656
8
$38,756
3
$96,767
APPLICATIONS WITHDRAWN
2
$127,190
4
$153,935
32
$186,552
1
$121,990
1
$31,660
FILES CLOSED FOR INCOMPLETENESS
0
$0
0
$0
7
$186,333
0
$0
0
$0
Aggregated Statistics For Year 2008 (Based on 4 partial tracts)
A) FHA, FSA/RHS & VA Home Purchase Loans
B) Conventional Home Purchase Loans
C) Refinancings
D) Home Improvement Loans
F) Non-occupant Loans on < 5 Family Dwellings (A B C & D)
G) Loans On Manufactured Home Dwelling (A B C & D)
Number
Average Value
Number
Average Value
Number
Average Value
Number
Average Value
Number
Average Value
Number
Average Value
LOANS ORIGINATED
7
$149,820
53
$130,877
73
$124,489
10
$30,863
10
$71,189
2
$89,065
APPLICATIONS APPROVED, NOT ACCEPTED
2
$81,015
2
$156,115
17
$133,989
3
$15,310
1
$57,500
0
$0
APPLICATIONS DENIED
3
$69,290
5
$75,828
79
$148,574
21
$55,286
3
$41,337
1
$47,350
APPLICATIONS WITHDRAWN
2
$93,150
2
$243,520
22
$143,298
3
$93,947
3
$110,487
0
$0
FILES CLOSED FOR INCOMPLETENESS
0
$0
0
$0
2
$78,920
0
$0
0
$0
0
$0
Aggregated Statistics For Year 2007 (Based on 4 partial tracts)
A) FHA, FSA/RHS & VA Home Purchase Loans
B) Conventional Home Purchase Loans
C) Refinancings
D) Home Improvement Loans
F) Non-occupant Loans on < 5 Family Dwellings (A B C & D)
G) Loans On Manufactured Home Dwelling (A B C & D)
Number
Average Value
Number
Average Value
Number
Average Value
Number
Average Value
Number
Average Value
Number
Average Value
LOANS ORIGINATED
3
$92,997
59
$133,744
98
$117,129
37
$28,154
10
$65,166
2
$66,785
APPLICATIONS APPROVED, NOT ACCEPTED
0
$0
8
$107,116
32
$123,601
5
$13,264
2
$57,495
0
$0
APPLICATIONS DENIED
1
$102,430
12
$114,032
128
$152,758
20
$41,674
2
$134,725
2
$47,025
APPLICATIONS WITHDRAWN
0
$0
9
$150,122
42
$147,775
5
$69,654
0
$0
0
$0
FILES CLOSED FOR INCOMPLETENESS
1
$148,060
2
$114,995
10
$178,527
3
$156,333
1
$67,640
0
$0
Aggregated Statistics For Year 2006 (Based on 4 partial tracts)
A) FHA, FSA/RHS & VA Home Purchase Loans
B) Conventional Home Purchase Loans
C) Refinancings
D) Home Improvement Loans
F) Non-occupant Loans on < 5 Family Dwellings (A B C & D)
G) Loans On Manufactured Home Dwelling (A B C & D)
Number
Average Value
Number
Average Value
Number
Average Value
Number
Average Value
Number
Average Value
Number
Average Value
LOANS ORIGINATED
7
$98,413
87
$130,788
155
$107,345
34
$45,741
8
$101,176
2
$70,460
APPLICATIONS APPROVED, NOT ACCEPTED
0
$0
15
$123,907
45
$123,839
4
$24,470
5
$153,350
1
$108,230
APPLICATIONS DENIED
1
$108,020
17
$85,905
111
$98,485
40
$37,798
2
$27,935
2
$24,800
APPLICATIONS WITHDRAWN
1
$57,500
15
$184,755
67
$115,421
5
$104,730
2
$133,595
1
$163,470
FILES CLOSED FOR INCOMPLETENESS
0
$0
2
$133,625
17
$159,059
0
$0
0
$0
0
$0
Aggregated Statistics For Year 2005 (Based on 4 partial tracts)
A) FHA, FSA/RHS & VA Home Purchase Loans
B) Conventional Home Purchase Loans
C) Refinancings
D) Home Improvement Loans
F) Non-occupant Loans on < 5 Family Dwellings (A B C & D)
G) Loans On Manufactured Home Dwelling (A B C & D)
Number
Average Value
Number
Average Value
Number
Average Value
Number
Average Value
Number
Average Value
Number
Average Value
LOANS ORIGINATED
1
$109,360
96
$130,020
180
$140,438
21
$52,272
10
$96,592
1
$183,770
APPLICATIONS APPROVED, NOT ACCEPTED
0
$0
17
$157,235
54
$155,656
4
$35,582
3
$101,183
2
$135,850
APPLICATIONS DENIED
1
$170,240
17
$101,556
164
$134,597
29
$32,375
4
$150,398
5
$82,154
APPLICATIONS WITHDRAWN
0
$0
10
$136,710
74
$144,527
10
$104,180
0
$0
1
$129,650
FILES CLOSED FOR INCOMPLETENESS
0
$0
1
$39,460
9
$185,759
2
$67,645
0
$0
0
$0
Aggregated Statistics For Year 2004 (Based on 4 partial tracts)
A) FHA, FSA/RHS & VA Home Purchase Loans
B) Conventional Home Purchase Loans
C) Refinancings
D) Home Improvement Loans
F) Non-occupant Loans on < 5 Family Dwellings (A B C & D)
G) Loans On Manufactured Home Dwelling (A B C & D)
Number
Average Value
Number
Average Value
Number
Average Value
Number
Average Value
Number
Average Value
Number
Average Value
LOANS ORIGINATED
3
$126,797
101
$144,207
201
$124,519
15
$96,834
17
$93,673
0
$0
APPLICATIONS APPROVED, NOT ACCEPTED
0
$0
11
$184,782
50
$141,028
3
$64,433
2
$58,545
0
$0
APPLICATIONS DENIED
0
$0
25
$116,609
108
$118,021
24
$29,865
2
$56,935
5
$21,418
APPLICATIONS WITHDRAWN
0
$0
11
$134,721
58
$131,341
3
$125,287
3
$106,727
0
$0
FILES CLOSED FOR INCOMPLETENESS
1
$105,980
7
$100,031
27
$125,377
0
$0
2
$73,565
1
$165,730
Aggregated Statistics For Year 2003 (Based on 2 partial tracts)
A) FHA, FSA/RHS & VA Home Purchase Loans
B) Conventional Home Purchase Loans
C) Refinancings
D) Home Improvement Loans
E) Loans on Dwellings For 5+ Families
F) Non-occupant Loans on < 5 Family Dwellings (A B C & D)
Number
Average Value
Number
Average Value
Number
Average Value
Number
Average Value
Number
Average Value
Number
Average Value
LOANS ORIGINATED
2
$105,975
52
$141,207
198
$121,509
11
$23,675
1
$1,894,030
5
$68,772
APPLICATIONS APPROVED, NOT ACCEPTED
1
$51,860
7
$114,994
30
$102,330
2
$29,875
0
$0
6
$62,570
APPLICATIONS DENIED
1
$86,810
9
$56,120
76
$105,709
6
$10,335
0
$0
10
$60,767
APPLICATIONS WITHDRAWN
1
$177,000
11
$97,162
33
$133,785
0
$0
0
$0
3
$76,287
FILES CLOSED FOR INCOMPLETENESS
0
$0
0
$0
18
$136,917
0
$0
0
$0
0
$0
Aggregated Statistics For Year 2002 (Based on 2 partial tracts)
A) FHA, FSA/RHS & VA Home Purchase Loans
B) Conventional Home Purchase Loans
C) Refinancings
D) Home Improvement Loans
E) Loans on Dwellings For 5+ Families
F) Non-occupant Loans on < 5 Family Dwellings (A B C & D)
Number
Average Value
Number
Average Value
Number
Average Value
Number
Average Value
Number
Average Value
Number
Average Value
LOANS ORIGINATED
2
$146,000
51
$121,870
192
$109,980
16
$27,128
1
$1,888,400
6
$66,705
APPLICATIONS APPROVED, NOT ACCEPTED
0
$0
8
$62,289
28
$99,251
5
$14,882
0
$0
3
$59,000
APPLICATIONS DENIED
0
$0
16
$60,386
62
$89,956
8
$9,160
0
$0
3
$70,273
APPLICATIONS WITHDRAWN
0
$0
6
$90,943
54
$120,694
1
$11,270
0
$0
1
$40,590
FILES CLOSED FOR INCOMPLETENESS
0
$0
1
$84,550
7
$116,123
0
$0
0
$0
1
$68,770
Aggregated Statistics For Year 2001 (Based on 2 partial tracts)
B) Conventional Home Purchase Loans
C) Refinancings
D) Home Improvement Loans
E) Loans on Dwellings For 5+ Families
F) Non-occupant Loans on < 5 Family Dwellings (A B C & D)
Number
Average Value
Number
Average Value
Number
Average Value
Number
Average Value
Number
Average Value
LOANS ORIGINATED
48
$122,534
157
$114,442
10
$13,529
1
$171,360
8
$94,701
APPLICATIONS APPROVED, NOT ACCEPTED
5
$61,330
33
$88,211
2
$5,075
0
$0
2
$79,480
APPLICATIONS DENIED
7
$86,004
72
$93,465
10
$15,784
0
$0
6
$52,800
APPLICATIONS WITHDRAWN
10
$106,765
59
$89,370
1
$16,910
0
$0
2
$68,770
FILES CLOSED FOR INCOMPLETENESS
1
$63,130
17
$96,227
0
$0
0
$0
0
$0
Aggregated Statistics For Year 2000 (Based on 2 partial tracts)
A) FHA, FSA/RHS & VA Home Purchase Loans
B) Conventional Home Purchase Loans
C) Refinancings
D) Home Improvement Loans
F) Non-occupant Loans on < 5 Family Dwellings (A B C & D)
Number
Average Value
Number
Average Value
Number
Average Value
Number
Average Value
Number
Average Value
LOANS ORIGINATED
2
$146,560
44
$98,161
79
$85,739
10
$35,964
3
$121,760
APPLICATIONS APPROVED, NOT ACCEPTED
1
$89,060
2
$46,785
35
$92,865
6
$18,790
1
$40,590
APPLICATIONS DENIED
0
$0
8
$51,860
50
$71,658
15
$19,015
5
$48,478
APPLICATIONS WITHDRAWN
0
$0
9
$84,054
18
$74,033
0
$0
0
$0
FILES CLOSED FOR INCOMPLETENESS
1
$133,030
1
$134,160
9
$124,516
0
$0
1
$63,130
Aggregated Statistics For Year 1999 (Based on 1 partial tract)
A) FHA, FSA/RHS & VA Home Purchase Loans
B) Conventional Home Purchase Loans
C) Refinancings
D) Home Improvement Loans
F) Non-occupant Loans on < 5 Family Dwellings (A B C & D)
Detailed PMIC statistics for the following Tracts:0097.00
, 0511.00
2002 - 2018 National Fire Incident Reporting System (NFIRS) incidents
Based on the data from the years 2002 - 2018 the average number of fire incidents per year is 25. The highest number of reported fires - 47 took place in 2012, and the least - 5 in 2002. The data has a growing trend.
When looking into fire subcategories, the most incidents belonged to: Outside Fires (49.4%), and Structure Fires (33.4%).
Fire incident types reported to NFIRS in Zip Code 43412


 Nearest zip codes: 43468, 43445, 43408, 43432, 43616, 43430.


 Based on the data from the years 2002 - 2018 the average number of fire incidents per year is 25. The highest number of reported fires - 47 took place in 2012, and the least - 5 in 2002. The data has a growing trend.
 When looking into fire subcategories, the most incidents belonged to: Outside Fires (49.4%), and Structure Fires (33.4%).