Estimated zip code population in 2022: 1,082 Zip code population in 2010: 1,532 Zip code population in 2000: 1,612
Houses and condos: 442 Renter-occupied apartments: 68
% of renters here:
16%
State:
33%
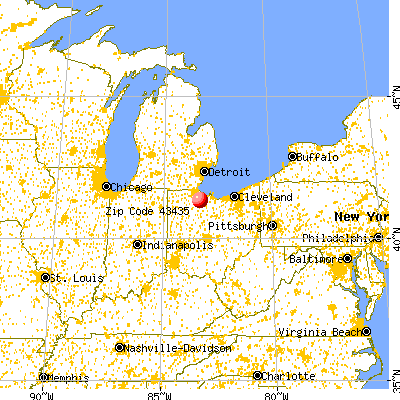
March 2022 cost of living index in zip code 43435: 82.6 (low, U.S. average is 100)
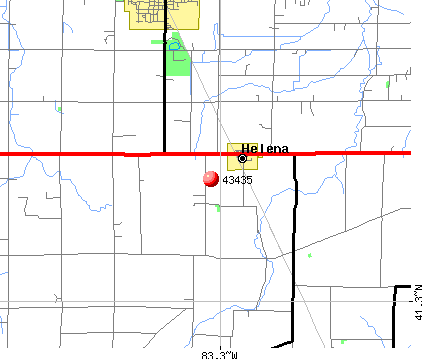
Land area: 35.9 sq. mi. Water area: 0.0 sq. mi.
Population density: 30 people per square mile
(very low).
OSM Map
General Map
Google Map
MSN Map
OSM Map
General Map
Google Map
MSN Map
OSM Map
General Map
Google Map
MSN Map
OSM Map
General Map
Google Map
MSN Map
Please wait while loading the map...
Real estate property taxes paid for housing units in 2022:
This zip code:
1.0% ($1,824)
Ohio:
1.3% ($2,639)
Median real estate property taxes paid for housing units with mortgages in 2022: $1,835 (0.9%) Median real estate property taxes paid for housing units with no mortgage in 2022: $1,732 (1.5%)
Estimated median house/condo value in 2022: $184,169
43435:
$184,169
Ohio:
$204,100
According to our research of Ohio and other state lists, there were 3 registered sex offenders living in 43435 zip code as of May 28, 2024. The ratio of all residents to sex offenders in zip code 43435 is 534 to 1. The ratio of registered sex offenders to all residents in this zip code is near the state average.
Median resident age:
This zip code:
40.9 years
Ohio median age:
39.9 years
Average household size:
This zip code:
2.6 people
Ohio:
2.4 people
Averages for the 2020 tax year for zip code 43435, filed in 2021:
Average Adjusted Gross Income (AGI) in 2020: $55,576 (Individual Income Tax Returns)
Here:
$55,576
State:
$67,288
Salary/wage: $49,749 (reported on 78.6% of returns)
Here:
$49,749
State:
$55,628
(% of AGI for various income ranges: 1095.0% for AGIs below $25k, 3847.5% for AGIs $25k-50k, 5856.0% for AGIs $50k-75k, 8435.7% for AGIs $75k-100k, 15751.7% for AGIs $100k-200k)
Taxable interest for individuals: $453 (reported on 27.1% of returns)
This zip code:
$453
Ohio:
$1,518
(% of AGI for various income ranges: 7.1% for AGIs below $25k, 20.0% for AGIs $25k-50k, 28.0% for AGIs $50k-75k, 11.4% for AGIs $75k-100k, 26.7% for AGIs $100k-200k)
Ordinary dividends: $1,807 (reported on 21.4% of returns)
Here:
$1,807
State:
$7,167
(% of AGI for various income ranges: 65.0% for AGIs $25k-50k, 96.0% for AGIs $50k-75k, 50.0% for AGIs $75k-100k, 103.3% for AGIs $100k-200k)
Net capital gain/loss in AGI: +$2,215 (reported on 18.6% of returns)
Here:
+$2,215
State:
+$18,919
(% of AGI for various income ranges: 47.5% for AGIs $25k-50k, 117.0% for AGIs $50k-75k, 72.9% for AGIs $75k-100k, 105.0% for AGIs $100k-200k)
Profit/loss from business: +$3,788 (reported on 11.4% of returns)
Here:
+$3,788
State:
+$13,744
(% of AGI for various income ranges: 49.3% for AGIs below $25k, 217.5% for AGIs $25k-50k)
Taxable individual retirement arrangement distribution: $14,475 (reported on 11.4% of returns)
43435:
$14,475
Ohio:
$18,876
(% of AGI for various income ranges: 452.5% for AGIs $25k-50k, 878.6% for AGIs $75k-100k)
Earned income credit: $1,829 (reported on 10.0% of returns)
Here:
$1,829
State:
$2,304
(% of AGI for various income ranges: 47.9% for AGIs below $25k, 50.8% for AGIs $25k-50k)
Percentage of individuals using paid preparers for their 2020 taxes: 95.7%
Here:
96%
State:
94%
(% for various income ranges: 90.5% for AGIs below $25k, 94.1% for AGIs $25k-50k, 100.0% for AGIs $50k-75k, 100.0% for AGIs $75k-100k, 100.0% for AGIs $100k-200k)
Averages for the 2012 tax year for zip code 43435, filed in 2013:
Average Adjusted Gross Income (AGI) in 2012: $42,275 (Individual Income Tax Returns)
Here:
$42,275
State:
$54,926
Salary/wage: $37,542 (reported on 85.3% of returns)
Here:
$37,542
State:
$45,869
(% of AGI for various income ranges: 71.1% for AGIs below $25k, 81.4% for AGIs $25k-50k, 76.0% for AGIs $50k-75k, 75.7% for AGIs $75k-100k, 70.6% for AGIs $100k-200k)
Taxable interest for individuals: $587 (reported on 30.7% of returns)
This zip code:
$587
Ohio:
$1,297
(% of AGI for various income ranges: 1.2% for AGIs below $25k, 0.4% for AGIs $25k-50k, 0.3% for AGIs $50k-75k, 0.3% for AGIs $75k-100k, 0.2% for AGIs $100k-200k)
Ordinary dividends: $1,560 (reported on 20.0% of returns)
Here:
$1,560
State:
$5,821
(% of AGI for various income ranges: 1.0% for AGIs below $25k, 1.1% for AGIs $25k-50k, 0.9% for AGIs $50k-75k, 0.7% for AGIs $75k-100k)
Net capital gain/loss in AGI: +$660 (reported on 13.3% of returns)
Here:
+$660
State:
+$11,232
(% of AGI for various income ranges: 1.1% for AGIs $75k-100k)
Profit/loss from business: +$6,770 (reported on 13.3% of returns)
Here:
+$6,770
State:
+$12,773
(% of AGI for various income ranges: 5.7% for AGIs below $25k, 3.6% for AGIs $25k-50k, 2.5% for AGIs $50k-75k)
Taxable individual retirement arrangement distribution: $7,000 (reported on 10.7% of returns)
43435:
$7,000
Ohio:
$14,511
(% of AGI for various income ranges: 2.0% for AGIs below $25k, 2.0% for AGIs $25k-50k, 4.1% for AGIs $50k-75k)
Total itemized deductions: $15,912 (24% of AGI, reported on 22.7% of returns)
Here:
$15,912
State:
$21,278
Here:
24.0% of AGI
State:
18.8% of AGI
(% of AGI for various income ranges: 9.1% for AGIs $25k-50k, 9.6% for AGIs $50k-75k, 7.8% for AGIs $75k-100k, 11.9% for AGIs $100k-200k)
Charity contributions: $3,110 (reported on 13.3% of returns)
Here:
$3,110
State:
$3,943
(% of AGI for various income ranges: 1.0% for AGIs $25k-50k, 1.9% for AGIs $50k-75k, 1.3% for AGIs $100k-200k)
Taxes paid: $5,000 (reported on 22.7% of returns)
43435:
$5,000
State:
$9,568
(% of AGI for various income ranges: 2.0% for AGIs $25k-50k, 2.7% for AGIs $50k-75k, 2.6% for AGIs $75k-100k, 5.1% for AGIs $100k-200k)
Earned income credit: $2,000 (reported on 16.0% of returns)
Here:
$2,000
State:
$2,285
(% of AGI for various income ranges: 5.7% for AGIs below $25k, 0.6% for AGIs $25k-50k)
Percentage of individuals using paid preparers for their 2012 taxes: 68.0%
Here:
68%
State:
51%
(% for various income ranges: 57.1% for AGIs below $25k, 68.2% for AGIs $25k-50k, 76.9% for AGIs $50k-75k, 85.7% for AGIs $75k-100k, 80.0% for AGIs $100k-200k)
Averages for the 2004 tax year for zip code 43435, filed in 2005:
Average Adjusted Gross Income (AGI) in 2004: $36,854 (Individual Income Tax Returns)
Here:
$36,854
State:
$44,480
Salary/wage: $34,118 (reported on 89.0% of returns)
Here:
$34,118
State:
$39,198
(% of AGI for various income ranges: 81.8% for AGIs below $10k, 73.4% for AGIs $10k-25k, 88.0% for AGIs $25k-50k, 82.6% for AGIs $50k-75k, 90.3% for AGIs $75k-100k, 60.7% for AGIs over 100k)
Taxable interest for individuals: $721 (reported on 43.9% of returns)
This zip code:
$721
Ohio:
$1,532
(% of AGI for various income ranges: 3.5% for AGIs below $10k, 2.3% for AGIs $10k-25k, 0.7% for AGIs $25k-50k, 0.7% for AGIs $50k-75k, 0.2% for AGIs $75k-100k, 0.6% for AGIs over 100k)
Taxable dividends: $1,561 (reported on 20.9% of returns)
Here:
$1,561
State:
$3,496
(% of AGI for various income ranges: 0.7% for AGIs below $10k, 0.7% for AGIs $10k-25k, 0.7% for AGIs $25k-50k, 0.7% for AGIs $50k-75k, 0.2% for AGIs $75k-100k, 3.6% for AGIs over 100k)
Net capital gain/loss: +$3,204 (reported on 12.5% of returns)
Here:
+$3,204
State:
+$8,582
(% of AGI for various income ranges: 2.1% for AGIs below $10k, 0.5% for AGIs $25k-50k, 1.9% for AGIs $50k-75k, 2.1% for AGIs $75k-100k)
Profit/loss from business: +$6,212 (reported on 10.9% of returns)
Here:
+$6,212
State:
+$10,813
(% of AGI for various income ranges: 4.1% for AGIs $10k-25k, 1.8% for AGIs $25k-50k, 1.8% for AGIs $50k-75k, 1.8% for AGIs $75k-100k)
IRA payment deduction: $3,120 (reported on 3.2% of returns)
43435:
$3,120
Ohio:
$2,794
Total itemized deductions: $12,929 (22% of AGI, reported on 27.1% of returns)
Here:
$12,929
State:
$17,503
Here:
22.4% of AGI
State:
20.8% of AGI
(% of AGI for various income ranges: 8.0% for AGIs $10k-25k, 7.8% for AGIs $25k-50k, 8.3% for AGIs $50k-75k, 13.6% for AGIs $75k-100k, 15.2% for AGIs over 100k)
Charity contributions deductions: $2,214 (4% of AGI, reported on 19.7% of returns)
Here:
$2,214
State:
$3,087
Here:
3.7% of AGI
State:
3.4% of AGI
(% of AGI for various income ranges: 0.9% for AGIs $10k-25k, 0.8% for AGIs $25k-50k, 1.1% for AGIs $50k-75k, 1.6% for AGIs $75k-100k, 2.6% for AGIs over 100k)
Total tax: $3,997 (reported on 78.7% of returns)
43435:
$3,997
State:
$6,781
(% of AGI for various income ranges: 3.4% for AGIs below $10k, 4.8% for AGIs $10k-25k, 7.0% for AGIs $25k-50k, 9.2% for AGIs $50k-75k, 9.7% for AGIs $75k-100k, 14.9% for AGIs over 100k)
Earned income credit: $1,230 (reported on 11.1% of returns)
Here:
$1,230
State:
$1,696
Percentage of individuals using paid preparers for their 2004 taxes: 64.1%
Here:
64%
State:
55%
(% for various income ranges: 37.9% for AGIs below $10k, 62.8% for AGIs $10k-25k, 72.3% for AGIs $25k-50k, 70.2% for AGIs $50k-75k, 73.7% for AGIs $75k-100k, 75.0% for AGIs over 100k)
Household received Food Stamps/SNAP in the past 12 months: 38 Household did not receive Food Stamps/SNAP in the past 12 months: 377
Women who had a birth in the past 12 months: 6 (7 now married, 0 unmarried) Women who did not have a birth in the past 12 months: 262 (164 now married, 97 unmarried)
Housing units in zip code 43435 with a mortgage: 262 (28 second mortgage, 20 both second mortgage and home equity loan) Houses without a mortgage: 19
Median monthly owner costs for units with a mortgage: $1,107 Median monthly owner costs for units without a mortgage: $515
Residents with income below the poverty level in 2022:
This zip code:
7.8%
Whole state:
13.4%
Residents with income below 50% of the poverty level in 2022:
This zip code:
5.1%
Whole state:
7.0%
Median number of rooms in houses and condos:
Here:
7.2
State:
6.7
Median number of rooms in apartments:
Here:
5.8
State:
4.4
Notable locations in this zip code not listed on our city pages
Churches in zip code 43435 include: Trinity Church (A), Shiloh United Methodist Church (B), Saint Marys Catholic Church (C). Display/hide their locations on the map
Cemeteries: Trinity Cemetery (1), Washington Chapel Cemetery (2), Metzgar Cemetery (3), Pember Farm Cemetery (4), Saint Marys Cemetery (5). Display/hide their locations on the map
In group quarters: 15 (-1 institutionalized population)
Size of family households: 53 2-persons, 128 3-persons, 58 4-persons, 7 5-persons, 4 6-persons, 11 7-or-more-persons
Size of nonfamily households: 95 1-person, 54 2-persons
192 married couples with children.
17 single-parent households (14 men, 3 women).
98.7% of residents of 43435 zip code speak English at home.
0.5% of residents speak Spanish at home (60% very well, 40% well).
0.4% of residents speak other Indo-European language at home (100% well).
Foreign born population: 11 (1.0%) (18.5% of them are naturalized citizens)
This zip code:
1.0%
Whole state:
5.0%
18%Honduras
48%German
19%American
12%Irish
2%French
1%Scottish
1%Swiss
0%English
Year of entry for the foreign-born population
22010 or later
12000 to 2009
111990 to 1999
0Before 1990
Facilities with environmental interests located in this zip code:
CARMEUSE LIME INC MILLERSVILLE OPERATIONS (3964 COUNTY ROAD 41 in MILLERSVILLE, OH)
AIR MAJOR (AIRS/AFS) COMPLIANCE ACTIVITY (Tracking inspections of insecticide, fungicide, and rodenticide, and toxic substances) CRITERIA AND HAZARDOUS AIR POLLUTANT INVENTORY (Inventory of air pollution sources) STATE MASTER (Ohio general info) - PCS-OH0030031, National Pollutant Discharge Elimination System Permit, AIR MAJOR, -72-3274-1042-A, EPCRA, SDWIS-7235812, DRINKING WATER PROGRAM National Pollutant Discharge Elimination System NON-MAJOR (Tracking pollutant discharge elimination systems) - permit Conditionally Exempt Small Quantity Generators, less than 100 kg/month of hazardous waste (Resource Conservation and Recovery Act (tracking hazardous waste)) - notification TSD (Resource Conservation and Recovery Act (tracking hazardous waste)) TRI REPORTER (Tracking of toxic chemicals releasing facilities) Business SIC classification: LIME Organizations: REDLAND QUARRIES (CONTACT/OWNER)
, REDLAND QUARRIES INC (CONTACT/OWNER)
, CARMEUSE LIME, INC. (CONTACT/OWNER)
, CARMEUSE LIME - MILLERSVILLE O (CONTACT/OWNER)
Alternative names: CARMEUSE LIME MILLERSVILLE, LAFARGE LIME OF OHIO INCORPORATED, MILLERSVILLE LIME INC., MILLERSVILLE LIME - MILLERSVILLE, OHIO LIME CO MILLERSVILLE PLT, REDLAND OHIO, REDLAND QUARRIES, STEETLEY QUARRY PRODUCTS U.S. INC-MILLER
Housing units lacking complete plumbing facilities: 4.3% Housing units lacking complete kitchen facilities: 0.2%
48.7%Bottled, tank, or LP gas
25.8%Wood
19.4%Utility gas
6.6%Electricity
Population in 1990: 1,427. Population change in the 1990s: +185 (+13.0%).
Place of birth for U.S.-born residents:
This state: 926
Northeast: 15
Midwest: 62
South: 32
West: 28
77% of the 43435 zip code residents lived in the same house 5 years ago. Out of people who lived in different houses, 52% lived in this county. Out of people who lived in different counties, 50% lived in Ohio.
95% of the 43435 zip code residents lived in the same house 1 year ago. Out of people who lived in different houses, 5% moved from this county. Out of people who lived in different houses, 84% moved from different county within same state. Out of people who lived in different houses, 21% moved from different state.
Private vs. public school enrollment:
Students in private schools in grades 1 to 8 (elementary and middle school): 4
Here:
2.8%
Ohio:
16.0%
Students in private schools in grades 9 to 12 (high school): 13
Here:
23.0%
Ohio:
13.1%
Students in private undergraduate colleges: 1
Here:
3.7%
Ohio:
22.3%
Occupation by median earnings in the past 12 months ($)
99,595Management occupations
79,542Construction and extraction occupations
59,030Installation, maintenance, and repair occupations
57,737Community and social service occupations
51,280Production occupations
43,954Sales and related occupations
Top industries in this zip code by the number of employees in 2005:
Other Services (except Public Administration): Religious Organizations (10-19 employees: 1 establishment, 1-4 employees: 1 establishment)
Other Services (except Public Administration): Automotive Body, Paint, and Interior Repair and Maintenance (10-19: 1)
Construction: New Single-Family Housing Construction (except Operative Builders) (5-9: 2)
Other Services (except Public Administration): Commercial and Industrial Machinery and Equipment (except Automotive and Electronic) Repair and Maintenance (5-9: 1, 1-4: 1)
Health Care and Social Assistance: Residential Mental Retardation Facilities (5-9: 1)
Construction: Residential Remodelers (1-4: 2)
Health Care and Social Assistance: Child Day Care Services (1-4: 1)
People in group quarters in 2000:
4 people in homes for the mentally retarded
Fatal accident statistics in 2012:
Fatal accident count: 2
Vehicles involved in fatal accidents: 3
Fatal accidents caused by drunken drivers: 1
Fatalities: 2
Persons involved in fatal accidents: 4
Pedestrians involved in fatal accidents: 0
Fatal accident statistics in 2010:
Fatal accident count: 1
Vehicles involved in fatal accidents: 1
Fatal accidents caused by drunken drivers: 0
Fatalities: 1
Persons involved in fatal accidents: 1
Pedestrians involved in fatal accidents: 0
2002 - 2018 National Fire Incident Reporting System (NFIRS) incidents
According to the data from the years 2002 - 2018 the average number of fire incidents per year is 18. The highest number of fire incidents - 31 took place in 2005, and the least - 5 in 2011. The data has an increasing trend.
When looking into fire subcategories, the most incidents belonged to: Structure Fires (45.5%), and Outside Fires (44.1%).
Fire incident types reported to NFIRS in Zip Code 43435


 Nearest zip codes: 43431, 44841, 43407, 44815, 43406, 43457.


 According to the data from the years 2002 - 2018 the average number of fire incidents per year is 18. The highest number of fire incidents - 31 took place in 2005, and the least - 5 in 2011. The data has an increasing trend.
 When looking into fire subcategories, the most incidents belonged to: Structure Fires (45.5%), and Outside Fires (44.1%).