Estimated zip code population in 2022: 1,123 Zip code population in 2010: 1,119 Zip code population in 2000: 1,114
Houses and condos: 511 Renter-occupied apartments: 189
% of renters here:
41%
State:
33%
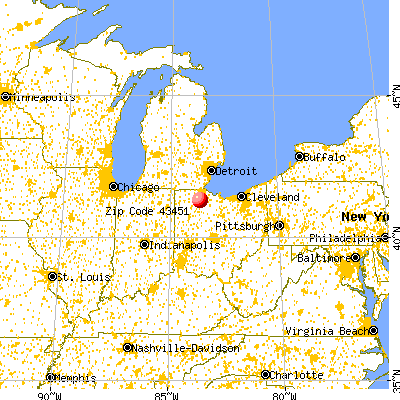
March 2022 cost of living index in zip code 43451: 83.1 (low, U.S. average is 100)
Land area: 24.5 sq. mi. Water area: 0.1 sq. mi.
Population density: 46 people per square mile
(very low).
OSM Map
General Map
Google Map
MSN Map
OSM Map
General Map
Google Map
MSN Map
OSM Map
General Map
Google Map
MSN Map
OSM Map
General Map
Google Map
MSN Map
Please wait while loading the map...
Real estate property taxes paid for housing units in 2022:
This zip code:
1.4% ($2,673)
Ohio:
1.3% ($2,639)
Median real estate property taxes paid for housing units with mortgages in 2022: $2,855 (1.1%) Median real estate property taxes paid for housing units with no mortgage in 2022: $2,437 (1.5%)
Averages for the 2020 tax year for zip code 43451, filed in 2021:
Average Adjusted Gross Income (AGI) in 2020: $57,895 (Individual Income Tax Returns)
Here:
$57,895
State:
$67,288
Salary/wage: $49,591 (reported on 81.8% of returns)
Here:
$49,591
State:
$55,628
(% of AGI for various income ranges: 1195.5% for AGIs below $25k, 3751.4% for AGIs $25k-50k, 6520.0% for AGIs $50k-75k, 11103.3% for AGIs $75k-100k, 17012.0% for AGIs $100k-200k)
Taxable interest for individuals: $427 (reported on 20.0% of returns)
This zip code:
$427
Ohio:
$1,518
(% of AGI for various income ranges: 11.8% for AGIs below $25k, 26.7% for AGIs $50k-75k, 36.0% for AGIs $100k-200k)
Ordinary dividends: $2,367 (reported on 16.4% of returns)
Here:
$2,367
State:
$7,167
(% of AGI for various income ranges: 23.6% for AGIs below $25k, 73.3% for AGIs $50k-75k, 286.0% for AGIs $100k-200k)
Net capital gain/loss in AGI: +$2,388 (reported on 14.5% of returns)
Here:
+$2,388
State:
+$18,919
(% of AGI for various income ranges: 0.9% for AGIs below $25k, 61.7% for AGIs $50k-75k, 306.0% for AGIs $100k-200k)
Profit/loss from business: +$10,662 (reported on 14.5% of returns)
Here:
+$10,662
State:
+$13,744
(% of AGI for various income ranges: 168.6% for AGIs $25k-50k, 2056.7% for AGIs $75k-100k)
Taxable individual retirement arrangement distribution: $9,360 (reported on 9.1% of returns)
43451:
$9,360
Ohio:
$18,876
(% of AGI for various income ranges: 171.8% for AGIs below $25k, 465.0% for AGIs $50k-75k)
Earned income credit: $1,929 (reported on 12.7% of returns)
Here:
$1,929
State:
$2,304
(% of AGI for various income ranges: 62.7% for AGIs below $25k, 47.1% for AGIs $25k-50k)
Percentage of individuals using paid preparers for their 2020 taxes: 96.4%
Here:
96%
State:
94%
(% for various income ranges: 93.3% for AGIs below $25k, 94.1% for AGIs $25k-50k, 100.0% for AGIs $50k-75k, 100.0% for AGIs $75k-100k, 100.0% for AGIs $100k-200k)
Averages for the 2012 tax year for zip code 43451, filed in 2013:
Average Adjusted Gross Income (AGI) in 2012: $45,389 (Individual Income Tax Returns)
Here:
$45,389
State:
$54,926
Salary/wage: $35,949 (reported on 83.6% of returns)
Here:
$35,949
State:
$45,869
(% of AGI for various income ranges: 75.9% for AGIs below $25k, 80.1% for AGIs $25k-50k, 68.9% for AGIs $50k-75k, 69.3% for AGIs $75k-100k, 49.8% for AGIs $100k-200k)
Taxable interest for individuals: $456 (reported on 29.5% of returns)
This zip code:
$456
Ohio:
$1,297
(% of AGI for various income ranges: 0.4% for AGIs below $25k, 0.3% for AGIs $25k-50k, 0.3% for AGIs $50k-75k, 0.5% for AGIs $75k-100k, 0.2% for AGIs $100k-200k)
Ordinary dividends: $1,030 (reported on 16.4% of returns)
Here:
$1,030
State:
$5,821
(% of AGI for various income ranges: 0.6% for AGIs below $25k, 0.7% for AGIs $25k-50k, 1.0% for AGIs $75k-100k)
Net capital gain/loss in AGI: +$1,520 (reported on 8.2% of returns)
Here:
+$1,520
State:
+$11,232
(% of AGI for various income ranges: 1.6% for AGIs $50k-75k)
Profit/loss from business: +$4,925 (reported on 13.1% of returns)
Here:
+$4,925
State:
+$12,773
(% of AGI for various income ranges: 3.9% for AGIs below $25k, 1.3% for AGIs $25k-50k, 3.7% for AGIs $50k-75k)
Taxable individual retirement arrangement distribution: $12,380 (reported on 8.2% of returns)
43451:
$12,380
Ohio:
$14,511
(% of AGI for various income ranges: 7.5% for AGIs below $25k, 7.5% for AGIs $50k-75k)
Total itemized deductions: $17,608 (21% of AGI, reported on 21.3% of returns)
Here:
$17,608
State:
$21,278
Here:
20.5% of AGI
State:
18.8% of AGI
(% of AGI for various income ranges: 9.2% for AGIs $25k-50k, 4.8% for AGIs $50k-75k, 10.3% for AGIs $75k-100k, 11.4% for AGIs $100k-200k)
Charity contributions: $3,550 (reported on 16.4% of returns)
Here:
$3,550
State:
$3,943
(% of AGI for various income ranges: 1.2% for AGIs $25k-50k, 1.0% for AGIs $75k-100k, 2.6% for AGIs $100k-200k)
Taxes paid: $6,700 (reported on 21.3% of returns)
43451:
$6,700
State:
$9,568
(% of AGI for various income ranges: 2.0% for AGIs $25k-50k, 1.9% for AGIs $50k-75k, 3.9% for AGIs $75k-100k, 5.4% for AGIs $100k-200k)
Earned income credit: $1,760 (reported on 16.4% of returns)
Here:
$1,760
State:
$2,285
(% of AGI for various income ranges: 5.0% for AGIs below $25k, 0.7% for AGIs $25k-50k)
Percentage of individuals using paid preparers for their 2012 taxes: 52.5%
Here:
52%
State:
51%
(% for various income ranges: 43.5% for AGIs below $25k, 50.0% for AGIs $25k-50k, 66.7% for AGIs $50k-75k, 60.0% for AGIs $75k-100k, 66.7% for AGIs $100k-200k)
Averages for the 2004 tax year for zip code 43451, filed in 2005:
Average Adjusted Gross Income (AGI) in 2004: $39,205 (Individual Income Tax Returns)
Here:
$39,205
State:
$44,480
Salary/wage: $34,828 (reported on 87.2% of returns)
Here:
$34,828
State:
$39,198
(% of AGI for various income ranges: 111.1% for AGIs below $10k, 79.0% for AGIs $10k-25k, 79.2% for AGIs $25k-50k, 82.1% for AGIs $50k-75k, 79.2% for AGIs $75k-100k, 57.5% for AGIs over 100k)
Taxable interest for individuals: $622 (reported on 42.5% of returns)
This zip code:
$622
Ohio:
$1,532
(% of AGI for various income ranges: 1.1% for AGIs below $10k, 1.9% for AGIs $10k-25k, 1.0% for AGIs $25k-50k, 0.3% for AGIs $50k-75k, 0.6% for AGIs $75k-100k, 0.3% for AGIs over 100k)
Taxable dividends: $866 (reported on 22.9% of returns)
Here:
$866
State:
$3,496
(% of AGI for various income ranges: 2.2% for AGIs below $10k, 0.4% for AGIs $10k-25k, 0.8% for AGIs $25k-50k, 0.4% for AGIs $50k-75k, 0.6% for AGIs $75k-100k)
Net capital gain/loss: +$4,250 (reported on 13.7% of returns)
Here:
+$4,250
State:
+$8,582
(% of AGI for various income ranges: -0.1% for AGIs $10k-25k, 0.2% for AGIs $25k-50k, 0.3% for AGIs $50k-75k, 8.2% for AGIs $75k-100k)
Profit/loss from business: +$3,333 (reported on 13.8% of returns)
Here:
+$3,333
State:
+$10,813
(% of AGI for various income ranges: -5.4% for AGIs below $10k, 1.5% for AGIs $10k-25k, 2.1% for AGIs $25k-50k, 1.8% for AGIs $50k-75k, 0.1% for AGIs $75k-100k)
Profit/loss from farming: +$2,762 (reported on 3.6% of returns)
Here:
+$2,762
State:
-$3,706
Total itemized deductions: $14,796 (22% of AGI, reported on 30.9% of returns)
Here:
$14,796
State:
$17,503
Here:
22.2% of AGI
State:
20.8% of AGI
(% of AGI for various income ranges: 11.2% for AGIs $10k-25k, 8.7% for AGIs $25k-50k, 13.4% for AGIs $50k-75k, 14.3% for AGIs $75k-100k, 11.8% for AGIs over 100k)
Charity contributions deductions: $1,954 (3% of AGI, reported on 25.9% of returns)
Here:
$1,954
State:
$3,087
Here:
2.9% of AGI
State:
3.4% of AGI
(% of AGI for various income ranges: 1.6% for AGIs $10k-25k, 0.9% for AGIs $25k-50k, 1.3% for AGIs $50k-75k, 2.0% for AGIs $75k-100k, 1.2% for AGIs over 100k)
Total tax: $4,495 (reported on 79.7% of returns)
43451:
$4,495
State:
$6,781
(% of AGI for various income ranges: 2.7% for AGIs below $10k, 4.8% for AGIs $10k-25k, 7.6% for AGIs $25k-50k, 8.6% for AGIs $50k-75k, 9.9% for AGIs $75k-100k, 15.6% for AGIs over 100k)
Earned income credit: $1,086 (reported on 11.9% of returns)
Here:
$1,086
State:
$1,696
Percentage of individuals using paid preparers for their 2004 taxes: 53.9%
Here:
54%
State:
55%
(% for various income ranges: 40.0% for AGIs below $10k, 51.2% for AGIs $10k-25k, 57.9% for AGIs $25k-50k, 61.5% for AGIs $50k-75k, 54.5% for AGIs $75k-100k, 71.4% for AGIs over 100k)
Household received Food Stamps/SNAP in the past 12 months: 10 Household did not receive Food Stamps/SNAP in the past 12 months: 453
Women who had a birth in the past 12 months: 15 (7 now married, 8 unmarried) Women who did not have a birth in the past 12 months: 185 (143 now married, 41 unmarried)
Housing units in zip code 43451 with a mortgage: 143 (15 second mortgage, 15 both second mortgage and home equity loan) Houses without a mortgage: 3
Median monthly owner costs for units with a mortgage: $1,457 Median monthly owner costs for units without a mortgage: $806
Residents with income below the poverty level in 2022:
This zip code:
6.7%
Whole state:
13.4%
Residents with income below 50% of the poverty level in 2022:
This zip code:
0.9%
Whole state:
7.0%
Median number of rooms in houses and condos:
Here:
7.6
State:
6.7
Median number of rooms in apartments:
Here:
5.6
State:
4.4
Notable locations in this zip code not listed on our city pages
In group quarters: 31 (-1 institutionalized population)
Size of family households: 168 2-persons, 64 3-persons, 24 4-persons, 62 5-persons, 3 7-or-more-persons
Size of nonfamily households: 100 1-person, 40 2-persons
56 married couples with children.
17 single-parent households (13 men, 4 women).
95.0% of residents of 43451 zip code speak English at home.
4.1% of residents speak Spanish at home (52% very well, 30% well, 18% not well).
0.8% of residents speak other Indo-European language at home (100% very well).
Foreign born population: 33 (3.0%) (15.4% of them are naturalized citizens)
This zip code:
3.0%
Whole state:
5.0%
91%Honduras
6%United Kingdom, excluding England and Scotland
6%Serbia
3%Sweden
26%German
11%African
9%Irish
7%English
6%American
6%Polish
1%Scottish
Year of entry for the foreign-born population
172010 or later
22000 to 2009
01990 to 1999
13Before 1990
Facilities with environmental interests located in this zip code:
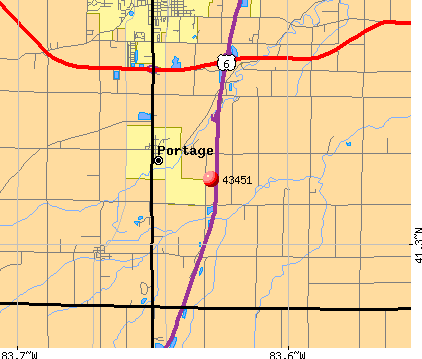
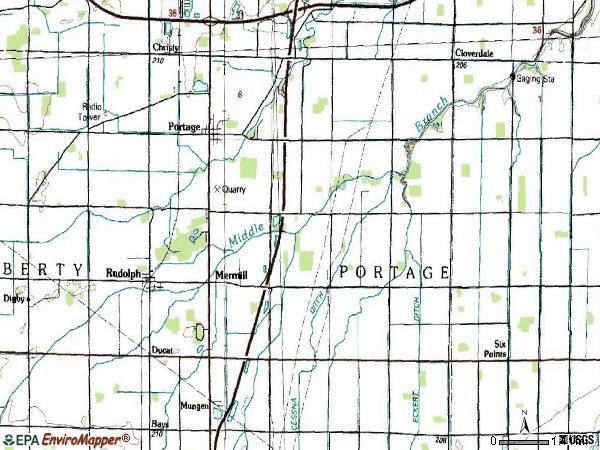
AMOCO FERTILIZER PLANT (KRAMER & MITCHEL RD in PORTAGE, OH)
STATE MASTER (Ohio general info) - RCRA-OHD000721944, HAZARDOUS WASTE PROGRAM (Resource Conservation and Recovery Act (tracking hazardous waste))
Housing units lacking complete plumbing facilities: 4.5%
37.7%Bottled, tank, or LP gas
35.9%Utility gas
25.0%Electricity
1.5%Fuel oil, kerosene, etc.
Population in 1990: 1,304.
Place of birth for U.S.-born residents:
This state: 980
Northeast: 28
Midwest: 57
South: 20
West: 2
76% of the 43451 zip code residents lived in the same house 5 years ago. Out of people who lived in different houses, 79% lived in this county. Out of people who lived in different counties, 50% lived in Ohio.
88% of the 43451 zip code residents lived in the same house 1 year ago. Out of people who lived in different houses, 43% moved from this county. Out of people who lived in different houses, 7% moved from different county within same state. Out of people who lived in different houses, 48% moved from different state.
Private vs. public school enrollment:
Students in private schools in grades 1 to 8 (elementary and middle school): 40
Here:
49.1%
Ohio:
16.0%
Students in private schools in grades 9 to 12 (high school): 4
Here:
25.7%
Ohio:
13.1%
Students in private undergraduate colleges:
Here:
0.0%
Ohio:
22.3%
Occupation by median earnings in the past 12 months ($)
126,008Life, physical, and social science occupations
64,644Construction and extraction occupations
60,387Management occupations
56,408Business and financial operations occupations
53,810Transportation occupations
39,230Office and administrative support occupations
Top industries in this zip code by the number of employees in 2005:
Administrative and Support and Waste Management and Remediation Services: Solid Waste Collection (10-19 employees: 1 establishment)
Other Services (except Public Administration): General Automotive Repair (5-9: 1, 1-4: 1)
Other Services (except Public Administration): Religious Organizations (5-9: 1, 1-4: 1)
Mining: Crushed and Broken Limestone Mining and Quarrying (5-9: 1)
Construction: All Other Specialty Trade Contractors (5-9: 1)
Health Care and Social Assistance: Services for the Elderly and Persons with Disabilities (5-9: 1)
Administrative and Support and Waste Management and Remediation Services: Landscaping Services (1-4: 2)
People in group quarters in 2010:
28 people in group homes intended for adults
People in group quarters in 2000:
26 people in homes for the mentally retarded
2 people in agriculture workers' dormitories on farms
Fatal accident statistics in 2010:
Fatal accident count: 1
Vehicles involved in fatal accidents: 2
Fatal accidents caused by drunken drivers: 1
Fatalities: 1
Persons involved in fatal accidents: 2
Pedestrians involved in fatal accidents: 0
Home Mortgage Disclosure Act Aggregated Statistics For Year 2009 (Based on 4 partial tracts)
A) FHA, FSA/RHS & VA Home Purchase Loans
B) Conventional Home Purchase Loans
C) Refinancings
D) Home Improvement Loans
F) Non-occupant Loans on < 5 Family Dwellings (A B C & D)
G) Loans On Manufactured Home Dwelling (A B C & D)
Number
Average Value
Number
Average Value
Number
Average Value
Number
Average Value
Number
Average Value
Number
Average Value
LOANS ORIGINATED
3
$159,780
6
$127,600
53
$134,841
0
$0
1
$63,670
0
$0
APPLICATIONS APPROVED, NOT ACCEPTED
1
$131,500
0
$0
11
$163,137
0
$0
0
$0
0
$0
APPLICATIONS DENIED
0
$0
3
$110,200
15
$100,489
0
$0
0
$0
1
$66,250
APPLICATIONS WITHDRAWN
1
$74,240
0
$0
10
$171,469
1
$132,130
0
$0
0
$0
FILES CLOSED FOR INCOMPLETENESS
0
$0
0
$0
2
$171,500
0
$0
0
$0
0
$0
Aggregated Statistics For Year 2008 (Based on 4 partial tracts)
A) FHA, FSA/RHS & VA Home Purchase Loans
B) Conventional Home Purchase Loans
C) Refinancings
D) Home Improvement Loans
E) Loans on Dwellings For 5+ Families
F) Non-occupant Loans on < 5 Family Dwellings (A B C & D)
G) Loans On Manufactured Home Dwelling (A B C & D)
Number
Average Value
Number
Average Value
Number
Average Value
Number
Average Value
Number
Average Value
Number
Average Value
Number
Average Value
LOANS ORIGINATED
5
$149,666
12
$144,708
22
$131,466
5
$32,342
0
$0
4
$134,852
0
$0
APPLICATIONS APPROVED, NOT ACCEPTED
0
$0
2
$164,270
5
$183,864
2
$6,850
0
$0
1
$2,050
0
$0
APPLICATIONS DENIED
0
$0
3
$136,723
21
$129,696
5
$73,340
0
$0
1
$136,240
1
$48,720
APPLICATIONS WITHDRAWN
2
$182,320
2
$122,670
4
$116,892
1
$25,330
1
$4,621,050
0
$0
0
$0
FILES CLOSED FOR INCOMPLETENESS
0
$0
0
$0
0
$0
0
$0
0
$0
0
$0
0
$0
Aggregated Statistics For Year 2007 (Based on 4 partial tracts)
A) FHA, FSA/RHS & VA Home Purchase Loans
B) Conventional Home Purchase Loans
C) Refinancings
D) Home Improvement Loans
E) Loans on Dwellings For 5+ Families
F) Non-occupant Loans on < 5 Family Dwellings (A B C & D)
G) Loans On Manufactured Home Dwelling (A B C & D)
Number
Average Value
Number
Average Value
Number
Average Value
Number
Average Value
Number
Average Value
Number
Average Value
Number
Average Value
LOANS ORIGINATED
0
$0
28
$121,915
33
$109,090
10
$32,244
0
$0
2
$81,505
3
$76,407
APPLICATIONS APPROVED, NOT ACCEPTED
0
$0
1
$109,680
8
$83,416
2
$28,200
0
$0
0
$0
0
$0
APPLICATIONS DENIED
2
$107,915
9
$82,973
31
$132,128
7
$66,103
0
$0
0
$0
3
$45,773
APPLICATIONS WITHDRAWN
0
$0
2
$110,315
9
$128,339
0
$0
1
$5,476,800
0
$0
0
$0
FILES CLOSED FOR INCOMPLETENESS
0
$0
0
$0
5
$122,524
1
$84,550
0
$0
0
$0
0
$0
Aggregated Statistics For Year 2006 (Based on 4 partial tracts)
A) FHA, FSA/RHS & VA Home Purchase Loans
B) Conventional Home Purchase Loans
C) Refinancings
D) Home Improvement Loans
F) Non-occupant Loans on < 5 Family Dwellings (A B C & D)
G) Loans On Manufactured Home Dwelling (A B C & D)
Number
Average Value
Number
Average Value
Number
Average Value
Number
Average Value
Number
Average Value
Number
Average Value
LOANS ORIGINATED
1
$110,170
30
$108,772
42
$117,989
12
$71,291
4
$119,245
1
$44,650
APPLICATIONS APPROVED, NOT ACCEPTED
0
$0
5
$134,732
12
$90,558
3
$74,860
0
$0
1
$66,410
APPLICATIONS DENIED
0
$0
6
$78,343
30
$109,459
9
$51,126
0
$0
4
$49,250
APPLICATIONS WITHDRAWN
0
$0
1
$107,320
20
$118,923
3
$64,867
0
$0
0
$0
FILES CLOSED FOR INCOMPLETENESS
0
$0
3
$98,107
2
$132,610
0
$0
0
$0
0
$0
Aggregated Statistics For Year 2005 (Based on 4 partial tracts)
A) FHA, FSA/RHS & VA Home Purchase Loans
B) Conventional Home Purchase Loans
C) Refinancings
D) Home Improvement Loans
F) Non-occupant Loans on < 5 Family Dwellings (A B C & D)
G) Loans On Manufactured Home Dwelling (A B C & D)
Number
Average Value
Number
Average Value
Number
Average Value
Number
Average Value
Number
Average Value
Number
Average Value
LOANS ORIGINATED
1
$117,640
25
$119,058
59
$129,439
13
$42,997
5
$66,400
2
$88,965
APPLICATIONS APPROVED, NOT ACCEPTED
0
$0
7
$90,553
13
$137,162
2
$28,075
0
$0
0
$0
APPLICATIONS DENIED
0
$0
11
$97,679
40
$111,328
11
$26,894
3
$127,393
4
$25,572
APPLICATIONS WITHDRAWN
0
$0
5
$100,242
20
$151,780
0
$0
1
$169,780
1
$38,370
FILES CLOSED FOR INCOMPLETENESS
1
$60,930
1
$30,120
6
$135,417
0
$0
1
$36,280
0
$0
Aggregated Statistics For Year 2004 (Based on 4 partial tracts)
A) FHA, FSA/RHS & VA Home Purchase Loans
B) Conventional Home Purchase Loans
C) Refinancings
D) Home Improvement Loans
F) Non-occupant Loans on < 5 Family Dwellings (A B C & D)
G) Loans On Manufactured Home Dwelling (A B C & D)
Number
Average Value
Number
Average Value
Number
Average Value
Number
Average Value
Number
Average Value
Number
Average Value
LOANS ORIGINATED
1
$92,570
33
$119,347
55
$119,843
12
$29,272
4
$61,515
1
$45,240
APPLICATIONS APPROVED, NOT ACCEPTED
1
$117,070
2
$68,290
9
$115,547
2
$17,485
1
$13,690
1
$59,650
APPLICATIONS DENIED
1
$171,830
9
$93,250
41
$121,207
10
$35,051
0
$0
2
$36,660
APPLICATIONS WITHDRAWN
0
$0
5
$138,394
26
$120,741
2
$44,200
0
$0
1
$54,730
FILES CLOSED FOR INCOMPLETENESS
0
$0
1
$139,660
5
$86,526
0
$0
1
$35,600
0
$0
Aggregated Statistics For Year 2003 (Based on 4 partial tracts)
A) FHA, FSA/RHS & VA Home Purchase Loans
B) Conventional Home Purchase Loans
C) Refinancings
D) Home Improvement Loans
F) Non-occupant Loans on < 5 Family Dwellings (A B C & D)
Number
Average Value
Number
Average Value
Number
Average Value
Number
Average Value
Number
Average Value
LOANS ORIGINATED
3
$120,717
24
$115,661
99
$116,764
7
$25,206
2
$62,335
APPLICATIONS APPROVED, NOT ACCEPTED
0
$0
2
$92,675
15
$104,789
2
$43,290
1
$96,530
APPLICATIONS DENIED
1
$104,910
9
$67,074
34
$107,319
7
$25,541
0
$0
APPLICATIONS WITHDRAWN
0
$0
3
$133,207
20
$114,350
0
$0
0
$0
FILES CLOSED FOR INCOMPLETENESS
1
$105,430
1
$28,750
4
$111,005
0
$0
1
$47,920
Aggregated Statistics For Year 2002 (Based on 4 partial tracts)
A) FHA, FSA/RHS & VA Home Purchase Loans
B) Conventional Home Purchase Loans
C) Refinancings
D) Home Improvement Loans
F) Non-occupant Loans on < 5 Family Dwellings (A B C & D)
Number
Average Value
Number
Average Value
Number
Average Value
Number
Average Value
Number
Average Value
LOANS ORIGINATED
3
$101,780
26
$126,635
80
$109,776
5
$28,728
3
$70,460
APPLICATIONS APPROVED, NOT ACCEPTED
0
$0
5
$87,432
19
$122,129
4
$13,850
1
$126,400
APPLICATIONS DENIED
0
$0
8
$72,138
44
$99,001
4
$22,132
1
$140,840
APPLICATIONS WITHDRAWN
1
$64,350
4
$83,295
25
$109,073
1
$23,090
1
$6,850
FILES CLOSED FOR INCOMPLETENESS
0
$0
0
$0
7
$78,751
0
$0
0
$0
Aggregated Statistics For Year 2001 (Based on 4 partial tracts)
A) FHA, FSA/RHS & VA Home Purchase Loans
B) Conventional Home Purchase Loans
C) Refinancings
D) Home Improvement Loans
F) Non-occupant Loans on < 5 Family Dwellings (A B C & D)
Number
Average Value
Number
Average Value
Number
Average Value
Number
Average Value
Number
Average Value
LOANS ORIGINATED
1
$133,870
25
$105,528
102
$106,730
5
$31,748
8
$101,574
APPLICATIONS APPROVED, NOT ACCEPTED
0
$0
6
$33,867
7
$112,410
0
$0
1
$16,430
APPLICATIONS DENIED
1
$57,510
14
$42,526
23
$74,853
5
$16,778
1
$26,010
APPLICATIONS WITHDRAWN
1
$34,910
3
$40,760
17
$114,078
1
$26,050
1
$30,810
FILES CLOSED FOR INCOMPLETENESS
0
$0
0
$0
4
$78,885
0
$0
0
$0
Aggregated Statistics For Year 2000 (Based on 4 partial tracts)
A) FHA, FSA/RHS & VA Home Purchase Loans
B) Conventional Home Purchase Loans
C) Refinancings
D) Home Improvement Loans
F) Non-occupant Loans on < 5 Family Dwellings (A B C & D)
Number
Average Value
Number
Average Value
Number
Average Value
Number
Average Value
Number
Average Value
LOANS ORIGINATED
1
$97,080
21
$87,877
25
$90,986
5
$22,170
4
$68,375
APPLICATIONS APPROVED, NOT ACCEPTED
0
$0
5
$75,276
6
$95,568
4
$18,305
1
$41,080
APPLICATIONS DENIED
0
$0
12
$55,868
22
$63,325
8
$12,100
2
$39,575
APPLICATIONS WITHDRAWN
1
$36,970
3
$52,520
6
$64,695
0
$0
0
$0
FILES CLOSED FOR INCOMPLETENESS
0
$0
1
$37,650
4
$69,355
0
$0
0
$0
Aggregated Statistics For Year 1999 (Based on 2 partial tracts)
A) FHA, FSA/RHS & VA Home Purchase Loans
B) Conventional Home Purchase Loans
C) Refinancings
D) Home Improvement Loans
F) Non-occupant Loans on < 5 Family Dwellings (A B C & D)
Detailed PMIC statistics for the following Tracts:0215.00
, 0220.00
2002 - 2018 National Fire Incident Reporting System (NFIRS) incidents
According to the data from the years 2002 - 2018 the average number of fire incidents per year is 8. The highest number of fire incidents - 16 took place in 2009, and the least - 2 in 2017. The data has a decreasing trend.
When looking into fire subcategories, the most incidents belonged to: Outside Fires (46.0%), and Mobile Property/Vehicle Fires (29.2%).
Fire incident types reported to NFIRS in Zip Code 43451


+$2,762
-$3,706
 Nearest zip codes: 43403, 43437, 43413, 43466, 43402, 43462.


 According to the data from the years 2002 - 2018 the average number of fire incidents per year is 8. The highest number of fire incidents - 16 took place in 2009, and the least - 2 in 2017. The data has a decreasing trend.
 When looking into fire subcategories, the most incidents belonged to: Outside Fires (46.0%), and Mobile Property/Vehicle Fires (29.2%).