Estimated zip code population in 2022: 2,037 Zip code population in 2010: 1,460 Zip code population in 2000: 1,544
Houses and condos: 908 Renter-occupied apartments: 256
% of renters here:
30%
State:
33%
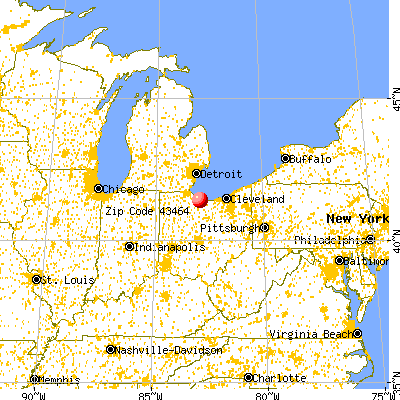
March 2022 cost of living index in zip code 43464: 84.9 (less than average, U.S. average is 100)
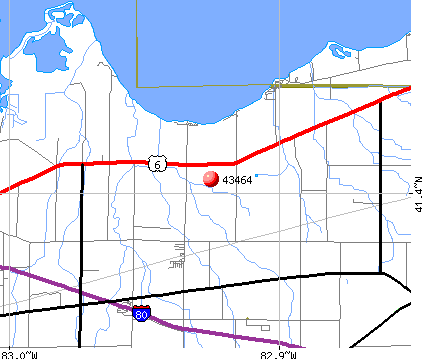
Land area: 33.3 sq. mi. Water area: 4.7 sq. mi.
Population density: 61 people per square mile
(very low).
OSM Map
General Map
Google Map
MSN Map
OSM Map
General Map
Google Map
MSN Map
OSM Map
General Map
Google Map
MSN Map
OSM Map
General Map
Google Map
MSN Map
Please wait while loading the map...
Real estate property taxes paid for housing units in 2022:
This zip code:
1.1% ($1,475)
Ohio:
1.3% ($2,639)
Median real estate property taxes paid for housing units with mortgages in 2022: $1,701 (1.2%) Median real estate property taxes paid for housing units with no mortgage in 2022: $1,249 (1.2%)
Business Search- 14 Million verified businesses
Males: 979
(48.1%)
Females: 1,058
(51.9%)
For population 25 years and over in 43464:
High school or higher: 91.6%
Bachelor's degree or higher: 12.7%
Graduate or professional degree: 5.4%
Unemployed: 7.0%
Mean travel time to work (commute): 23.2 minutes
For population 15 years and over in 43464:
Never married: 31.7%
Now married: 38.7%
Separated: 2.3%
Widowed: 16.2%
Divorced: 11.2%
Zip code 43464 compared to state average:
Median household income below state average.
Median house value below state average.
Unemployed percentage above state average.
Black race population percentage significantly below state average.
Foreign-born population percentage below state average.
Length of stay since moving in significantly above state average.
Percentage of population with a bachelor's degree or higher significantly below state average.
Averages for the 2020 tax year for zip code 43464, filed in 2021:
Average Adjusted Gross Income (AGI) in 2020: $48,627 (Individual Income Tax Returns)
Here:
$48,627
State:
$67,288
Salary/wage: $42,844 (reported on 82.1% of returns)
Here:
$42,844
State:
$55,628
(% of AGI for various income ranges: 1144.7% for AGIs below $25k, 3310.0% for AGIs $25k-50k, 6477.1% for AGIs $50k-75k, 9652.5% for AGIs $75k-100k, 18162.5% for AGIs $100k-200k)
Taxable interest for individuals: $580 (reported on 22.4% of returns)
This zip code:
$580
Ohio:
$1,518
(% of AGI for various income ranges: 4.1% for AGIs below $25k, 8.3% for AGIs $25k-50k, 48.6% for AGIs $50k-75k, 77.5% for AGIs $100k-200k)
Ordinary dividends: $1,610 (reported on 14.9% of returns)
Here:
$1,610
State:
$7,167
(% of AGI for various income ranges: 27.8% for AGIs $25k-50k, 14.3% for AGIs $50k-75k, 252.5% for AGIs $100k-200k)
Net capital gain/loss in AGI: +$4,700 (reported on 13.4% of returns)
Here:
+$4,700
State:
+$18,919
(% of AGI for various income ranges: 75.6% for AGIs $25k-50k, 717.5% for AGIs $100k-200k)
Profit/loss from business: +$1,662 (reported on 11.9% of returns)
Here:
+$1,662
State:
+$13,744
(% of AGI for various income ranges: 26.5% for AGIs below $25k, 417.5% for AGIs $75k-100k)
Taxable individual retirement arrangement distribution: $11,983 (reported on 9.0% of returns)
43464:
$11,983
Ohio:
$18,876
(% of AGI for various income ranges: 92.4% for AGIs below $25k, 802.9% for AGIs $50k-75k)
Earned income credit: $2,075 (reported on 17.9% of returns)
Here:
$2,075
State:
$2,304
(% of AGI for various income ranges: 80.6% for AGIs below $25k, 62.2% for AGIs $25k-50k)
Percentage of individuals using paid preparers for their 2020 taxes: 95.5%
Here:
96%
State:
94%
(% for various income ranges: 91.3% for AGIs below $25k, 100.0% for AGIs $25k-50k, 100.0% for AGIs $50k-75k, 83.3% for AGIs $75k-100k, 100.0% for AGIs $100k-200k)
Averages for the 2012 tax year for zip code 43464, filed in 2013:
Average Adjusted Gross Income (AGI) in 2012: $40,375 (Individual Income Tax Returns)
Here:
$40,375
State:
$54,926
Salary/wage: $33,781 (reported on 86.3% of returns)
Here:
$33,781
State:
$45,869
(% of AGI for various income ranges: 74.3% for AGIs below $25k, 76.5% for AGIs $25k-50k, 74.8% for AGIs $50k-75k, 77.9% for AGIs $75k-100k, 61.4% for AGIs $100k-200k)
Taxable interest for individuals: $614 (reported on 28.8% of returns)
This zip code:
$614
Ohio:
$1,297
(% of AGI for various income ranges: 0.8% for AGIs below $25k, 0.5% for AGIs $25k-50k, 0.6% for AGIs $50k-75k, 0.2% for AGIs $100k-200k)
Ordinary dividends: $1,767 (reported on 12.3% of returns)
Here:
$1,767
State:
$5,821
(% of AGI for various income ranges: 0.3% for AGIs below $25k, 0.7% for AGIs $50k-75k, 2.9% for AGIs $75k-100k)
Net capital gain/loss in AGI: +$2,025 (reported on 11.0% of returns)
Here:
+$2,025
State:
+$11,232
(% of AGI for various income ranges: 0.8% for AGIs $50k-75k, 3.4% for AGIs $75k-100k)
Profit/loss from business: +$6,489 (reported on 12.3% of returns)
Here:
+$6,489
State:
+$12,773
(% of AGI for various income ranges: 5.3% for AGIs below $25k, 1.6% for AGIs $25k-50k, 3.8% for AGIs $50k-75k)
Taxable individual retirement arrangement distribution: $8,660 (reported on 6.8% of returns)
43464:
$8,660
Ohio:
$14,511
(% of AGI for various income ranges: 2.7% for AGIs $25k-50k, 3.3% for AGIs $50k-75k)
Total itemized deductions: $15,077 (20% of AGI, reported on 17.8% of returns)
Here:
$15,077
State:
$21,278
Here:
19.9% of AGI
State:
18.8% of AGI
(% of AGI for various income ranges: 6.1% for AGIs $25k-50k, 7.1% for AGIs $50k-75k, 10.0% for AGIs $75k-100k, 8.8% for AGIs $100k-200k)
Charity contributions: $2,750 (reported on 11.0% of returns)
Here:
$2,750
State:
$3,943
(% of AGI for various income ranges: 0.8% for AGIs below $25k, 1.7% for AGIs $50k-75k, 1.0% for AGIs $100k-200k)
Taxes paid: $5,231 (reported on 17.8% of returns)
43464:
$5,231
State:
$9,568
(% of AGI for various income ranges: 1.4% for AGIs $25k-50k, 2.3% for AGIs $50k-75k, 3.6% for AGIs $75k-100k, 3.9% for AGIs $100k-200k)
Earned income credit: $1,907 (reported on 20.5% of returns)
Here:
$1,907
State:
$2,285
(% of AGI for various income ranges: 5.6% for AGIs below $25k, 0.8% for AGIs $25k-50k)
Percentage of individuals using paid preparers for their 2012 taxes: 57.5%
Here:
58%
State:
51%
(% for various income ranges: 45.2% for AGIs below $25k, 59.1% for AGIs $25k-50k, 72.7% for AGIs $50k-75k, 75.0% for AGIs $75k-100k, 80.0% for AGIs $100k-200k)
Averages for the 2004 tax year for zip code 43464, filed in 2005:
Average Adjusted Gross Income (AGI) in 2004: $33,962 (Individual Income Tax Returns)
Here:
$33,962
State:
$44,480
Salary/wage: $31,114 (reported on 88.3% of returns)
Here:
$31,114
State:
$39,198
(% of AGI for various income ranges: 109.4% for AGIs below $10k, 73.4% for AGIs $10k-25k, 87.5% for AGIs $25k-50k, 78.9% for AGIs $50k-75k, 85.0% for AGIs $75k-100k, 65.8% for AGIs over 100k)
Taxable interest for individuals: $1,115 (reported on 38.0% of returns)
This zip code:
$1,115
Ohio:
$1,532
(% of AGI for various income ranges: 3.1% for AGIs below $10k, 1.8% for AGIs $10k-25k, 0.8% for AGIs $25k-50k, 1.9% for AGIs $50k-75k, 0.6% for AGIs $75k-100k, 0.8% for AGIs over 100k)
Taxable dividends: $878 (reported on 16.8% of returns)
Here:
$878
State:
$3,496
(% of AGI for various income ranges: 0.5% for AGIs below $10k, 0.1% for AGIs $10k-25k, 0.1% for AGIs $25k-50k, 1.0% for AGIs $50k-75k, 0.9% for AGIs $75k-100k)
Net capital gain/loss: +$2,146 (reported on 12.1% of returns)
Here:
+$2,146
State:
+$8,582
(% of AGI for various income ranges: -3.6% for AGIs below $10k, 0.3% for AGIs $25k-50k, 1.7% for AGIs $50k-75k, 2.0% for AGIs $75k-100k, 0.4% for AGIs over 100k)
Profit/loss from business: +$4,657 (reported on 9.5% of returns)
Here:
+$4,657
State:
+$10,813
IRA payment deduction: $1,714 (reported on 1.9% of returns)
43464:
$1,714
Ohio:
$2,794
Total itemized deductions: $11,659 (20% of AGI, reported on 22.8% of returns)
Here:
$11,659
State:
$17,503
Here:
20.1% of AGI
State:
20.8% of AGI
(% of AGI for various income ranges: 4.0% for AGIs $10k-25k, 7.3% for AGIs $25k-50k, 8.2% for AGIs $50k-75k, 10.3% for AGIs $75k-100k, 11.2% for AGIs over 100k)
Charity contributions deductions: $1,161 (2% of AGI, reported on 16.1% of returns)
Here:
$1,161
State:
$3,087
Here:
1.8% of AGI
State:
3.4% of AGI
(% of AGI for various income ranges: 0.5% for AGIs $25k-50k, 0.8% for AGIs $50k-75k, 0.7% for AGIs $75k-100k, 0.6% for AGIs over 100k)
Total tax: $4,056 (reported on 73.3% of returns)
43464:
$4,056
State:
$6,781
(% of AGI for various income ranges: 1.8% for AGIs below $10k, 3.9% for AGIs $10k-25k, 7.4% for AGIs $25k-50k, 9.0% for AGIs $50k-75k, 9.1% for AGIs $75k-100k, 17.3% for AGIs over 100k)
Earned income credit: $1,722 (reported on 15.7% of returns)
Here:
$1,722
State:
$1,696
Percentage of individuals using paid preparers for their 2004 taxes: 62.4%
Here:
62%
State:
55%
(% for various income ranges: 48.6% for AGIs below $10k, 65.8% for AGIs $10k-25k, 66.0% for AGIs $25k-50k, 66.7% for AGIs $50k-75k, 57.9% for AGIs $75k-100k, 70.8% for AGIs over 100k)
Household received Food Stamps/SNAP in the past 12 months: 103 Household did not receive Food Stamps/SNAP in the past 12 months: 755
Women who had a birth in the past 12 months: 23 (24 now married, 0 unmarried) Women who did not have a birth in the past 12 months: 494 (152 now married, 341 unmarried)
Housing units in zip code 43464 with a mortgage: 274 (26 second mortgage, 27 both second mortgage and home equity loan) Houses without a mortgage: 64
Median monthly owner costs for units with a mortgage: $1,213 Median monthly owner costs for units without a mortgage: $491
Residents with income below the poverty level in 2022:
This zip code:
9.3%
Whole state:
13.4%
Residents with income below 50% of the poverty level in 2022:
This zip code:
0.4%
Whole state:
7.0%
Median number of rooms in houses and condos:
Here:
6.4
State:
6.7
Median number of rooms in apartments:
Here:
6.6
State:
4.4
Notable locations in this zip code not listed on our city pages
Notable locations in zip code 43464: Riley Grange (A), Ohio Agricultural Experimental Station (B), Bay Harbor Marina (C), Meggitt Farms (D), Townsend Township Volunteer Fire Department (E). Display/hide their locations on the map
Parks in zip code 43464 include: Willow Point Wildlife Area (1), Blue Heron Reserve (2), Miller Blue Hole Wildlife Area (3), Pickerel Creek Wildlife Area (4). Display/hide their locations on the map
Size of family households: 256 2-persons, 53 3-persons, 79 4-persons, 91 5-persons, 30 6-persons
Size of nonfamily households: 275 1-person, 73 2-persons
345 married couples with children.
16 single-parent households (16 men).
94.6% of residents of 43464 zip code speak English at home.
4.4% of residents speak Spanish at home (67% very well, 33% not well).
0.5% of residents speak other language at home (100% very well).
Foreign born population: 49 (2.4%) (100.0% of them are naturalized citizens)
This zip code:
2.4%
Whole state:
5.0%
51%Honduras
24%American
19%German
17%Irish
17%European
2%English
1%Polish
Year of entry for the foreign-born population
262010 or later
262000 to 2009
01990 to 1999
22Before 1990
Housing units lacking complete kitchen facilities: 2.3%
45.7%Bottled, tank, or LP gas
33.8%Electricity
8.1%Utility gas
6.4%Wood
3.2%Fuel oil, kerosene, etc.
3.0%Other fuel
Population in 1990: 1,976.
Place of birth for U.S.-born residents:
This state: 1,829
Northeast: 39
Midwest: 9
South: 80
66% of the 43464 zip code residents lived in the same house 5 years ago. Out of people who lived in different houses, 26% lived in this county. Out of people who lived in different counties, 50% lived in Ohio.
96% of the 43464 zip code residents lived in the same house 1 year ago. Out of people who lived in different houses, 104% moved from this county.
Private vs. public school enrollment:
Students in private schools in grades 1 to 8 (elementary and middle school):
Here:
0.0%
Ohio:
16.0%
Students in private schools in grades 9 to 12 (high school):
Here:
0.0%
Ohio:
13.1%
Students in private undergraduate colleges: 6
Here:
11.0%
Ohio:
22.3%
Occupation by median earnings in the past 12 months ($)
85,729Transportation occupations
81,210Sales and related occupations
64,148Health diagnosing and treating practitioners and other technical occupations
55,583Installation, maintenance, and repair occupations
52,605Construction and extraction occupations
50,382Education, training, and library occupations
Top industries in this zip code by the number of employees in 2005:
Administrative and Support and Waste Management and Remediation Services: Solid Waste Landfill (20-49 employees: 1 establishment)
Construction: Commercial and Institutional Building Construction (10-19: 1)
Administrative and Support and Waste Management and Remediation Services: Solid Waste Collection (5-9: 1)
Other Services (except Public Administration): Religious Organizations (1-4: 2)
Administrative and Support and Waste Management and Remediation Services: Hazardous Waste Treatment and Disposal (1-4: 1)
Accommodation and Food Services: Mobile Food Services (1-4: 1)
Construction: Painting and Wall Covering Contractors (1-4: 1)
People in group quarters in 2000:
14 people in other noninstitutional group quarters
Fatal accident statistics in 2014:
Fatal accident count: 1
Vehicles involved in fatal accidents: 1
Fatal accidents caused by drunken drivers: 1
Fatalities: 1
Persons involved in fatal accidents: 1
Pedestrians involved in fatal accidents: 0
Fatal accident statistics in 2013:
Fatal accident count: 1
Vehicles involved in fatal accidents: 2
Fatal accidents caused by drunken drivers: 0
Fatalities: 1
Persons involved in fatal accidents: 2
Pedestrians involved in fatal accidents: 0
2002 - 2018 National Fire Incident Reporting System (NFIRS) incidents
According to the data from the years 2002 - 2018 the average number of fire incidents per year is 14. The highest number of fires - 24 took place in 2016, and the least - 2 in 2002. The data has a rising trend.
When looking into fire subcategories, the most incidents belonged to: Outside Fires (52.9%), and Structure Fires (28.9%).
Fire incident types reported to NFIRS in Zip Code 43464


 Nearest zip codes: 43410, 43433, 44824, 43452, 43439, 44811.


 According to the data from the years 2002 - 2018 the average number of fire incidents per year is 14. The highest number of fires - 24 took place in 2016, and the least - 2 in 2002. The data has a rising trend.
 When looking into fire subcategories, the most incidents belonged to: Outside Fires (52.9%), and Structure Fires (28.9%).