Estimated zip code population in 2022: 2,678 Zip code population in 2010: 2,811 Zip code population in 2000: 2,967
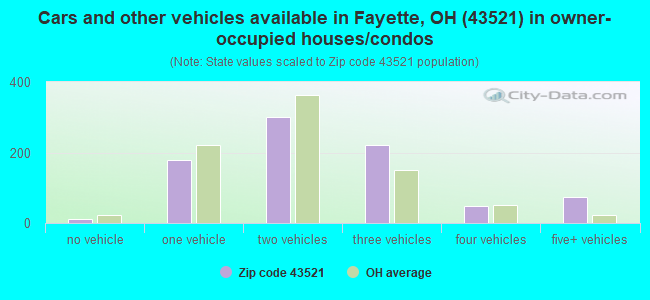
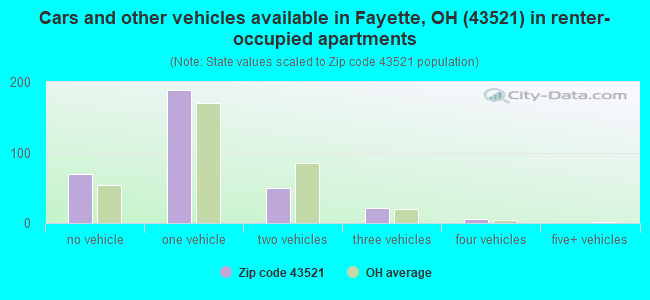
Houses and condos: 1,239 Renter-occupied apartments: 333
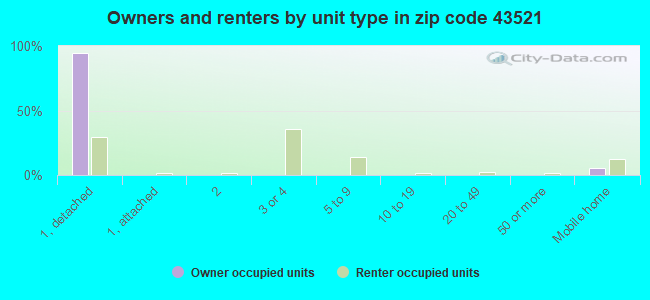
% of renters here:
28%
State:
33%
March 2022 cost of living index in zip code 43521: 82.8 (low, U.S. average is 100)
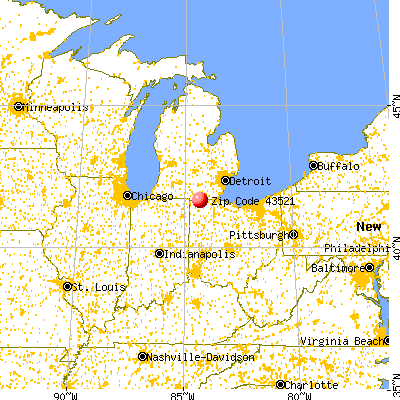
Land area: 66.5 sq. mi. Water area: 0.3 sq. mi.
Population density: 40 people per square mile
(very low).
OSM Map
General Map
Google Map
MSN Map
OSM Map
General Map
Google Map
MSN Map
OSM Map
General Map
Google Map
MSN Map
OSM Map
General Map
Google Map
MSN Map
Please wait while loading the map...
Real estate property taxes paid for housing units in 2022:
This zip code:
1.2% ($1,645)
Ohio:
1.3% ($2,639)
Median real estate property taxes paid for housing units with mortgages in 2022: $1,817 (1.1%) Median real estate property taxes paid for housing units with no mortgage in 2022: $1,423 (1.3%)
Business Search- 14 Million verified businesses
Males: 1,224
(45.7%)
Females: 1,454
(54.3%)
For population 25 years and over in 43521:
High school or higher: 92.7%
Bachelor's degree or higher: 12.9%
Graduate or professional degree: 4.8%
Unemployed: 2.1%
Mean travel time to work (commute): 24.5 minutes
For population 15 years and over in 43521:
Never married: 27.7%
Now married: 55.3%
Separated: 1.0%
Widowed: 5.2%
Divorced: 10.8%
Zip code 43521 compared to state average:
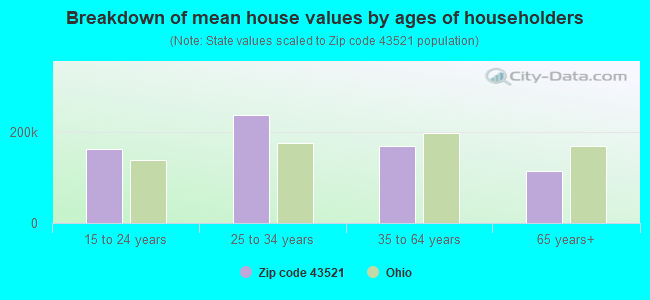
Median house value below state average.
Unemployed percentage below state average.
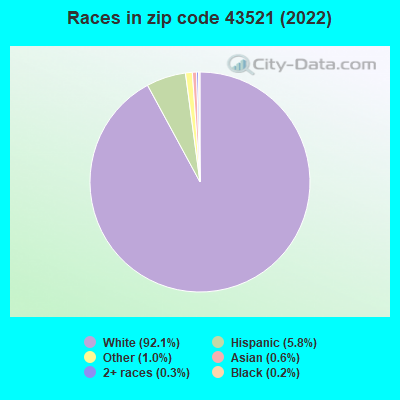
Black race population percentage significantly below state average.
Foreign-born population percentage significantly below state average.
Length of stay since moving in significantly above state average.
Percentage of population with a bachelor's degree or higher significantly below state average.
Averages for the 2020 tax year for zip code 43521, filed in 2021:
Average Adjusted Gross Income (AGI) in 2020: $48,902 (Individual Income Tax Returns)
Here:
$48,902
State:
$67,288
Salary/wage: $41,775 (reported on 84.2% of returns)
Here:
$41,775
State:
$55,628
(% of AGI for various income ranges: 1075.9% for AGIs below $25k, 3532.6% for AGIs $25k-50k, 6496.5% for AGIs $50k-75k, 9185.0% for AGIs $75k-100k, 17984.3% for AGIs $100k-200k)
Taxable interest for individuals: $1,142 (reported on 23.3% of returns)
This zip code:
$1,142
Ohio:
$1,518
(% of AGI for various income ranges: 20.3% for AGIs below $25k, 22.9% for AGIs $25k-50k, 12.4% for AGIs $50k-75k, 63.7% for AGIs $75k-100k, 195.7% for AGIs $100k-200k)
Ordinary dividends: $2,100 (reported on 13.5% of returns)
Here:
$2,100
State:
$7,167
(% of AGI for various income ranges: 22.5% for AGIs below $25k, 14.0% for AGIs $25k-50k, 33.5% for AGIs $50k-75k, 67.5% for AGIs $75k-100k, 208.6% for AGIs $100k-200k)
Net capital gain/loss in AGI: +$4,746 (reported on 9.8% of returns)
Here:
+$4,746
State:
+$18,919
(% of AGI for various income ranges: 15.6% for AGIs below $25k, 13.4% for AGIs $25k-50k, 19.4% for AGIs $50k-75k, 210.0% for AGIs $75k-100k, 455.7% for AGIs $100k-200k)
Profit/loss from business: +$10,821 (reported on 10.5% of returns)
Here:
+$10,821
State:
+$13,744
(% of AGI for various income ranges: 44.7% for AGIs below $25k, 116.9% for AGIs $25k-50k, 50.6% for AGIs $50k-75k, 326.2% for AGIs $75k-100k, 880.0% for AGIs $100k-200k)
Taxable individual retirement arrangement distribution: $9,177 (reported on 9.8% of returns)
43521:
$9,177
Ohio:
$18,876
(% of AGI for various income ranges: 91.2% for AGIs below $25k, 63.4% for AGIs $25k-50k, 159.4% for AGIs $50k-75k, 582.9% for AGIs $100k-200k)
Earned income credit: $2,305 (reported on 15.0% of returns)
Here:
$2,305
State:
$2,304
(% of AGI for various income ranges: 80.0% for AGIs below $25k, 58.6% for AGIs $25k-50k)
Percentage of individuals using paid preparers for their 2020 taxes: 96.2%
Here:
96%
State:
94%
(% for various income ranges: 95.3% for AGIs below $25k, 95.2% for AGIs $25k-50k, 95.7% for AGIs $50k-75k, 100.0% for AGIs $75k-100k, 100.0% for AGIs $100k-200k)
Averages for the 2012 tax year for zip code 43521, filed in 2013:
Average Adjusted Gross Income (AGI) in 2012: $40,863 (Individual Income Tax Returns)
Here:
$40,863
State:
$54,926
Salary/wage: $33,367 (reported on 86.2% of returns)
Here:
$33,367
State:
$45,869
(% of AGI for various income ranges: 76.6% for AGIs below $25k, 84.1% for AGIs $25k-50k, 78.7% for AGIs $50k-75k, 73.5% for AGIs $75k-100k, 38.9% for AGIs $100k-200k)
Taxable interest for individuals: $939 (reported on 31.5% of returns)
This zip code:
$939
Ohio:
$1,297
(% of AGI for various income ranges: 1.2% for AGIs below $25k, 0.6% for AGIs $25k-50k, 0.7% for AGIs $50k-75k, 0.4% for AGIs $75k-100k, 0.9% for AGIs $100k-200k)
Ordinary dividends: $1,470 (reported on 15.4% of returns)
Here:
$1,470
State:
$5,821
(% of AGI for various income ranges: 0.6% for AGIs below $25k, 0.5% for AGIs $25k-50k, 0.8% for AGIs $50k-75k, 0.4% for AGIs $75k-100k, 0.5% for AGIs $100k-200k)
Net capital gain/loss in AGI: +$1,675 (reported on 9.2% of returns)
Here:
+$1,675
State:
+$11,232
(% of AGI for various income ranges: 0.2% for AGIs $50k-75k, 0.3% for AGIs $75k-100k, 1.2% for AGIs $100k-200k)
Profit/loss from business: +$5,284 (reported on 14.6% of returns)
Here:
+$5,284
State:
+$12,773
(% of AGI for various income ranges: 5.8% for AGIs below $25k, 0.3% for AGIs $25k-50k, 2.0% for AGIs $50k-75k, 3.9% for AGIs $75k-100k)
Taxable individual retirement arrangement distribution: $9,831 (reported on 10.0% of returns)
43521:
$9,831
Ohio:
$14,511
(% of AGI for various income ranges: 3.4% for AGIs below $25k, 2.2% for AGIs $25k-50k, 1.9% for AGIs $50k-75k, 5.7% for AGIs $75k-100k)
Total itemized deductions: $16,360 (23% of AGI, reported on 19.2% of returns)
Here:
$16,360
State:
$21,278
Here:
23.0% of AGI
State:
18.8% of AGI
(% of AGI for various income ranges: 6.0% for AGIs below $25k, 6.2% for AGIs $25k-50k, 7.2% for AGIs $50k-75k, 9.2% for AGIs $75k-100k, 9.7% for AGIs $100k-200k)
Charity contributions: $2,900 (reported on 13.1% of returns)
Here:
$2,900
State:
$3,943
(% of AGI for various income ranges: 0.8% for AGIs $25k-50k, 0.8% for AGIs $50k-75k, 0.9% for AGIs $75k-100k, 1.8% for AGIs $100k-200k)
Taxes paid: $5,896 (reported on 18.5% of returns)
43521:
$5,896
State:
$9,568
(% of AGI for various income ranges: 0.7% for AGIs below $25k, 1.6% for AGIs $25k-50k, 2.3% for AGIs $50k-75k, 3.2% for AGIs $75k-100k, 5.0% for AGIs $100k-200k)
Earned income credit: $2,132 (reported on 19.2% of returns)
Here:
$2,132
State:
$2,285
(% of AGI for various income ranges: 6.0% for AGIs below $25k, 1.1% for AGIs $25k-50k)
Percentage of individuals using paid preparers for their 2012 taxes: 63.8%
Here:
64%
State:
51%
(% for various income ranges: 55.8% for AGIs below $25k, 64.1% for AGIs $25k-50k, 70.0% for AGIs $50k-75k, 81.8% for AGIs $75k-100k, 75.0% for AGIs $100k-200k)
Averages for the 2004 tax year for zip code 43521, filed in 2005:
Average Adjusted Gross Income (AGI) in 2004: $33,278 (Individual Income Tax Returns)
Here:
$33,278
State:
$44,480
Salary/wage: $30,816 (reported on 86.8% of returns)
Here:
$30,816
State:
$39,198
(% of AGI for various income ranges: 101.9% for AGIs below $10k, 80.0% for AGIs $10k-25k, 86.6% for AGIs $25k-50k, 80.9% for AGIs $50k-75k, 83.1% for AGIs $75k-100k, 41.9% for AGIs over 100k)
Taxable interest for individuals: $1,199 (reported on 38.8% of returns)
This zip code:
$1,199
Ohio:
$1,532
(% of AGI for various income ranges: 6.0% for AGIs below $10k, 2.4% for AGIs $10k-25k, 1.2% for AGIs $25k-50k, 1.1% for AGIs $50k-75k, 1.0% for AGIs $75k-100k, 1.3% for AGIs over 100k)
Taxable dividends: $1,349 (reported on 18.3% of returns)
Here:
$1,349
State:
$3,496
(% of AGI for various income ranges: 1.4% for AGIs below $10k, 1.1% for AGIs $10k-25k, 0.5% for AGIs $25k-50k, 0.4% for AGIs $50k-75k, 0.3% for AGIs $75k-100k, 2.8% for AGIs over 100k)
Net capital gain/loss: +$8,912 (reported on 13.3% of returns)
Here:
+$8,912
State:
+$8,582
(% of AGI for various income ranges: -1.8% for AGIs below $10k, 1.5% for AGIs $10k-25k, 0.9% for AGIs $25k-50k, 0.4% for AGIs $50k-75k, 6.3% for AGIs $75k-100k, 24.5% for AGIs over 100k)
Profit/loss from business: +$7,362 (reported on 13.0% of returns)
Here:
+$7,362
State:
+$10,813
(% of AGI for various income ranges: 9.6% for AGIs below $10k, 4.8% for AGIs $10k-25k, 2.1% for AGIs $25k-50k, 4.0% for AGIs $50k-75k, 2.0% for AGIs $75k-100k)
Profit/loss from farming: +$2,241 (reported on 6.4% of returns)
Here:
+$2,241
State:
-$3,706
(% of AGI for various income ranges: 2.5% for AGIs $10k-25k, -1.2% for AGIs $25k-50k, 2.4% for AGIs $50k-75k, -0.1% for AGIs $75k-100k)
IRA payment deduction: $2,575 (reported on 2.9% of returns)
43521:
$2,575
Ohio:
$2,794
Total itemized deductions: $13,013 (23% of AGI, reported on 22.5% of returns)
Here:
$13,013
State:
$17,503
Here:
23.4% of AGI
State:
20.8% of AGI
(% of AGI for various income ranges: 6.7% for AGIs $10k-25k, 7.0% for AGIs $25k-50k, 10.7% for AGIs $50k-75k, 12.2% for AGIs $75k-100k, 10.7% for AGIs over 100k)
Charity contributions deductions: $2,409 (4% of AGI, reported on 15.8% of returns)
Here:
$2,409
State:
$3,087
Here:
4.1% of AGI
State:
3.4% of AGI
(% of AGI for various income ranges: 0.7% for AGIs $10k-25k, 0.7% for AGIs $25k-50k, 1.8% for AGIs $50k-75k, 1.4% for AGIs $75k-100k, 1.4% for AGIs over 100k)
Total tax: $3,549 (reported on 75.1% of returns)
43521:
$3,549
State:
$6,781
(% of AGI for various income ranges: 3.2% for AGIs below $10k, 4.8% for AGIs $10k-25k, 6.7% for AGIs $25k-50k, 8.7% for AGIs $50k-75k, 9.1% for AGIs $75k-100k, 16.1% for AGIs over 100k)
Earned income credit: $1,665 (reported on 15.6% of returns)
Here:
$1,665
State:
$1,696
Percentage of individuals using paid preparers for their 2004 taxes: 65.2%
Here:
65%
State:
55%
(% for various income ranges: 58.4% for AGIs below $10k, 64.6% for AGIs $10k-25k, 64.6% for AGIs $25k-50k, 72.6% for AGIs $50k-75k, 76.3% for AGIs $75k-100k, 71.4% for AGIs over 100k)
Household received Food Stamps/SNAP in the past 12 months: 166 Household did not receive Food Stamps/SNAP in the past 12 months: 1,006
Women who had a birth in the past 12 months: 20 (18 now married, 2 unmarried) Women who did not have a birth in the past 12 months: 638 (256 now married, 381 unmarried)
Housing units in zip code 43521 with a mortgage: 454 (95 second mortgage, 91 both second mortgage and home equity loan) Houses without a mortgage: 26
Median monthly owner costs for units with a mortgage: $1,144 Median monthly owner costs for units without a mortgage: $438
Residents with income below the poverty level in 2022:
This zip code:
14.8%
Whole state:
13.4%
Residents with income below 50% of the poverty level in 2022:
This zip code:
10.4%
Whole state:
7.0%
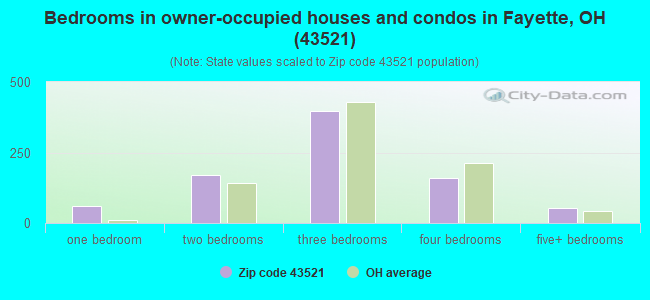
Median number of rooms in houses and condos:
Here:
6.6
State:
6.7
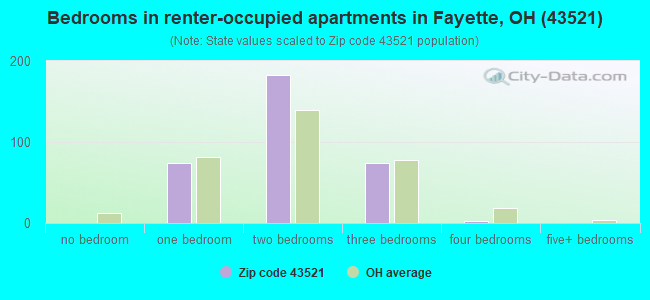
Median number of rooms in apartments:
Here:
4.3
State:
4.4
Notable locations in this zip code not listed on our city pages
Churches in zip code 43521 include: Fayette Christian Church (A), Fayette Church of the Nazarene (B), Fayette United Methodist Church (C), Our Lady of Mercy Catholic Church (D), Fayette Bible Church (E), Ambrose Baptist Church (F). Display/hide their locations on the map
In group quarters: 7 (-1 institutionalized population)
Size of family households: 389 2-persons, 168 3-persons, 96 4-persons, 58 5-persons, 10 6-persons, 6 7-or-more-persons
Size of nonfamily households: 386 1-person, 56 2-persons
412 married couples with children.
75 single-parent households (13 men, 62 women).
97.9% of residents of 43521 zip code speak English at home.
1.7% of residents speak Spanish at home (68% very well, 23% well, 9% not well).
0.2% of residents speak Asian or Pacific Island language at home (100% very well).
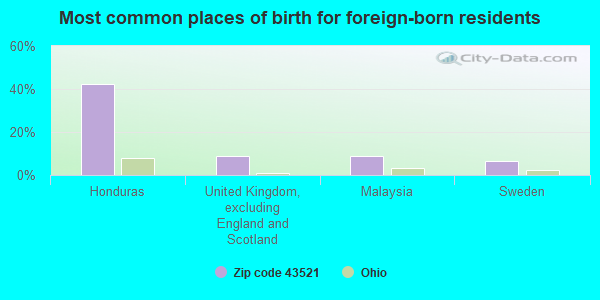
Foreign born population: 45 (1.7%) (57.3% of them are naturalized citizens)
This zip code:
1.7%
Whole state:
5.0%
42%Honduras
9%United Kingdom, excluding England and Scotland
9%Malaysia
7%Sweden
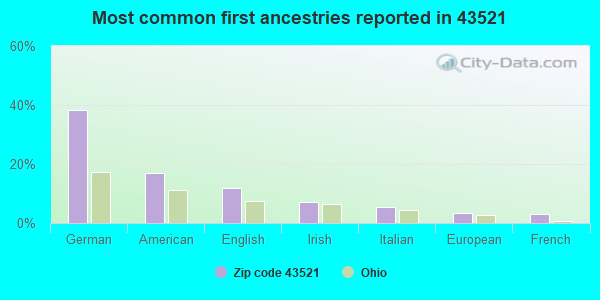
38%German
17%American
12%English
7%Irish
5%Italian
3%European
3%French
Year of entry for the foreign-born population
172010 or later
92000 to 2009
31990 to 1999
23Before 1990
Housing units lacking complete plumbing facilities: 2.9% Housing units lacking complete kitchen facilities: 3.1%
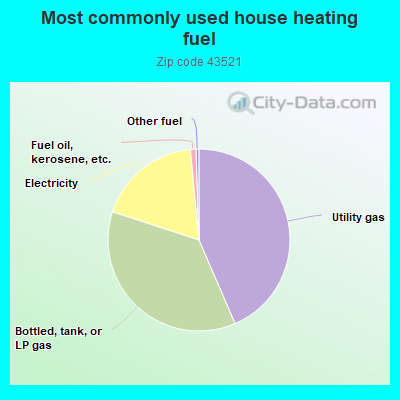
43.4%Utility gas
36.4%Bottled, tank, or LP gas
18.4%Electricity
1.0%Fuel oil, kerosene, etc.
0.5%Other fuel
Population in 1990: 2,248. Population change in the 1990s: +719 (+32.0%).
Place of birth for U.S.-born residents:
This state: 1,762
Northeast: 31
Midwest: 676
South: 132
West: 13
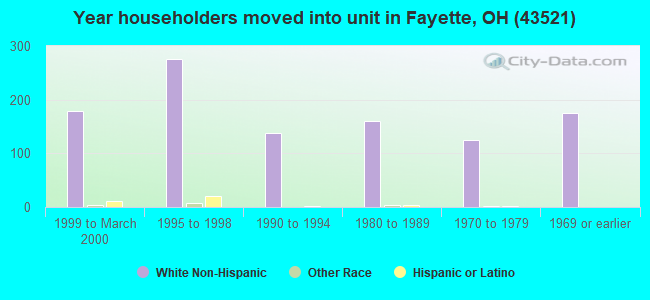
59% of the 43521 zip code residents lived in the same house 5 years ago. Out of people who lived in different houses, 63% lived in this county. Out of people who lived in different counties, 50% lived in Ohio.
92% of the 43521 zip code residents lived in the same house 1 year ago. Out of people who lived in different houses, 29% moved from this county. Out of people who lived in different houses, 68% moved from different county within same state. Out of people who lived in different houses, 2% moved from different state. Out of people who lived in different houses, 6% moved from abroad.
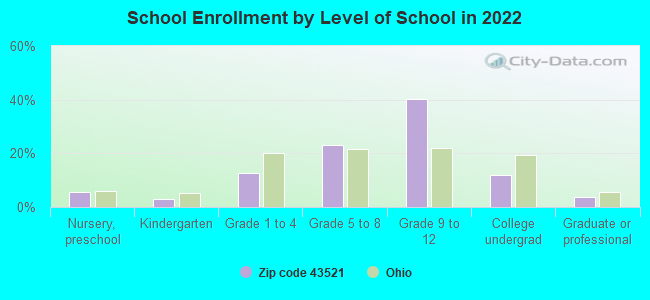
Private vs. public school enrollment:
Students in private schools in grades 1 to 8 (elementary and middle school): 24
Here:
11.8%
Ohio:
16.0%
Students in private schools in grades 9 to 12 (high school): 5
Here:
2.2%
Ohio:
13.1%
Students in private undergraduate colleges: 3
Here:
5.4%
Ohio:
22.3%
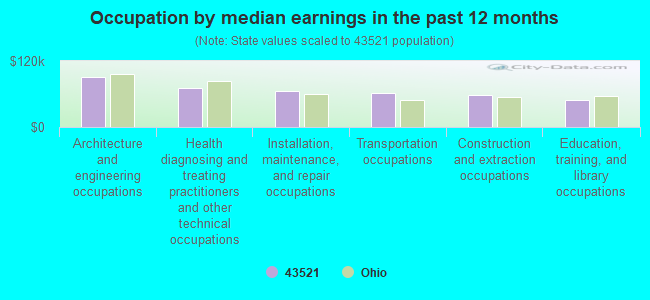
Occupation by median earnings in the past 12 months ($)
90,149Architecture and engineering occupations
71,695Health diagnosing and treating practitioners and other technical occupations
65,919Installation, maintenance, and repair occupations
61,457Transportation occupations
58,701Construction and extraction occupations
49,663Education, training, and library occupations
Top industries in this zip code by the number of employees in 2005:
Health Care and Social Assistance: Offices of Physicians (except Mental Health Specialists) (10-19 employees: 1 establishment, 1-4 employees: 1 establishment)
Accommodation and Food Services: Limited-Service Restaurants (10-19: 1, 1-4: 1)
Other Services (except Public Administration): Labor Unions and Similar Labor Organizations (10-19: 1)
Construction: Industrial Building Construction (10-19: 1)
Other Services (except Public Administration): Religious Organizations (5-9: 1, 1-4: 3)
Other Services (except Public Administration): General Automotive Repair (5-9: 1, 1-4: 1)
People in group quarters in 2010:
5 people in residential treatment centers for adults
Fatal accident statistics in 2014:
Fatal accident count: 1
Vehicles involved in fatal accidents: 1
Fatal accidents caused by drunken drivers: 0
Fatalities: 1
Persons involved in fatal accidents: 1
Pedestrians involved in fatal accidents: 0
Fatal accident statistics in 2011:
Fatal accident count: 1
Vehicles involved in fatal accidents: 1
Fatal accidents caused by drunken drivers: 1
Fatalities: 1
Persons involved in fatal accidents: 1
Pedestrians involved in fatal accidents: 0
Home Mortgage Disclosure Act Aggregated Statistics For Year 2009 (Based on 4 partial tracts)
A) FHA, FSA/RHS & VA Home Purchase Loans
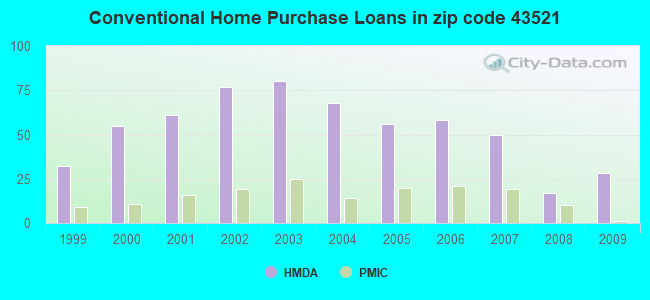
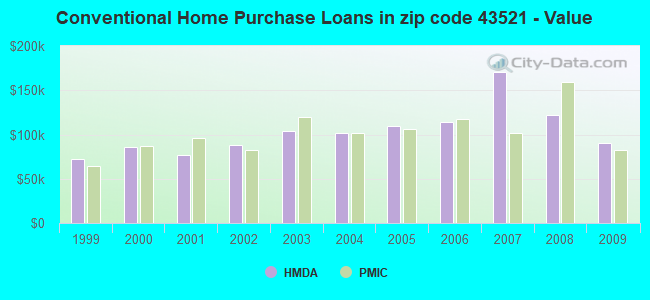
B) Conventional Home Purchase Loans
C) Refinancings
D) Home Improvement Loans
F) Non-occupant Loans on < 5 Family Dwellings (A B C & D)
G) Loans On Manufactured Home Dwelling (A B C & D)
Number
Average Value
Number
Average Value
Number
Average Value
Number
Average Value
Number
Average Value
Number
Average Value
LOANS ORIGINATED
3
$85,237
28
$89,992
206
$119,885
15
$70,629
8
$124,978
5
$60,188
APPLICATIONS APPROVED, NOT ACCEPTED
1
$89,640
4
$47,558
17
$120,556
1
$11,500
0
$0
2
$85,135
APPLICATIONS DENIED
2
$123,365
13
$94,102
54
$114,386
3
$22,153
0
$0
4
$68,948
APPLICATIONS WITHDRAWN
1
$99,600
3
$89,373
31
$115,497
1
$71,010
1
$55,100
1
$93,620
FILES CLOSED FOR INCOMPLETENESS
0
$0
0
$0
0
$0
0
$0
0
$0
0
$0
Aggregated Statistics For Year 2008 (Based on 4 partial tracts)
A) FHA, FSA/RHS & VA Home Purchase Loans
B) Conventional Home Purchase Loans
C) Refinancings
D) Home Improvement Loans
F) Non-occupant Loans on < 5 Family Dwellings (A B C & D)
G) Loans On Manufactured Home Dwelling (A B C & D)
Number
Average Value
Number
Average Value
Number
Average Value
Number
Average Value
Number
Average Value
Number
Average Value
LOANS ORIGINATED
4
$113,355
17
$122,388
85
$119,687
8
$21,279
4
$70,298
2
$99,050
APPLICATIONS APPROVED, NOT ACCEPTED
1
$79,680
2
$136,995
12
$109,129
4
$13,660
0
$0
1
$109,560
APPLICATIONS DENIED
0
$0
4
$54,612
59
$94,683
9
$15,650
2
$47,100
1
$65,610
APPLICATIONS WITHDRAWN
1
$83,880
4
$102,852
21
$105,422
0
$0
1
$85,660
1
$120,860
FILES CLOSED FOR INCOMPLETENESS
0
$0
0
$0
3
$59,760
0
$0
0
$0
0
$0
Aggregated Statistics For Year 2007 (Based on 4 partial tracts)
A) FHA, FSA/RHS & VA Home Purchase Loans
B) Conventional Home Purchase Loans
C) Refinancings
D) Home Improvement Loans
E) Loans on Dwellings For 5+ Families
F) Non-occupant Loans on < 5 Family Dwellings (A B C & D)
G) Loans On Manufactured Home Dwelling (A B C & D)
Number
Average Value
Number
Average Value
Number
Average Value
Number
Average Value
Number
Average Value
Number
Average Value
Number
Average Value
LOANS ORIGINATED
4
$114,045
50
$170,880
80
$88,629
13
$24,899
0
$0
7
$444,433
5
$90,898
APPLICATIONS APPROVED, NOT ACCEPTED
0
$0
8
$131,691
14
$94,046
6
$19,422
1
$184,260
1
$57,770
1
$60,590
APPLICATIONS DENIED
0
$0
8
$83,454
91
$110,209
18
$28,613
0
$0
4
$79,180
3
$68,150
APPLICATIONS WITHDRAWN
2
$96,115
11
$90,003
32
$124,072
6
$58,970
0
$0
2
$23,405
2
$91,625
FILES CLOSED FOR INCOMPLETENESS
0
$0
2
$91,520
12
$141,134
0
$0
0
$0
0
$0
0
$0
Aggregated Statistics For Year 2006 (Based on 4 partial tracts)
A) FHA, FSA/RHS & VA Home Purchase Loans
B) Conventional Home Purchase Loans
C) Refinancings
D) Home Improvement Loans
F) Non-occupant Loans on < 5 Family Dwellings (A B C & D)
G) Loans On Manufactured Home Dwelling (A B C & D)
Number
Average Value
Number
Average Value
Number
Average Value
Number
Average Value
Number
Average Value
Number
Average Value
LOANS ORIGINATED
3
$86,083
58
$114,626
133
$83,771
15
$29,663
12
$74,902
6
$53,807
APPLICATIONS APPROVED, NOT ACCEPTED
0
$0
8
$84,558
21
$76,569
1
$59,410
0
$0
1
$78,350
APPLICATIONS DENIED
0
$0
28
$76,616
78
$93,121
26
$28,604
1
$34,170
10
$40,885
APPLICATIONS WITHDRAWN
0
$0
14
$82,011
45
$100,985
3
$82,023
2
$49,765
0
$0
FILES CLOSED FOR INCOMPLETENESS
0
$0
2
$57,915
12
$117,113
0
$0
1
$28,880
0
$0
Aggregated Statistics For Year 2005 (Based on 4 partial tracts)
A) FHA, FSA/RHS & VA Home Purchase Loans
B) Conventional Home Purchase Loans
C) Refinancings
D) Home Improvement Loans
F) Non-occupant Loans on < 5 Family Dwellings (A B C & D)
G) Loans On Manufactured Home Dwelling (A B C & D)
Number
Average Value
Number
Average Value
Number
Average Value
Number
Average Value
Number
Average Value
Number
Average Value
LOANS ORIGINATED
2
$78,685
56
$109,716
133
$87,459
16
$31,452
12
$95,984
6
$33,998
APPLICATIONS APPROVED, NOT ACCEPTED
1
$132,470
14
$82,231
31
$110,934
3
$35,593
1
$55,720
4
$69,992
APPLICATIONS DENIED
2
$113,045
25
$67,530
123
$92,205
24
$30,386
5
$51,118
14
$56,866
APPLICATIONS WITHDRAWN
1
$106,570
12
$78,472
50
$110,364
3
$148,307
2
$38,690
4
$64,045
FILES CLOSED FOR INCOMPLETENESS
0
$0
2
$56,385
8
$127,749
0
$0
0
$0
0
$0
Aggregated Statistics For Year 2004 (Based on 4 partial tracts)
A) FHA, FSA/RHS & VA Home Purchase Loans
B) Conventional Home Purchase Loans
C) Refinancings
D) Home Improvement Loans
F) Non-occupant Loans on < 5 Family Dwellings (A B C & D)
G) Loans On Manufactured Home Dwelling (A B C & D)
Number
Average Value
Number
Average Value
Number
Average Value
Number
Average Value
Number
Average Value
Number
Average Value
LOANS ORIGINATED
4
$108,942
68
$101,686
141
$94,721
16
$26,919
12
$132,743
12
$73,444
APPLICATIONS APPROVED, NOT ACCEPTED
0
$0
6
$99,903
21
$78,230
1
$24,900
0
$0
2
$37,390
APPLICATIONS DENIED
2
$85,695
14
$75,049
88
$92,788
13
$25,620
2
$44,055
11
$60,153
APPLICATIONS WITHDRAWN
0
$0
9
$75,107
49
$91,975
2
$127,345
1
$11,950
2
$77,340
FILES CLOSED FOR INCOMPLETENESS
1
$171,360
3
$93,957
7
$115,783
1
$42,700
0
$0
0
$0
Aggregated Statistics For Year 2003 (Based on 4 partial tracts)
A) FHA, FSA/RHS & VA Home Purchase Loans
B) Conventional Home Purchase Loans
C) Refinancings
D) Home Improvement Loans
F) Non-occupant Loans on < 5 Family Dwellings (A B C & D)
Number
Average Value
Number
Average Value
Number
Average Value
Number
Average Value
Number
Average Value
LOANS ORIGINATED
1
$102,410
80
$103,428
383
$94,446
16
$34,578
11
$62,038
APPLICATIONS APPROVED, NOT ACCEPTED
0
$0
14
$63,152
32
$97,998
4
$12,352
0
$0
APPLICATIONS DENIED
1
$78,680
26
$65,572
94
$95,735
9
$15,363
1
$71,500
APPLICATIONS WITHDRAWN
0
$0
6
$105,617
49
$97,626
0
$0
1
$103,140
FILES CLOSED FOR INCOMPLETENESS
0
$0
2
$117,195
6
$83,922
1
$15,940
0
$0
Aggregated Statistics For Year 2002 (Based on 4 partial tracts)
A) FHA, FSA/RHS & VA Home Purchase Loans
B) Conventional Home Purchase Loans
C) Refinancings
D) Home Improvement Loans
F) Non-occupant Loans on < 5 Family Dwellings (A B C & D)
Number
Average Value
Number
Average Value
Number
Average Value
Number
Average Value
Number
Average Value
LOANS ORIGINATED
6
$85,440
77
$88,656
315
$90,752
27
$29,833
15
$57,725
APPLICATIONS APPROVED, NOT ACCEPTED
0
$0
8
$59,602
17
$89,148
4
$53,560
1
$87,650
APPLICATIONS DENIED
1
$238,420
25
$62,617
63
$81,160
7
$13,829
0
$0
APPLICATIONS WITHDRAWN
1
$133,600
7
$78,650
44
$82,026
3
$8,520
0
$0
FILES CLOSED FOR INCOMPLETENESS
0
$0
2
$14,940
10
$99,313
0
$0
1
$9,960
Aggregated Statistics For Year 2001 (Based on 4 partial tracts)
A) FHA, FSA/RHS & VA Home Purchase Loans
B) Conventional Home Purchase Loans
C) Refinancings
D) Home Improvement Loans
F) Non-occupant Loans on < 5 Family Dwellings (A B C & D)
Number
Average Value
Number
Average Value
Number
Average Value
Number
Average Value
Number
Average Value
LOANS ORIGINATED
4
$79,668
61
$77,318
404
$84,284
19
$28,029
14
$73,683
APPLICATIONS APPROVED, NOT ACCEPTED
1
$61,750
11
$66,227
20
$81,964
2
$24,250
0
$0
APPLICATIONS DENIED
3
$83,000
33
$59,556
84
$80,513
17
$9,521
4
$64,532
APPLICATIONS WITHDRAWN
1
$72,710
3
$95,083
38
$77,044
4
$10,210
1
$80,460
FILES CLOSED FOR INCOMPLETENESS
0
$0
1
$40,840
8
$66,902
1
$35,860
1
$19,920
Aggregated Statistics For Year 2000 (Based on 4 partial tracts)
A) FHA, FSA/RHS & VA Home Purchase Loans
B) Conventional Home Purchase Loans
C) Refinancings
D) Home Improvement Loans
F) Non-occupant Loans on < 5 Family Dwellings (A B C & D)
Number
Average Value
Number
Average Value
Number
Average Value
Number
Average Value
Number
Average Value
LOANS ORIGINATED
8
$76,288
55
$85,371
99
$76,170
21
$30,698
6
$86,177
APPLICATIONS APPROVED, NOT ACCEPTED
0
$0
13
$73,135
15
$65,275
6
$15,573
1
$99,600
APPLICATIONS DENIED
2
$66,775
36
$54,472
48
$64,699
16
$15,738
0
$0
APPLICATIONS WITHDRAWN
0
$0
8
$71,335
24
$63,406
1
$56,270
0
$0
FILES CLOSED FOR INCOMPLETENESS
0
$0
1
$93,620
4
$69,940
0
$0
0
$0
Aggregated Statistics For Year 1999 (Based on 2 partial tracts)
A) FHA, FSA/RHS & VA Home Purchase Loans
B) Conventional Home Purchase Loans
C) Refinancings
D) Home Improvement Loans
F) Non-occupant Loans on < 5 Family Dwellings (A B C & D)
Detailed PMIC statistics for the following Tracts:0406.00
, 0408.00
2002 - 2018 National Fire Incident Reporting System (NFIRS) incidents
Based on the data from the years 2002 - 2018 the average number of fire incidents per year is 20. The highest number of reported fires - 41 took place in 2012, and the least - 9 in 2013. The data has a growing trend.
When looking into fire subcategories, the most reports belonged to: Structure Fires (44.9%), and Outside Fires (42.0%).
Fire incident types reported to NFIRS in Zip Code 43521


+$2,241
-$3,706
(% of AGI for various income ranges: 2.5% for AGIs $10k-25k, -1.2% for AGIs $25k-50k, 2.4% for AGIs $50k-75k, -0.1% for AGIs $75k-100k) Nearest zip codes: 49256, 43502, 43553, 49288, 43567, 43570.


 Based on the data from the years 2002 - 2018 the average number of fire incidents per year is 20. The highest number of reported fires - 41 took place in 2012, and the least - 9 in 2013. The data has a growing trend.
 When looking into fire subcategories, the most reports belonged to: Structure Fires (44.9%), and Outside Fires (42.0%).