Estimated zip code population in 2022: 3,446 Zip code population in 2010: 4,015 Zip code population in 2000: 4,033
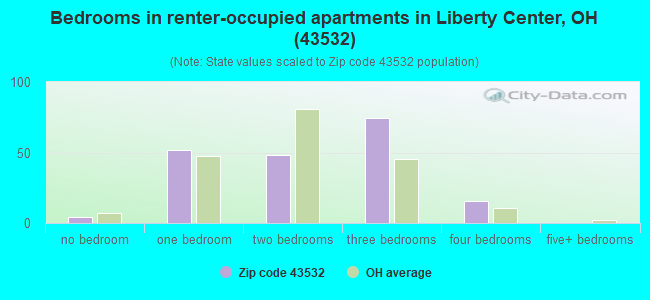
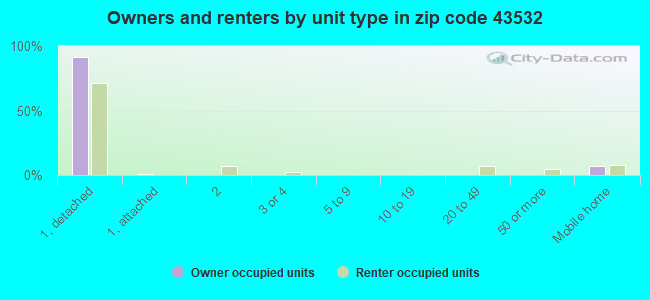
Houses and condos: 1,440 Renter-occupied apartments: 194
% of renters here:
14%
State:
33%
March 2022 cost of living index in zip code 43532: 83.3 (low, U.S. average is 100)
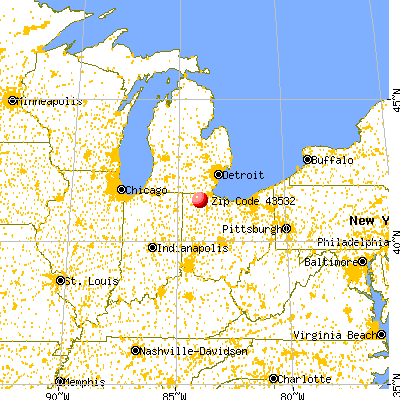
Land area: 46.7 sq. mi. Water area: 0.9 sq. mi.
Population density: 74 people per square mile
(very low).
OSM Map
General Map
Google Map
MSN Map
OSM Map
General Map
Google Map
MSN Map
OSM Map
General Map
Google Map
MSN Map
OSM Map
General Map
Google Map
MSN Map
Please wait while loading the map...
Real estate property taxes paid for housing units in 2022:
This zip code:
0.9% ($1,954)
Ohio:
1.3% ($2,639)
Median real estate property taxes paid for housing units with mortgages in 2022: $2,034 (0.8%) Median real estate property taxes paid for housing units with no mortgage in 2022: $1,665 (1.1%)
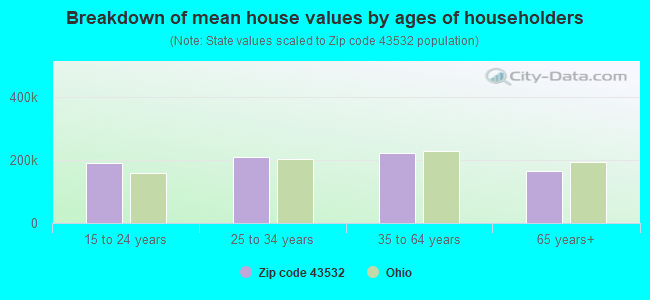
Estimated median house/condo value in 2022: $208,554
43532:
$208,554
Ohio:
$204,100
According to our research of Ohio and other state lists, there were 7 registered sex offenders living in 43532 zip code as of May 28, 2024. The ratio of all residents to sex offenders in zip code 43532 is 605 to 1. The ratio of registered sex offenders to all residents in this zip code is near the state average.
Median resident age:
This zip code:
42.7 years
Ohio median age:
39.9 years
Average household size:
This zip code:
2.5 people
Ohio:
2.4 people
Averages for the 2020 tax year for zip code 43532, filed in 2021:
Average Adjusted Gross Income (AGI) in 2020: $59,553 (Individual Income Tax Returns)
Here:
$59,553
State:
$67,288
Salary/wage: $50,650 (reported on 82.9% of returns)
Here:
$50,650
State:
$55,628
(% of AGI for various income ranges: 1187.9% for AGIs below $25k, 3347.2% for AGIs $25k-50k, 6153.5% for AGIs $50k-75k, 8792.2% for AGIs $75k-100k, 13989.5% for AGIs $100k-200k)
Taxable interest for individuals: $692 (reported on 26.9% of returns)
This zip code:
$692
Ohio:
$1,518
(% of AGI for various income ranges: 11.1% for AGIs below $25k, 20.2% for AGIs $25k-50k, 17.8% for AGIs $50k-75k, 36.7% for AGIs $75k-100k, 53.7% for AGIs $100k-200k)
Ordinary dividends: $2,306 (reported on 16.6% of returns)
Here:
$2,306
State:
$7,167
(% of AGI for various income ranges: 20.3% for AGIs below $25k, 40.2% for AGIs $25k-50k, 23.5% for AGIs $50k-75k, 23.9% for AGIs $75k-100k, 205.8% for AGIs $100k-200k)
Net capital gain/loss in AGI: +$6,958 (reported on 16.1% of returns)
Here:
+$6,958
State:
+$18,919
(% of AGI for various income ranges: 24.5% for AGIs below $25k, 40.9% for AGIs $25k-50k, 72.2% for AGIs $50k-75k, 55.0% for AGIs $75k-100k, 854.2% for AGIs $100k-200k)
Profit/loss from business: +$6,046 (reported on 13.5% of returns)
Here:
+$6,046
State:
+$13,744
(% of AGI for various income ranges: 63.4% for AGIs below $25k, 80.7% for AGIs $25k-50k, 113.5% for AGIs $50k-75k, 107.2% for AGIs $75k-100k, 278.9% for AGIs $100k-200k)
Taxable individual retirement arrangement distribution: $12,195 (reported on 10.9% of returns)
43532:
$12,195
Ohio:
$18,876
(% of AGI for various income ranges: 97.1% for AGIs below $25k, 146.0% for AGIs $25k-50k, 152.6% for AGIs $50k-75k, 301.7% for AGIs $75k-100k, 352.6% for AGIs $100k-200k)
Total itemized deductions: $27,633 (reported on 3.1% of returns)
Here:
$27,633
State:
$33,869
(% of AGI for various income ranges: 222.6% for AGIs $25k-50k, 368.9% for AGIs $100k-200k)
Charity contributions: $9,800 (reported on 2.1% of returns)
Here:
$9,800
State:
$14,577
(% of AGI for various income ranges: 217.8% for AGIs $75k-100k)
Taxes paid: $6,100 (reported on 3.1% of returns)
43532:
$6,100
State:
$7,681
(% of AGI for various income ranges: 38.4% for AGIs $25k-50k, 105.8% for AGIs $100k-200k)
Earned income credit: $2,196 (reported on 11.9% of returns)
Here:
$2,196
State:
$2,304
(% of AGI for various income ranges: 73.4% for AGIs below $25k, 52.6% for AGIs $25k-50k)
Percentage of individuals using paid preparers for their 2020 taxes: 95.3%
Here:
95%
State:
94%
(% for various income ranges: 92.6% for AGIs below $25k, 96.3% for AGIs $25k-50k, 96.8% for AGIs $50k-75k, 95.8% for AGIs $75k-100k, 96.3% for AGIs $100k-200k, 100.0% for AGIs over 200k)
Averages for the 2012 tax year for zip code 43532, filed in 2013:
Average Adjusted Gross Income (AGI) in 2012: $50,361 (Individual Income Tax Returns)
Here:
$50,361
State:
$54,926
Salary/wage: $41,168 (reported on 85.4% of returns)
Here:
$41,168
State:
$45,869
(% of AGI for various income ranges: 69.4% for AGIs below $25k, 74.3% for AGIs $25k-50k, 77.3% for AGIs $50k-75k, 80.8% for AGIs $75k-100k, 55.8% for AGIs $100k-200k)
Taxable interest for individuals: $714 (reported on 34.1% of returns)
This zip code:
$714
Ohio:
$1,297
(% of AGI for various income ranges: 0.7% for AGIs below $25k, 0.9% for AGIs $25k-50k, 0.5% for AGIs $50k-75k, 0.3% for AGIs $75k-100k, 0.3% for AGIs $100k-200k)
Ordinary dividends: $1,358 (reported on 17.8% of returns)
Here:
$1,358
State:
$5,821
(% of AGI for various income ranges: 1.8% for AGIs below $25k, 0.5% for AGIs $25k-50k, 0.2% for AGIs $50k-75k, 0.6% for AGIs $75k-100k, 0.2% for AGIs $100k-200k)
Net capital gain/loss in AGI: +$3,457 (reported on 12.4% of returns)
Here:
+$3,457
State:
+$11,232
(% of AGI for various income ranges: 0.2% for AGIs below $25k, 0.1% for AGIs $25k-50k, 0.1% for AGIs $50k-75k, 0.3% for AGIs $75k-100k, 2.3% for AGIs $100k-200k)
Profit/loss from business: +$5,912 (reported on 13.5% of returns)
Here:
+$5,912
State:
+$12,773
(% of AGI for various income ranges: 4.5% for AGIs below $25k, 1.6% for AGIs $25k-50k, 2.7% for AGIs $50k-75k, 1.2% for AGIs $75k-100k, 0.3% for AGIs $100k-200k)
Taxable individual retirement arrangement distribution: $10,610 (reported on 11.4% of returns)
43532:
$10,610
Ohio:
$14,511
(% of AGI for various income ranges: 2.8% for AGIs below $25k, 2.9% for AGIs $25k-50k, 2.4% for AGIs $50k-75k, 2.4% for AGIs $75k-100k, 2.0% for AGIs $100k-200k)
Total itemized deductions: $18,193 (21% of AGI, reported on 30.3% of returns)
Here:
$18,193
State:
$21,278
Here:
20.8% of AGI
State:
18.8% of AGI
(% of AGI for various income ranges: 8.6% for AGIs below $25k, 8.7% for AGIs $25k-50k, 10.3% for AGIs $50k-75k, 12.5% for AGIs $75k-100k, 12.3% for AGIs $100k-200k)
Charity contributions: $3,212 (reported on 22.2% of returns)
Here:
$3,212
State:
$3,943
(% of AGI for various income ranges: 0.7% for AGIs below $25k, 0.9% for AGIs $25k-50k, 1.1% for AGIs $50k-75k, 2.0% for AGIs $75k-100k, 1.7% for AGIs $100k-200k)
Taxes paid: $6,884 (reported on 30.3% of returns)
43532:
$6,884
State:
$9,568
(% of AGI for various income ranges: 1.3% for AGIs below $25k, 2.3% for AGIs $25k-50k, 3.8% for AGIs $50k-75k, 4.9% for AGIs $75k-100k, 5.8% for AGIs $100k-200k)
Earned income credit: $2,070 (reported on 14.6% of returns)
Here:
$2,070
State:
$2,285
(% of AGI for various income ranges: 4.6% for AGIs below $25k, 1.0% for AGIs $25k-50k)
Percentage of individuals using paid preparers for their 2012 taxes: 56.8%
Here:
57%
State:
51%
(% for various income ranges: 50.7% for AGIs below $25k, 57.4% for AGIs $25k-50k, 61.3% for AGIs $50k-75k, 59.1% for AGIs $75k-100k, 66.7% for AGIs $100k-200k)
Averages for the 2004 tax year for zip code 43532, filed in 2005:
Average Adjusted Gross Income (AGI) in 2004: $38,574 (Individual Income Tax Returns)
Here:
$38,574
State:
$44,480
Salary/wage: $36,584 (reported on 87.0% of returns)
Here:
$36,584
State:
$39,198
(% of AGI for various income ranges: 122.2% for AGIs below $10k, 74.2% for AGIs $10k-25k, 82.7% for AGIs $25k-50k, 84.7% for AGIs $50k-75k, 88.4% for AGIs $75k-100k, 68.7% for AGIs over 100k)
Taxable interest for individuals: $740 (reported on 44.9% of returns)
This zip code:
$740
Ohio:
$1,532
(% of AGI for various income ranges: 5.9% for AGIs below $10k, 2.1% for AGIs $10k-25k, 0.9% for AGIs $25k-50k, 0.5% for AGIs $50k-75k, 0.4% for AGIs $75k-100k, 0.7% for AGIs over 100k)
Taxable dividends: $848 (reported on 19.6% of returns)
Here:
$848
State:
$3,496
(% of AGI for various income ranges: 2.0% for AGIs below $10k, 0.4% for AGIs $10k-25k, 0.4% for AGIs $25k-50k, 0.2% for AGIs $50k-75k, 0.5% for AGIs $75k-100k, 0.6% for AGIs over 100k)
Net capital gain/loss: +$1,348 (reported on 12.0% of returns)
Here:
+$1,348
State:
+$8,582
(% of AGI for various income ranges: -2.6% for AGIs below $10k, 0.9% for AGIs $10k-25k, 0.0% for AGIs $25k-50k, 0.9% for AGIs $50k-75k, 0.5% for AGIs $75k-100k, 0.2% for AGIs over 100k)
Profit/loss from business: +$5,522 (reported on 13.2% of returns)
Here:
+$5,522
State:
+$10,813
(% of AGI for various income ranges: 2.3% for AGIs below $10k, 3.0% for AGIs $10k-25k, 2.7% for AGIs $25k-50k, 1.4% for AGIs $50k-75k, 2.0% for AGIs $75k-100k)
IRA payment deduction: $2,064 (reported on 2.5% of returns)
43532:
$2,064
Ohio:
$2,794
Total itemized deductions: $13,936 (22% of AGI, reported on 33.3% of returns)
Here:
$13,936
State:
$17,503
Here:
21.9% of AGI
State:
20.8% of AGI
(% of AGI for various income ranges: 5.9% for AGIs $10k-25k, 9.7% for AGIs $25k-50k, 12.5% for AGIs $50k-75k, 16.8% for AGIs $75k-100k, 15.6% for AGIs over 100k)
Charity contributions deductions: $2,356 (3% of AGI, reported on 26.8% of returns)
Here:
$2,356
State:
$3,087
Here:
3.5% of AGI
State:
3.4% of AGI
(% of AGI for various income ranges: 0.7% for AGIs $10k-25k, 1.0% for AGIs $25k-50k, 1.5% for AGIs $50k-75k, 2.4% for AGIs $75k-100k, 3.4% for AGIs over 100k)
Total tax: $4,204 (reported on 79.6% of returns)
43532:
$4,204
State:
$6,781
(% of AGI for various income ranges: 4.4% for AGIs below $10k, 4.1% for AGIs $10k-25k, 7.0% for AGIs $25k-50k, 8.6% for AGIs $50k-75k, 9.4% for AGIs $75k-100k, 16.2% for AGIs over 100k)
Earned income credit: $1,762 (reported on 9.5% of returns)
Here:
$1,762
State:
$1,696
Percentage of individuals using paid preparers for their 2004 taxes: 56.5%
Here:
56%
State:
55%
(% for various income ranges: 50.1% for AGIs below $10k, 55.2% for AGIs $10k-25k, 61.7% for AGIs $25k-50k, 50.9% for AGIs $50k-75k, 60.6% for AGIs $75k-100k, 66.1% for AGIs over 100k)
Household received Food Stamps/SNAP in the past 12 months: 85 Household did not receive Food Stamps/SNAP in the past 12 months: 1,295
Women who had a birth in the past 12 months: 1 (2 now married, 0 unmarried) Women who did not have a birth in the past 12 months: 884 (340 now married, 543 unmarried)
Housing units in zip code 43532 with a mortgage: 812 (107 second mortgage, 96 both second mortgage and home equity loan) Houses without a mortgage: 38
Median monthly owner costs for units with a mortgage: $1,419 Median monthly owner costs for units without a mortgage: $494
Residents with income below the poverty level in 2022:
This zip code:
10.7%
Whole state:
13.4%
Residents with income below 50% of the poverty level in 2022:
This zip code:
8.1%
Whole state:
7.0%
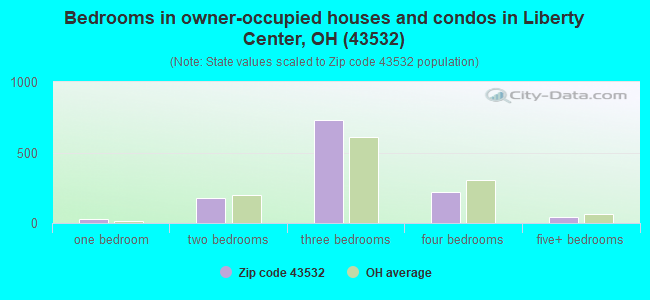
Median number of rooms in houses and condos:
Here:
6.8
State:
6.7
Median number of rooms in apartments:
Here:
5.1
State:
4.4
Notable locations in this zip code not listed on our city pages
Notable locations in zip code 43532: Liberty - Washington Township Fire and Rescue Department (A), Maumee Youth Center (B). Display/hide their locations on the map
Churches in zip code 43532 include: Colton Methodist Church (A), Mount Pleasant Church (B), Saint Pauls Lutheran Church (C), Liberty Chapel United Methodist Church (D), Liberty Center-Colton United Methodist Church (E), Victory Chapel (F). Display/hide their locations on the map
Cemeteries: Texas Cemetery (1), Liberty Chapel Cemetery (2), Heath-Colton Cemetery (3), Young Cemetery (4), Mohler-Union Cemetery (5), Mount Pleasant Cemetery (6), Oak Hill Cemetery (7). Display/hide their locations on the map
382 married couples with children.
187 single-parent households (79 men, 108 women).
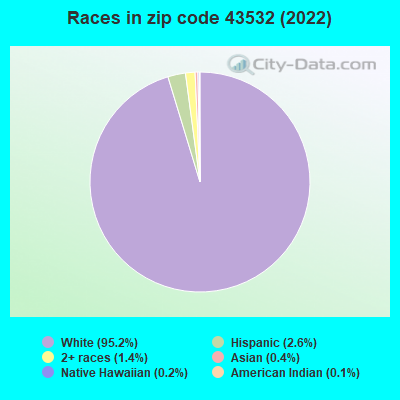
97.3% of residents of 43532 zip code speak English at home.
2.1% of residents speak other Indo-European language at home (100% very well).
0.2% of residents speak Asian or Pacific Island language at home (100% well).
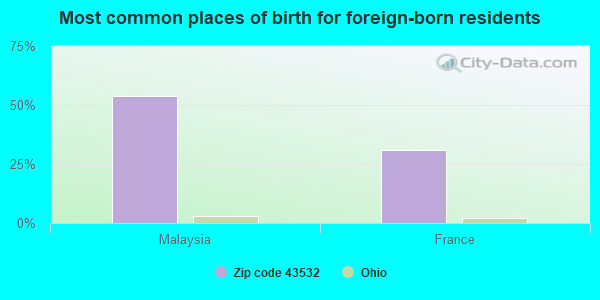
Foreign born population: 13 (0.4%) (46.6% of them are naturalized citizens)
This zip code:
0.4%
Whole state:
5.0%
54%Malaysia
31%France
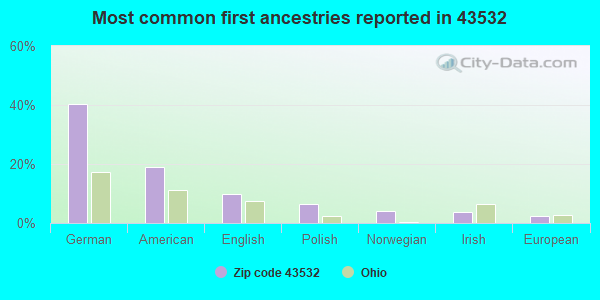
40%German
19%American
10%English
7%Polish
4%Norwegian
4%Irish
2%European
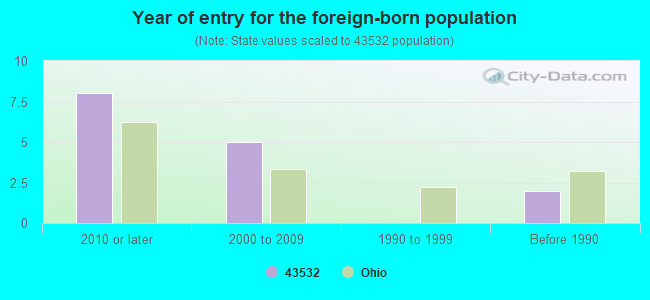
Year of entry for the foreign-born population
82010 or later
52000 to 2009
01990 to 1999
2Before 1990
Housing units lacking complete plumbing facilities: 1.4% Housing units lacking complete kitchen facilities: 1.4%
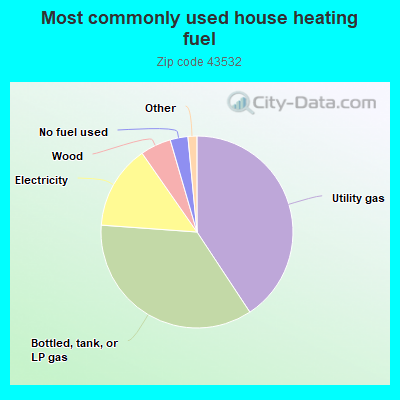
40.8%Utility gas
35.5%Bottled, tank, or LP gas
14.2%Electricity
5.2%Wood
3.0%No fuel used
0.9%Other fuel
0.5%Fuel oil, kerosene, etc.
Population in 1990: 3,933. Population change in the 1990s: +100 (+2.5%).
Place of birth for U.S.-born residents:
This state: 2,964
Northeast: 113
Midwest: 110
South: 110
West: 131
64% of the 43532 zip code residents lived in the same house 5 years ago. Out of people who lived in different houses, 36% lived in this county. Out of people who lived in different counties, 50% lived in Ohio.
90% of the 43532 zip code residents lived in the same house 1 year ago. Out of people who lived in different houses, 35% moved from this county. Out of people who lived in different houses, 43% moved from different county within same state. Out of people who lived in different houses, 24% moved from different state.
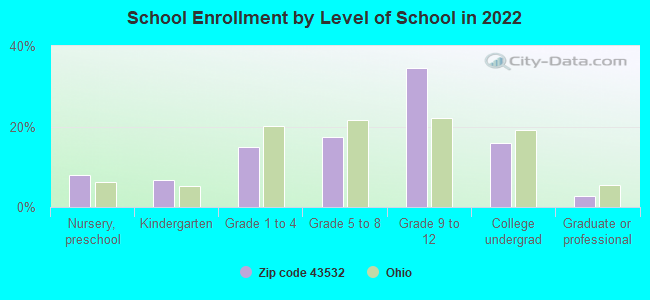
Private vs. public school enrollment:
Students in private schools in grades 1 to 8 (elementary and middle school): 20
Here:
8.8%
Ohio:
16.0%
Students in private schools in grades 9 to 12 (high school): 40
Here:
16.1%
Ohio:
13.1%
Students in private undergraduate colleges:
Here:
0.0%
Ohio:
22.3%
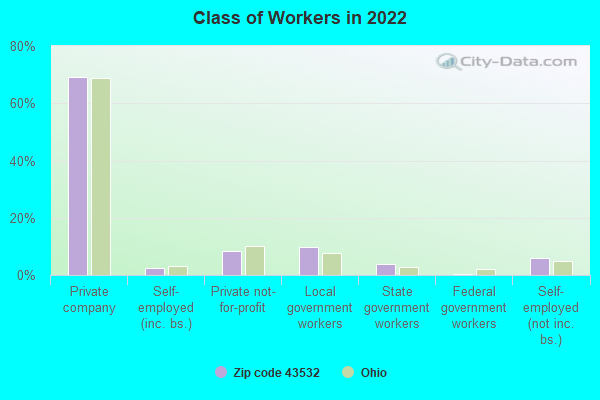
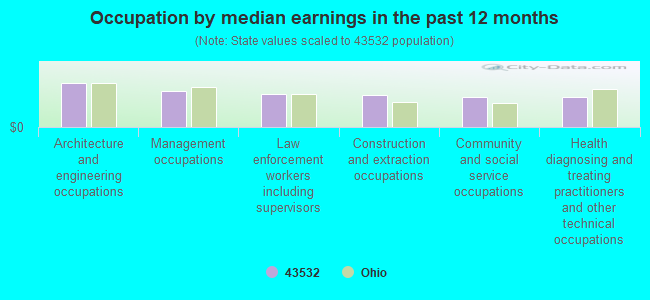
Occupation by median earnings in the past 12 months ($)
104,436Architecture and engineering occupations
85,723Management occupations
79,433Law enforcement workers including supervisors
77,589Construction and extraction occupations
72,110Community and social service occupations
71,014Health diagnosing and treating practitioners and other technical occupations
Companies with federal contracts located in this zip code:
LONGS CATERING (V526 CNTY RD 6 in LIBERTY CENTER, OH; small business) : $14,197 in 2 contractsin 2006
$7,710 with Army for Food Services. Signed on 2006-06-22. Completion date: 2006-06-20.
$6,487, same as above.Signed on 2006-04-20. Completion date: 2006-04-09.
Top industries in this zip code by the number of employees in 2005:
Administrative and Support and Waste Management and Remediation Services: All Other Support Services (20-49 employees: 1 establishment)
Construction: Commercial and Institutional Building Construction (20-49: 1)
Health Care and Social Assistance: Other Residential Care Facilities (20-49: 1)
Other Services (except Public Administration): General Automotive Repair (10-19: 1, 5-9: 1)
Other Services (except Public Administration): Religious Organizations (5-9: 2, 1-4: 4)
Accommodation and Food Services: Limited-Service Restaurants (10-19: 1, 1-4: 1)
Wholesale Trade: Farm and Garden Machinery and Equipment Merchant Wholesalers (10-19: 1)
People in group quarters in 2010:
27 people in residential schools for people with disabilities
People in group quarters in 2000:
121 people in training schools for juvenile delinquents
74 people in other nonhousehold living situations
Fatal accident statistics in 2012:
Fatal accident count: 1
Vehicles involved in fatal accidents: 3
Fatal accidents caused by drunken drivers: 1
Fatalities: 1
Persons involved in fatal accidents: 3
Pedestrians involved in fatal accidents: 0
Fatal accident statistics in 2011:
Fatal accident count: 2
Vehicles involved in fatal accidents: 5
Fatal accidents caused by drunken drivers: 0
Fatalities: 2
Persons involved in fatal accidents: 7
Pedestrians involved in fatal accidents: 0
2003 - 2018 National Fire Incident Reporting System (NFIRS) incidents
Based on the data from the years 2003 - 2018 the average number of fire incidents per year is 26. The highest number of reported fires - 42 took place in 2017, and the least - 5 in 2004. The data has a growing trend.
When looking into fire subcategories, the most reports belonged to: Structure Fires (46.2%), and Outside Fires (38.4%).
Fire incident types reported to NFIRS in Zip Code 43532


 Nearest zip codes: 43547, 43534, 43523, 43515, 43522, 43535.


 : $14,197 in 2 contracts in 2006


 Based on the data from the years 2003 - 2018 the average number of fire incidents per year is 26. The highest number of reported fires - 42 took place in 2017, and the least - 5 in 2004. The data has a growing trend.
 When looking into fire subcategories, the most reports belonged to: Structure Fires (46.2%), and Outside Fires (38.4%).