Estimated zip code population in 2022: 1,476 Zip code population in 2010: 1,501 Zip code population in 2000: 1,255
Houses and condos: 590 Renter-occupied apartments: 84
% of renters here:
14%
State:
33%
March 2022 cost of living index in zip code 43540: 83.2 (low, U.S. average is 100)
Land area: 18.9 sq. mi. Water area: 0.1 sq. mi.
Population density: 78 people per square mile
(very low).
OSM Map
General Map
Google Map
MSN Map
OSM Map
General Map
Google Map
MSN Map
OSM Map
General Map
Google Map
MSN Map
OSM Map
General Map
Google Map
MSN Map
Please wait while loading the map...
Real estate property taxes paid for housing units in 2022:
This zip code:
1.1% ($1,894)
Ohio:
1.3% ($2,639)
Median real estate property taxes paid for housing units with mortgages in 2022: $1,821 (1.1%) Median real estate property taxes paid for housing units with no mortgage in 2022: $2,229 (1.0%)
Business Search- 14 Million verified businesses
Males: 704
(47.7%)
Females: 772
(52.3%)
For population 25 years and over in 43540:
High school or higher: 97.4%
Bachelor's degree or higher: 24.2%
Graduate or professional degree: 6.5%
Unemployed: 0.2%
Mean travel time to work (commute): 27.6 minutes
For population 15 years and over in 43540:
Never married: 34.2%
Now married: 51.8%
Separated: 0.2%
Widowed: 4.3%
Divorced: 9.5%
Zip code 43540 compared to state average:
Unemployed percentage significantly below state average.
Black race population percentage significantly below state average.
Hispanic race population percentage above state average.
Median age below state average.
Foreign-born population percentage significantly below state average.
Renting percentage significantly below state average.
Length of stay since moving in significantly above state average.
Estimated median house/condo value in 2022: $177,043
43540:
$177,043
Ohio:
$204,100
According to our research of Ohio and other state lists, there were 2 registered sex offenders living in 43540 zip code as of May 28, 2024. The ratio of all residents to sex offenders in zip code 43540 is 714 to 1. The ratio of registered sex offenders to all residents in this zip code is lower than the state average.
Median resident age:
This zip code:
35.9 years
Ohio median age:
39.9 years
Average household size:
This zip code:
2.5 people
Ohio:
2.4 people
Averages for the 2020 tax year for zip code 43540, filed in 2021:
Average Adjusted Gross Income (AGI) in 2020: $59,379 (Individual Income Tax Returns)
Here:
$59,379
State:
$67,288
Salary/wage: $55,141 (reported on 82.9% of returns)
Here:
$55,141
State:
$55,628
(% of AGI for various income ranges: 1151.4% for AGIs below $25k, 3416.2% for AGIs $25k-50k, 6621.3% for AGIs $50k-75k, 9691.7% for AGIs $75k-100k, 21167.1% for AGIs $100k-200k)
Taxable interest for individuals: $371 (reported on 24.3% of returns)
This zip code:
$371
Ohio:
$1,518
(% of AGI for various income ranges: 7.9% for AGIs below $25k, 8.5% for AGIs $25k-50k, 7.5% for AGIs $50k-75k, 10.0% for AGIs $75k-100k, 41.4% for AGIs $100k-200k)
Ordinary dividends: $1,147 (reported on 21.4% of returns)
Here:
$1,147
State:
$7,167
(% of AGI for various income ranges: 17.9% for AGIs below $25k, 33.8% for AGIs $25k-50k, 20.0% for AGIs $50k-75k, 25.0% for AGIs $75k-100k, 102.9% for AGIs $100k-200k)
Net capital gain/loss in AGI: +$1,682 (reported on 15.7% of returns)
Here:
+$1,682
State:
+$18,919
(% of AGI for various income ranges: 10.8% for AGIs $25k-50k, 71.2% for AGIs $50k-75k, 162.9% for AGIs $100k-200k)
Profit/loss from business: +$6,270 (reported on 14.3% of returns)
Here:
+$6,270
State:
+$13,744
(% of AGI for various income ranges: 210.0% for AGIs below $25k, 83.8% for AGIs $50k-75k, 380.0% for AGIs $100k-200k)
Taxable individual retirement arrangement distribution: $13,300 (reported on 11.4% of returns)
43540:
$13,300
Ohio:
$18,876
(% of AGI for various income ranges: 333.8% for AGIs $25k-50k, 1050.0% for AGIs $75k-100k)
Total itemized deductions: $24,800 (reported on 4.3% of returns)
Here:
$24,800
State:
$33,869
(% of AGI for various income ranges: 1240.0% for AGIs $75k-100k)
Taxes paid: $7,467 (reported on 4.3% of returns)
43540:
$7,467
State:
$7,681
(% of AGI for various income ranges: 320.0% for AGIs $100k-200k)
Earned income credit: $2,367 (reported on 8.6% of returns)
Here:
$2,367
State:
$2,304
(% of AGI for various income ranges: 61.4% for AGIs below $25k, 43.1% for AGIs $25k-50k)
Percentage of individuals using paid preparers for their 2020 taxes: 95.7%
Here:
96%
State:
94%
(% for various income ranges: 95.2% for AGIs below $25k, 100.0% for AGIs $25k-50k, 100.0% for AGIs $50k-75k, 88.9% for AGIs $75k-100k, 92.3% for AGIs $100k-200k)
Averages for the 2012 tax year for zip code 43540, filed in 2013:
Average Adjusted Gross Income (AGI) in 2012: $50,891 (Individual Income Tax Returns)
Here:
$50,891
State:
$54,926
Salary/wage: $40,395 (reported on 85.7% of returns)
Here:
$40,395
State:
$45,869
(% of AGI for various income ranges: 71.4% for AGIs below $25k, 81.3% for AGIs $25k-50k, 74.3% for AGIs $50k-75k, 72.4% for AGIs $75k-100k, 53.9% for AGIs $100k-200k)
Taxable interest for individuals: $650 (reported on 31.4% of returns)
This zip code:
$650
Ohio:
$1,297
(% of AGI for various income ranges: 0.8% for AGIs below $25k, 0.3% for AGIs $25k-50k, 0.8% for AGIs $50k-75k, 0.2% for AGIs $75k-100k, 0.2% for AGIs $100k-200k)
Ordinary dividends: $1,440 (reported on 21.4% of returns)
Here:
$1,440
State:
$5,821
(% of AGI for various income ranges: 0.5% for AGIs below $25k, 0.3% for AGIs $25k-50k, 1.2% for AGIs $50k-75k, 0.9% for AGIs $75k-100k, 0.3% for AGIs $100k-200k)
Net capital gain/loss in AGI: +$7,167 (reported on 12.9% of returns)
Here:
+$7,167
State:
+$11,232
(% of AGI for various income ranges: 0.2% for AGIs below $25k, 1.1% for AGIs $50k-75k, 4.6% for AGIs $100k-200k)
Profit/loss from business: +$9,488 (reported on 11.4% of returns)
Here:
+$9,488
State:
+$12,773
(% of AGI for various income ranges: 10.0% for AGIs below $25k, 0.2% for AGIs $50k-75k, 7.0% for AGIs $75k-100k)
Taxable individual retirement arrangement distribution: $8,114 (reported on 10.0% of returns)
43540:
$8,114
Ohio:
$14,511
(% of AGI for various income ranges: 6.0% for AGIs $25k-50k, 3.0% for AGIs $75k-100k)
Total itemized deductions: $16,600 (20% of AGI, reported on 32.9% of returns)
Here:
$16,600
State:
$21,278
Here:
20.1% of AGI
State:
18.8% of AGI
(% of AGI for various income ranges: 8.7% for AGIs $25k-50k, 12.2% for AGIs $50k-75k, 14.6% for AGIs $75k-100k, 11.2% for AGIs $100k-200k)
Charity contributions: $1,712 (reported on 22.9% of returns)
Here:
$1,712
State:
$3,943
(% of AGI for various income ranges: 0.3% for AGIs $25k-50k, 0.7% for AGIs $50k-75k, 1.1% for AGIs $75k-100k, 1.0% for AGIs $100k-200k)
Taxes paid: $7,232 (reported on 31.4% of returns)
43540:
$7,232
State:
$9,568
(% of AGI for various income ranges: 2.9% for AGIs $25k-50k, 4.2% for AGIs $50k-75k, 6.3% for AGIs $75k-100k, 5.5% for AGIs $100k-200k)
Earned income credit: $1,878 (reported on 12.9% of returns)
Here:
$1,878
State:
$2,285
(% of AGI for various income ranges: 4.3% for AGIs below $25k, 0.7% for AGIs $25k-50k)
Percentage of individuals using paid preparers for their 2012 taxes: 71.4%
Here:
71%
State:
51%
(% for various income ranges: 64.0% for AGIs below $25k, 75.0% for AGIs $25k-50k, 76.9% for AGIs $50k-75k, 75.0% for AGIs $75k-100k, 75.0% for AGIs $100k-200k)
Averages for the 2004 tax year for zip code 43540, filed in 2005:
Average Adjusted Gross Income (AGI) in 2004: $40,248 (Individual Income Tax Returns)
Here:
$40,248
State:
$44,480
Salary/wage: $38,303 (reported on 87.5% of returns)
Here:
$38,303
State:
$39,198
(% of AGI for various income ranges: 76.0% for AGIs below $10k, 71.9% for AGIs $10k-25k, 85.4% for AGIs $25k-50k, 86.5% for AGIs $50k-75k, 89.4% for AGIs $75k-100k, 70.8% for AGIs over 100k)
Taxable interest for individuals: $1,089 (reported on 43.1% of returns)
This zip code:
$1,089
Ohio:
$1,532
(% of AGI for various income ranges: 6.9% for AGIs below $10k, 2.8% for AGIs $10k-25k, 1.5% for AGIs $25k-50k, 0.9% for AGIs $50k-75k, 0.3% for AGIs $75k-100k, 0.4% for AGIs over 100k)
Taxable dividends: $710 (reported on 26.0% of returns)
Here:
$710
State:
$3,496
(% of AGI for various income ranges: 1.2% for AGIs below $10k, 0.5% for AGIs $10k-25k, 0.5% for AGIs $25k-50k, 0.4% for AGIs $50k-75k, 0.5% for AGIs $75k-100k, 0.2% for AGIs over 100k)
Net capital gain/loss: +$1,707 (reported on 15.3% of returns)
Here:
+$1,707
State:
+$8,582
(% of AGI for various income ranges: 0.0% for AGIs $10k-25k, 0.6% for AGIs $25k-50k, 0.6% for AGIs $50k-75k, 1.5% for AGIs $75k-100k)
Profit/loss from business: +$7,153 (reported on 11.1% of returns)
Here:
+$7,153
State:
+$10,813
Total itemized deductions: $14,088 (22% of AGI, reported on 37.0% of returns)
Here:
$14,088
State:
$17,503
Here:
21.9% of AGI
State:
20.8% of AGI
(% of AGI for various income ranges: 8.2% for AGIs $10k-25k, 9.5% for AGIs $25k-50k, 15.5% for AGIs $50k-75k, 16.2% for AGIs $75k-100k, 14.6% for AGIs over 100k)
Charity contributions deductions: $1,551 (2% of AGI, reported on 27.1% of returns)
Here:
$1,551
State:
$3,087
Here:
2.3% of AGI
State:
3.4% of AGI
(% of AGI for various income ranges: 0.6% for AGIs $10k-25k, 0.6% for AGIs $25k-50k, 1.0% for AGIs $50k-75k, 1.5% for AGIs $75k-100k, 1.7% for AGIs over 100k)
Total tax: $4,387 (reported on 79.7% of returns)
43540:
$4,387
State:
$6,781
(% of AGI for various income ranges: 3.8% for AGIs below $10k, 4.9% for AGIs $10k-25k, 7.4% for AGIs $25k-50k, 8.1% for AGIs $50k-75k, 9.0% for AGIs $75k-100k, 15.6% for AGIs over 100k)
Earned income credit: $1,828 (reported on 9.9% of returns)
Here:
$1,828
State:
$1,696
Percentage of individuals using paid preparers for their 2004 taxes: 69.5%
Here:
69%
State:
55%
(% for various income ranges: 62.9% for AGIs below $10k, 71.5% for AGIs $10k-25k, 72.7% for AGIs $25k-50k, 65.8% for AGIs $50k-75k, 76.6% for AGIs $75k-100k, 60.0% for AGIs over 100k)
Household received Food Stamps/SNAP in the past 12 months: 49 Household did not receive Food Stamps/SNAP in the past 12 months: 531
Women who had a birth in the past 12 months: 38 (28 now married, 10 unmarried) Women who did not have a birth in the past 12 months: 356 (136 now married, 219 unmarried)
Housing units in zip code 43540 with a mortgage: 334 (49 second mortgage, 45 both second mortgage and home equity loan) Houses without a mortgage: 36
Median monthly owner costs for units with a mortgage: $1,244 Median monthly owner costs for units without a mortgage: $456
Residents with income below the poverty level in 2022:
This zip code:
9.0%
Whole state:
13.4%
Residents with income below 50% of the poverty level in 2022:
This zip code:
9.0%
Whole state:
7.0%
Median number of rooms in houses and condos:
Here:
6.9
State:
6.7
Median number of rooms in apartments:
Here:
5.1
State:
4.4
Notable locations in this zip code not listed on our city pages
Size of family households: 150 2-persons, 107 3-persons, 69 4-persons, 59 5-persons, 5 6-persons
Size of nonfamily households: 134 1-person, 51 2-persons
179 married couples with children.
88 single-parent households (3 men, 85 women).
95.5% of residents of 43540 zip code speak English at home.
2.0% of residents speak Spanish at home (59% very well, 22% well, 19% not well).
2.3% of residents speak other language at home (100% very well).
Foreign born population: 0 (0.0%)
:
0.0%
Whole state:
5.0%
53%German
11%American
4%English
3%Czech
3%Arab
2%Eastern European
2%Polish
Year of entry for the foreign-born population
62010 or later
02000 to 2009
01990 to 1999
4Before 1990
Facilities with environmental interests located in this zip code:
ANDERSONS THE (3382 ST RT 120 in METAMORA, OH)
STATE MASTER (Ohio general info) - RCRA-OHR000013235, HAZARDOUS WASTE PROGRAM Conditionally Exempt Small Quantity Generators, less than 100 kg/month of hazardous waste (Resource Conservation and Recovery Act (tracking hazardous waste)) - notification Organizations: THE ANDERSONS INC (CONTACT/OWNER)
, THE ANDERSONS (CONTACT/OWNER)
AQUILA FULTON COUNTY POWER LLC (METAMORA ROAD & SYLVANIA-METAM in METAMORA, OH)
AIR MAJOR (AIRS/AFS) Business SIC classification: ELECTRIC SERVICES
Housing units lacking complete kitchen facilities: 0.5%
58.0%Utility gas
30.0%Bottled, tank, or LP gas
8.4%Electricity
3.0%Fuel oil, kerosene, etc.
0.9%Other fuel
Population in 1990: 1,531.
Place of birth for U.S.-born residents:
This state: 1,230
Northeast: 10
Midwest: 109
South: 57
West: 57
75% of the 43540 zip code residents lived in the same house 5 years ago. Out of people who lived in different houses, 38% lived in this county. Out of people who lived in different counties, 50% lived in Ohio.
93% of the 43540 zip code residents lived in the same house 1 year ago. Out of people who lived in different houses, 5% moved from this county. Out of people who lived in different houses, 105% moved from different county within same state.
Private vs. public school enrollment:
Students in private schools in grades 1 to 8 (elementary and middle school): 5
Here:
6.4%
Ohio:
16.0%
Students in private schools in grades 9 to 12 (high school): 3
Here:
5.6%
Ohio:
13.1%
Students in private undergraduate colleges: 18
Here:
20.7%
Ohio:
22.3%
Occupation by median earnings in the past 12 months ($)
94,676Architecture and engineering occupations
89,152Production occupations
76,392Installation, maintenance, and repair occupations
75,132Management occupations
68,179Construction and extraction occupations
56,988Health diagnosing and treating practitioners and other technical occupations
Companies with federal contracts located in this zip code:
PARKER HANNIFIN CORPORATION (16810 FULTON COUNTY RD 2 in METAMORA, OH) : $644,368 in 13 contractsfrom 2000 to 2005
Contracts for Miscellaneous Engine Accessories, Aircraft, Oils and Greases: Cutting, Lubricating, and Hydraulic, Chemical Analysis Instruments, Centrifugals, Separators, and Pressure and Vacuum Filters, and moreby Navy, Defense Logistics Agency Signed by year:2000: $237,595; 2001: $31,368; 2002: $77,850; 2003: $276,184; 2004: $0; 2005: $21,371; 2006: $0.
Biggest contracts:
$78,000 with Navy for Miscellaneous Engine Accessories, Aircraft. Signed on 2003-04-11. Completion date: 2003-07-11.
$77,850 with Navy for Oils and Greases: Cutting, Lubricating, and Hydraulic. Signed on 2002-10-02. Completion date: 2003-01-02.
$68,972 with Navy for Chemical Analysis Instruments. Signed on 2003-09-18. Completion date: 2003-10-31.
$67,142 with Navy for Centrifugals, Separators, and Pressure and Vacuum Filters. Signed on 2000-05-09. Completion date: 2000-11-27.
PARKER HANNIFIN CORPORATION (16810 FULTON COUNTY ROAD # in METAMORA, OH) : $52,853 in 2 contractsfrom 1999 to 2005
$37,500 with Defense Logistics Agency for Engine Fuel System Components, Aircraft and Missile Prime Movers. Taking place in WI. Signed on 1999-12-30. Completion date: 2000-03-25.
$15,353 with Navy for Guided Missile Maintenance, Repair, and Checkout Specialized Equipment. Taking place in CA. Signed on 2005-04-18. Completion date: 2005-07-18.
Top industries in this zip code by the number of employees in 2005:
Construction: Poured Concrete Foundation and Structure Contractors (20-49 employees: 2 establishments, 5-9 employees: 1 establishment, 1-4 employees: 1 establishment)
Construction: Electrical Contractors (20-49: 1)
Wholesale Trade: Grain and Field Bean Merchant Wholesalers (20-49: 1)
Construction: Water and Sewer Line and Related Structures Construction (20-49: 1)
Finance and Insurance: Commercial Banking (10-19: 1)
Finance and Insurance: Insurance Agencies and Brokerages (5-9: 1)
Accommodation and Food Services: Drinking Places (Alcoholic Beverages) (5-9: 1)
Accommodation and Food Services: Full-Service Restaurants (5-9: 1)
Fatal accident statistics in 2011:
Fatal accident count: 1
Vehicles involved in fatal accidents: 1
Fatal accidents caused by drunken drivers: 1
Fatalities: 1
Persons involved in fatal accidents: 1
Pedestrians involved in fatal accidents: 0
Home Mortgage Disclosure Act Aggregated Statistics For Year 2009 (Based on 2 partial tracts)
A) FHA, FSA/RHS & VA Home Purchase Loans
B) Conventional Home Purchase Loans
C) Refinancings
D) Home Improvement Loans
F) Non-occupant Loans on < 5 Family Dwellings (A B C & D)
G) Loans On Manufactured Home Dwelling (A B C & D)
Number
Average Value
Number
Average Value
Number
Average Value
Number
Average Value
Number
Average Value
Number
Average Value
LOANS ORIGINATED
5
$101,404
11
$145,897
49
$138,699
3
$48,120
5
$53,378
1
$66,900
APPLICATIONS APPROVED, NOT ACCEPTED
2
$72,885
1
$166,190
4
$223,408
1
$7,040
0
$0
0
$0
APPLICATIONS DENIED
1
$59,860
1
$195,770
26
$144,659
0
$0
1
$69,010
1
$71,120
APPLICATIONS WITHDRAWN
1
$84,500
0
$0
7
$156,836
0
$0
0
$0
0
$0
FILES CLOSED FOR INCOMPLETENESS
0
$0
0
$0
1
$221,120
0
$0
0
$0
0
$0
Aggregated Statistics For Year 2008 (Based on 2 partial tracts)
A) FHA, FSA/RHS & VA Home Purchase Loans
B) Conventional Home Purchase Loans
C) Refinancings
D) Home Improvement Loans
F) Non-occupant Loans on < 5 Family Dwellings (A B C & D)
G) Loans On Manufactured Home Dwelling (A B C & D)
Number
Average Value
Number
Average Value
Number
Average Value
Number
Average Value
Number
Average Value
Number
Average Value
LOANS ORIGINATED
4
$150,170
17
$141,627
25
$132,446
5
$53,800
6
$156,215
1
$30,980
APPLICATIONS APPROVED, NOT ACCEPTED
1
$117,600
3
$111,500
4
$144,890
2
$67,250
0
$0
0
$0
APPLICATIONS DENIED
1
$116,190
8
$92,955
25
$151,347
6
$65,608
3
$133,330
0
$0
APPLICATIONS WITHDRAWN
1
$61,970
3
$170,183
11
$160,174
1
$114,780
0
$0
0
$0
FILES CLOSED FOR INCOMPLETENESS
0
$0
0
$0
2
$255,975
0
$0
0
$0
0
$0
Aggregated Statistics For Year 2007 (Based on 2 partial tracts)
A) FHA, FSA/RHS & VA Home Purchase Loans
B) Conventional Home Purchase Loans
C) Refinancings
D) Home Improvement Loans
F) Non-occupant Loans on < 5 Family Dwellings (A B C & D)
G) Loans On Manufactured Home Dwelling (A B C & D)
Number
Average Value
Number
Average Value
Number
Average Value
Number
Average Value
Number
Average Value
Number
Average Value
LOANS ORIGINATED
3
$88,493
27
$152,081
37
$134,293
6
$59,388
2
$113,730
1
$102,110
APPLICATIONS APPROVED, NOT ACCEPTED
0
$0
4
$117,602
7
$145,467
2
$28,170
1
$45,770
2
$70,070
APPLICATIONS DENIED
0
$0
10
$103,588
46
$151,250
8
$40,844
2
$44,715
6
$56,688
APPLICATIONS WITHDRAWN
1
$54,220
6
$91,428
11
$138,471
2
$116,895
0
$0
1
$19,720
FILES CLOSED FOR INCOMPLETENESS
1
$92,250
0
$0
6
$240,132
1
$9,150
0
$0
0
$0
Aggregated Statistics For Year 2006 (Based on 2 partial tracts)
A) FHA, FSA/RHS & VA Home Purchase Loans
B) Conventional Home Purchase Loans
C) Refinancings
D) Home Improvement Loans
F) Non-occupant Loans on < 5 Family Dwellings (A B C & D)
G) Loans On Manufactured Home Dwelling (A B C & D)
Number
Average Value
Number
Average Value
Number
Average Value
Number
Average Value
Number
Average Value
Number
Average Value
LOANS ORIGINATED
2
$124,290
32
$150,545
40
$134,361
11
$35,146
1
$105,630
3
$88,027
APPLICATIONS APPROVED, NOT ACCEPTED
0
$0
5
$91,968
10
$127,108
2
$16,550
0
$0
0
$0
APPLICATIONS DENIED
0
$0
6
$137,788
26
$135,477
10
$40,421
0
$0
5
$41,266
APPLICATIONS WITHDRAWN
0
$0
3
$90,607
15
$126,239
1
$15,490
0
$0
1
$121,830
FILES CLOSED FOR INCOMPLETENESS
0
$0
1
$38,030
4
$155,628
1
$98,590
0
$0
0
$0
Aggregated Statistics For Year 2005 (Based on 2 partial tracts)
A) FHA, FSA/RHS & VA Home Purchase Loans
B) Conventional Home Purchase Loans
C) Refinancings
D) Home Improvement Loans
F) Non-occupant Loans on < 5 Family Dwellings (A B C & D)
G) Loans On Manufactured Home Dwelling (A B C & D)
Number
Average Value
Number
Average Value
Number
Average Value
Number
Average Value
Number
Average Value
Number
Average Value
LOANS ORIGINATED
1
$171,820
38
$142,378
54
$139,705
6
$124,760
6
$96,945
3
$54,693
APPLICATIONS APPROVED, NOT ACCEPTED
0
$0
8
$144,449
14
$93,206
1
$38,730
1
$116,900
1
$23,240
APPLICATIONS DENIED
0
$0
15
$62,861
47
$128,209
4
$12,675
1
$228,870
14
$36,669
APPLICATIONS WITHDRAWN
0
$0
5
$110,278
25
$142,530
3
$110,793
0
$0
2
$94,715
FILES CLOSED FOR INCOMPLETENESS
0
$0
0
$0
6
$173,468
0
$0
0
$0
0
$0
Aggregated Statistics For Year 2004 (Based on 2 partial tracts)
A) FHA, FSA/RHS & VA Home Purchase Loans
B) Conventional Home Purchase Loans
C) Refinancings
D) Home Improvement Loans
F) Non-occupant Loans on < 5 Family Dwellings (A B C & D)
G) Loans On Manufactured Home Dwelling (A B C & D)
Number
Average Value
Number
Average Value
Number
Average Value
Number
Average Value
Number
Average Value
Number
Average Value
LOANS ORIGINATED
1
$196,470
31
$148,405
68
$117,581
4
$75,172
2
$93,660
4
$56,512
APPLICATIONS APPROVED, NOT ACCEPTED
1
$223,230
1
$246,470
9
$120,106
2
$22,535
0
$0
1
$21,130
APPLICATIONS DENIED
1
$127,460
8
$74,909
39
$118,215
6
$59,857
2
$49,295
6
$48,942
APPLICATIONS WITHDRAWN
1
$76,050
5
$143,094
20
$129,044
2
$87,320
0
$0
2
$69,365
FILES CLOSED FOR INCOMPLETENESS
0
$0
0
$0
4
$151,755
0
$0
0
$0
0
$0
Aggregated Statistics For Year 2003 (Based on 2 partial tracts)
A) FHA, FSA/RHS & VA Home Purchase Loans
B) Conventional Home Purchase Loans
C) Refinancings
D) Home Improvement Loans
F) Non-occupant Loans on < 5 Family Dwellings (A B C & D)
Number
Average Value
Number
Average Value
Number
Average Value
Number
Average Value
Number
Average Value
LOANS ORIGINATED
1
$52,110
35
$106,737
113
$107,942
6
$17,840
8
$88,818
APPLICATIONS APPROVED, NOT ACCEPTED
0
$0
4
$129,925
11
$97,244
2
$42,605
0
$0
APPLICATIONS DENIED
0
$0
14
$85,560
30
$103,752
3
$44,363
2
$96,125
APPLICATIONS WITHDRAWN
0
$0
1
$115,490
12
$119,244
0
$0
0
$0
FILES CLOSED FOR INCOMPLETENESS
0
$0
2
$100,350
5
$92,954
0
$0
1
$57,040
Aggregated Statistics For Year 2002 (Based on 2 partial tracts)
A) FHA, FSA/RHS & VA Home Purchase Loans
B) Conventional Home Purchase Loans
C) Refinancings
D) Home Improvement Loans
F) Non-occupant Loans on < 5 Family Dwellings (A B C & D)
Number
Average Value
Number
Average Value
Number
Average Value
Number
Average Value
Number
Average Value
LOANS ORIGINATED
1
$85,210
30
$128,939
97
$120,752
8
$28,609
4
$136,790
APPLICATIONS APPROVED, NOT ACCEPTED
0
$0
2
$67,955
10
$100,982
1
$7,040
1
$9,860
APPLICATIONS DENIED
0
$0
13
$47,777
27
$106,777
6
$14,788
0
$0
APPLICATIONS WITHDRAWN
0
$0
1
$52,820
20
$130,946
0
$0
0
$0
FILES CLOSED FOR INCOMPLETENESS
0
$0
1
$98,590
6
$124,057
0
$0
0
$0
Aggregated Statistics For Year 2001 (Based on 2 partial tracts)
A) FHA, FSA/RHS & VA Home Purchase Loans
B) Conventional Home Purchase Loans
C) Refinancings
D) Home Improvement Loans
F) Non-occupant Loans on < 5 Family Dwellings (A B C & D)
Number
Average Value
Number
Average Value
Number
Average Value
Number
Average Value
Number
Average Value
LOANS ORIGINATED
3
$109,620
41
$96,836
98
$108,052
8
$18,661
3
$53,753
APPLICATIONS APPROVED, NOT ACCEPTED
1
$94,360
11
$63,570
10
$89,926
1
$7,750
0
$0
APPLICATIONS DENIED
0
$0
29
$34,433
30
$90,748
6
$8,568
2
$15,490
APPLICATIONS WITHDRAWN
0
$0
4
$45,070
13
$81,687
0
$0
1
$42,250
FILES CLOSED FOR INCOMPLETENESS
0
$0
1
$61,970
1
$169,010
0
$0
0
$0
Aggregated Statistics For Year 2000 (Based on 2 partial tracts)
A) FHA, FSA/RHS & VA Home Purchase Loans
B) Conventional Home Purchase Loans
C) Refinancings
D) Home Improvement Loans
F) Non-occupant Loans on < 5 Family Dwellings (A B C & D)
Number
Average Value
Number
Average Value
Number
Average Value
Number
Average Value
Number
Average Value
LOANS ORIGINATED
1
$188,730
34
$105,091
30
$102,532
11
$21,446
4
$67,075
APPLICATIONS APPROVED, NOT ACCEPTED
0
$0
13
$39,544
7
$74,041
4
$16,725
0
$0
APPLICATIONS DENIED
1
$47,890
32
$41,306
15
$79,058
4
$10,210
0
$0
APPLICATIONS WITHDRAWN
0
$0
1
$16,900
12
$64,787
1
$56,340
0
$0
FILES CLOSED FOR INCOMPLETENESS
0
$0
0
$0
1
$31,690
0
$0
0
$0
Aggregated Statistics For Year 1999 (Based on 1 partial tract)
A) FHA, FSA/RHS & VA Home Purchase Loans
B) Conventional Home Purchase Loans
C) Refinancings
D) Home Improvement Loans
F) Non-occupant Loans on < 5 Family Dwellings (A B C & D)
Detailed PMIC statistics for the following Tracts:0401.00
2002 - 2018 National Fire Incident Reporting System (NFIRS) incidents
According to the data from the years 2002 - 2018 the average number of fire incidents per year is 13. The highest number of reported fires - 19 took place in 2004, and the least - 5 in 2011. The data has a declining trend.
When looking into fire subcategories, the most reports belonged to: Outside Fires (50.2%), and Structure Fires (35.6%).
Fire incident types reported to NFIRS in Zip Code 43540

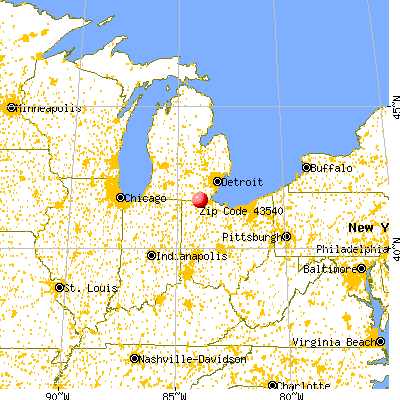


 Nearest zip codes: 43504, 49248, 43558, 49228, 43515, 43533.


 According to the data from the years 2002 - 2018 the average number of fire incidents per year is 13. The highest number of reported fires - 19 took place in 2004, and the least - 5 in 2011. The data has a declining trend.
 When looking into fire subcategories, the most reports belonged to: Outside Fires (50.2%), and Structure Fires (35.6%).