Estimated zip code population in 2022: 1,679 Zip code population in 2010: 1,860 Zip code population in 2000: 1,839
Houses and condos: 701 Renter-occupied apartments: 104
% of renters here:
16%
State:
33%
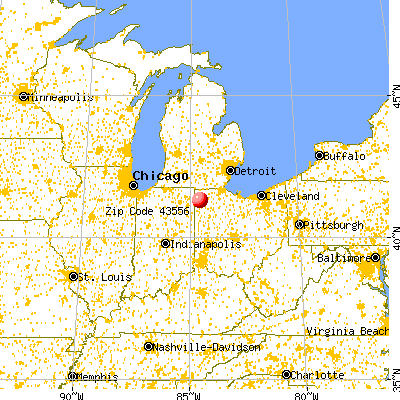
March 2022 cost of living index in zip code 43556: 82.9 (low, U.S. average is 100)
Land area: 31.8 sq. mi. Water area: 0.2 sq. mi.
Population density: 53 people per square mile
(very low).
OSM Map
General Map
Google Map
MSN Map
OSM Map
General Map
Google Map
MSN Map
OSM Map
General Map
Google Map
MSN Map
OSM Map
General Map
Google Map
MSN Map
Please wait while loading the map...
Real estate property taxes paid for housing units in 2022:
This zip code:
0.9% ($1,611)
Ohio:
1.3% ($2,639)
Median real estate property taxes paid for housing units with mortgages in 2022: $1,746 (0.8%) Median real estate property taxes paid for housing units with no mortgage in 2022: $1,521 (1.0%)
Averages for the 2020 tax year for zip code 43556, filed in 2021:
Average Adjusted Gross Income (AGI) in 2020: $52,361 (Individual Income Tax Returns)
Here:
$52,361
State:
$67,288
Salary/wage: $44,054 (reported on 81.2% of returns)
Here:
$44,054
State:
$55,628
(% of AGI for various income ranges: 985.0% for AGIs below $25k, 3470.5% for AGIs $25k-50k, 6700.0% for AGIs $50k-75k, 9810.0% for AGIs $75k-100k, 16854.0% for AGIs $100k-200k)
Taxable interest for individuals: $704 (reported on 28.2% of returns)
This zip code:
$704
Ohio:
$1,518
(% of AGI for various income ranges: 13.3% for AGIs below $25k, 32.5% for AGIs $25k-50k, 29.1% for AGIs $50k-75k, 53.3% for AGIs $75k-100k, 32.0% for AGIs $100k-200k)
Ordinary dividends: $922 (reported on 21.2% of returns)
Here:
$922
State:
$7,167
(% of AGI for various income ranges: 8.3% for AGIs below $25k, 12.0% for AGIs $25k-50k, 22.7% for AGIs $50k-75k, 63.3% for AGIs $75k-100k, 128.0% for AGIs $100k-200k)
Net capital gain/loss in AGI: +$3,567 (reported on 14.1% of returns)
Here:
+$3,567
State:
+$18,919
(% of AGI for various income ranges: 4.0% for AGIs $25k-50k, 60.9% for AGIs $50k-75k, 131.7% for AGIs $75k-100k, 548.0% for AGIs $100k-200k)
Profit/loss from business: +$2,890 (reported on 11.8% of returns)
Here:
+$2,890
State:
+$13,744
(% of AGI for various income ranges: 32.2% for AGIs below $25k, 44.5% for AGIs $25k-50k, 128.2% for AGIs $50k-75k, 1.7% for AGIs $75k-100k)
Taxable individual retirement arrangement distribution: $10,162 (reported on 9.4% of returns)
43556:
$10,162
Ohio:
$18,876
(% of AGI for various income ranges: 85.6% for AGIs below $25k, 125.5% for AGIs $25k-50k, 680.0% for AGIs $75k-100k)
Earned income credit: $2,285 (reported on 15.3% of returns)
Here:
$2,285
State:
$2,304
(% of AGI for various income ranges: 83.3% for AGIs below $25k, 73.5% for AGIs $25k-50k)
Percentage of individuals using paid preparers for their 2020 taxes: 94.1%
Here:
94%
State:
94%
(% for various income ranges: 88.5% for AGIs below $25k, 96.2% for AGIs $25k-50k, 93.8% for AGIs $50k-75k, 100.0% for AGIs $75k-100k, 100.0% for AGIs $100k-200k)
Averages for the 2012 tax year for zip code 43556, filed in 2013:
Average Adjusted Gross Income (AGI) in 2012: $42,748 (Individual Income Tax Returns)
Here:
$42,748
State:
$54,926
Salary/wage: $36,007 (reported on 84.7% of returns)
Here:
$36,007
State:
$45,869
(% of AGI for various income ranges: 73.0% for AGIs below $25k, 72.2% for AGIs $25k-50k, 79.9% for AGIs $50k-75k, 75.8% for AGIs $75k-100k, 50.5% for AGIs $100k-200k)
Taxable interest for individuals: $686 (reported on 34.1% of returns)
This zip code:
$686
Ohio:
$1,297
(% of AGI for various income ranges: 1.2% for AGIs below $25k, 0.7% for AGIs $25k-50k, 0.6% for AGIs $50k-75k, 0.2% for AGIs $75k-100k, 0.1% for AGIs $100k-200k)
Ordinary dividends: $1,188 (reported on 20.0% of returns)
Here:
$1,188
State:
$5,821
(% of AGI for various income ranges: 0.5% for AGIs below $25k, 0.6% for AGIs $25k-50k, 0.7% for AGIs $50k-75k, 0.8% for AGIs $75k-100k)
Net capital gain/loss in AGI: +$789 (reported on 10.6% of returns)
Here:
+$789
State:
+$11,232
(% of AGI for various income ranges: 0.3% for AGIs $25k-50k, 0.7% for AGIs $75k-100k)
Profit/loss from business: +$4,255 (reported on 12.9% of returns)
Here:
+$4,255
State:
+$12,773
(% of AGI for various income ranges: 2.8% for AGIs below $25k, 1.5% for AGIs $25k-50k, 2.1% for AGIs $50k-75k)
Taxable individual retirement arrangement distribution: $6,012 (reported on 9.4% of returns)
43556:
$6,012
Ohio:
$14,511
(% of AGI for various income ranges: 1.9% for AGIs below $25k, 1.8% for AGIs $25k-50k, 2.3% for AGIs $50k-75k)
Total itemized deductions: $13,564 (20% of AGI, reported on 16.5% of returns)
Here:
$13,564
State:
$21,278
Here:
19.7% of AGI
State:
18.8% of AGI
(% of AGI for various income ranges: 5.3% for AGIs below $25k, 4.2% for AGIs $25k-50k, 5.9% for AGIs $50k-75k, 4.9% for AGIs $75k-100k, 6.0% for AGIs $100k-200k)
Charity contributions: $2,918 (reported on 12.9% of returns)
Here:
$2,918
State:
$3,943
(% of AGI for various income ranges: 0.5% for AGIs $25k-50k, 1.4% for AGIs $50k-75k, 2.1% for AGIs $75k-100k)
Taxes paid: $4,629 (reported on 16.5% of returns)
43556:
$4,629
State:
$9,568
(% of AGI for various income ranges: 1.6% for AGIs $25k-50k, 1.7% for AGIs $50k-75k, 2.0% for AGIs $75k-100k, 3.2% for AGIs $100k-200k)
Earned income credit: $2,147 (reported on 17.6% of returns)
Here:
$2,147
State:
$2,285
(% of AGI for various income ranges: 5.4% for AGIs below $25k, 0.9% for AGIs $25k-50k)
Percentage of individuals using paid preparers for their 2012 taxes: 57.6%
Here:
58%
State:
51%
(% for various income ranges: 51.6% for AGIs below $25k, 55.6% for AGIs $25k-50k, 68.8% for AGIs $50k-75k, 57.1% for AGIs $75k-100k, 75.0% for AGIs $100k-200k)
Averages for the 2004 tax year for zip code 43556, filed in 2005:
Average Adjusted Gross Income (AGI) in 2004: $34,765 (Individual Income Tax Returns)
Here:
$34,765
State:
$44,480
Salary/wage: $32,329 (reported on 89.4% of returns)
Here:
$32,329
State:
$39,198
(% of AGI for various income ranges: 106.4% for AGIs below $10k, 75.7% for AGIs $10k-25k, 82.1% for AGIs $25k-50k, 85.9% for AGIs $50k-75k, 88.2% for AGIs $75k-100k, 75.6% for AGIs over 100k)
Taxable interest for individuals: $995 (reported on 41.1% of returns)
This zip code:
$995
Ohio:
$1,532
(% of AGI for various income ranges: 3.5% for AGIs below $10k, 3.2% for AGIs $10k-25k, 1.3% for AGIs $25k-50k, 0.3% for AGIs $50k-75k, 1.0% for AGIs $75k-100k, 0.3% for AGIs over 100k)
Taxable dividends: $812 (reported on 18.1% of returns)
Here:
$812
State:
$3,496
(% of AGI for various income ranges: 1.5% for AGIs below $10k, 1.5% for AGIs $10k-25k, 0.3% for AGIs $25k-50k, 0.2% for AGIs $50k-75k, 0.3% for AGIs $75k-100k)
Net capital gain/loss: +$902 (reported on 10.9% of returns)
Here:
+$902
State:
+$8,582
(% of AGI for various income ranges: -0.8% for AGIs below $10k, 0.2% for AGIs $10k-25k, -0.1% for AGIs $25k-50k, 0.8% for AGIs $50k-75k, 0.6% for AGIs $75k-100k)
Profit/loss from business: +$2,133 (reported on 13.6% of returns)
Here:
+$2,133
State:
+$10,813
(% of AGI for various income ranges: 2.5% for AGIs below $10k, 1.7% for AGIs $10k-25k, 0.8% for AGIs $25k-50k, 0.9% for AGIs $50k-75k, 0.1% for AGIs $75k-100k)
IRA payment deduction: $2,762 (reported on 2.2% of returns)
43556:
$2,762
Ohio:
$2,794
Total itemized deductions: $12,291 (21% of AGI, reported on 20.1% of returns)
Here:
$12,291
State:
$17,503
Here:
20.6% of AGI
State:
20.8% of AGI
(% of AGI for various income ranges: 2.7% for AGIs $10k-25k, 6.5% for AGIs $25k-50k, 7.9% for AGIs $50k-75k, 9.7% for AGIs $75k-100k, 11.6% for AGIs over 100k)
Charity contributions deductions: $2,633 (4% of AGI, reported on 14.8% of returns)
Here:
$2,633
State:
$3,087
Here:
4.1% of AGI
State:
3.4% of AGI
(% of AGI for various income ranges: 1.1% for AGIs $25k-50k, 1.5% for AGIs $50k-75k, 1.4% for AGIs $75k-100k, 1.6% for AGIs over 100k)
Total tax: $3,449 (reported on 79.6% of returns)
43556:
$3,449
State:
$6,781
(% of AGI for various income ranges: 2.5% for AGIs below $10k, 4.0% for AGIs $10k-25k, 6.8% for AGIs $25k-50k, 8.5% for AGIs $50k-75k, 9.7% for AGIs $75k-100k, 14.9% for AGIs over 100k)
Earned income credit: $1,737 (reported on 12.6% of returns)
Here:
$1,737
State:
$1,696
Percentage of individuals using paid preparers for their 2004 taxes: 57.7%
Here:
58%
State:
55%
(% for various income ranges: 35.8% for AGIs below $10k, 60.1% for AGIs $10k-25k, 62.4% for AGIs $25k-50k, 66.9% for AGIs $50k-75k, 55.8% for AGIs $75k-100k, 61.9% for AGIs over 100k)
Household received Food Stamps/SNAP in the past 12 months: 51 Household did not receive Food Stamps/SNAP in the past 12 months: 593
Women who had a birth in the past 12 months: 30 (31 now married, 0 unmarried) Women who did not have a birth in the past 12 months: 287 (165 now married, 122 unmarried)
Housing units in zip code 43556 with a mortgage: 235 (7 second mortgage, 7 both second mortgage and home equity loan) Houses without a mortgage: 6
Median monthly owner costs for units with a mortgage: $1,311 Median monthly owner costs for units without a mortgage: $460
Residents with income below the poverty level in 2022:
This zip code:
9.3%
Whole state:
13.4%
Residents with income below 50% of the poverty level in 2022:
This zip code:
8.1%
Whole state:
7.0%
Median number of rooms in houses and condos:
Here:
7.0
State:
6.7
Median number of rooms in apartments:
Here:
5.5
State:
4.4
Notable locations in this zip code not listed on our city pages
Cemeteries: Blair Cemetery (1), Sherwood Cemetery (2), Colby Cemetery (3), Glore Cemetery (4), New Saint Stephens Catholic Cemetery (5), Saint Johns Lutheran Cemetery (6). Display/hide their locations on the map
Size of family households: 170 2-persons, 61 3-persons, 109 4-persons, 32 5-persons, 31 6-persons, 12 7-or-more-persons
Size of nonfamily households: 189 1-person, 35 2-persons
368 married couples with children.
72 single-parent households (31 men, 41 women).
97.8% of residents of 43556 zip code speak English at home.
2.1% of residents speak Spanish at home (21% very well, 79% well).
Foreign born population: 34 (2.1%) (73.9% of them are naturalized citizens)
This zip code:
2.1%
Whole state:
5.0%
59%Germany
26%Honduras
47%German
12%American
8%English
3%Dutch
3%European
1%Irish
1%Pennsylvania German
Year of entry for the foreign-born population
02010 or later
322000 to 2009
01990 to 1999
21Before 1990
Facilities with environmental interests located in this zip code:
ARCHBOLD EQUIPMENT (ST RT 18 E in SHERWOOD, OH)
Small Quantity Generators, between 100 kg and 1000 kg of hazardous waste/month (Resource Conservation and Recovery Act (tracking hazardous waste)) - notification Organizations: ARCHBOLD EQUIPMENT CO (CONTACT/OWNER)
Housing units lacking complete plumbing facilities: 1.1% Housing units lacking complete kitchen facilities: 3.5%
34.8%Electricity
31.6%Bottled, tank, or LP gas
26.4%Utility gas
4.4%Wood
1.9%Fuel oil, kerosene, etc.
1.1%No fuel used
Population in 1990: 1,686. Population change in the 1990s: +153 (+9.1%).
Place of birth for U.S.-born residents:
This state: 1,294
Northeast: 25
Midwest: 174
South: 112
West: 10
69% of the 43556 zip code residents lived in the same house 5 years ago. Out of people who lived in different houses, 61% lived in this county. Out of people who lived in different counties, 50% lived in Ohio.
94% of the 43556 zip code residents lived in the same house 1 year ago. Out of people who lived in different houses, 24% moved from this county. Out of people who lived in different houses, 48% moved from different county within same state. Out of people who lived in different houses, 37% moved from different state.
Private vs. public school enrollment:
Students in private schools in grades 1 to 8 (elementary and middle school): 2
Here:
0.9%
Ohio:
16.0%
Students in private schools in grades 9 to 12 (high school):
Here:
0.0%
Ohio:
13.1%
Students in private undergraduate colleges:
Here:
0.0%
Ohio:
22.3%
Occupation by median earnings in the past 12 months ($)
56,601Health diagnosing and treating practitioners and other technical occupations
55,505Installation, maintenance, and repair occupations
54,974Health technologists and technicians
52,733Production occupations
50,717Community and social service occupations
46,825Education, training, and library occupations
Top industries in this zip code by the number of employees in 2005:
Wholesale Trade: Farm and Garden Machinery and Equipment Merchant Wholesalers (10-19 employees: 1 establishment)
Finance and Insurance: Commercial Banking (10-19: 1)
Accommodation and Food Services: Limited-Service Restaurants (5-9: 1, 1-4: 1)
Finance and Insurance: Insurance Agencies and Brokerages (1-4: 2)
Wholesale Trade: Automobile and Other Motor Vehicle Merchant Wholesalers (1-4: 1)
Health Care and Social Assistance: Offices of Chiropractors (1-4: 1)
Fatal accident statistics in 2014:
Fatal accident count: 2
Vehicles involved in fatal accidents: 3
Fatal accidents caused by drunken drivers: 1
Fatalities: 2
Persons involved in fatal accidents: 5
Pedestrians involved in fatal accidents: 0
Fatal accident statistics in 2012:
Fatal accident count: 1
Vehicles involved in fatal accidents: 1
Fatal accidents caused by drunken drivers: 1
Fatalities: 1
Persons involved in fatal accidents: 1
Pedestrians involved in fatal accidents: 0
2002 - 2018 National Fire Incident Reporting System (NFIRS) incidents
According to the data from the years 2002 - 2018 the average number of fires per year is 12. The highest number of reported fires - 24 took place in 2017, and the least - 3 in 2002. The data has an increasing trend.
When looking into fire subcategories, the most reports belonged to: Structure Fires (56.6%), and Outside Fires (33.2%).
Fire incident types reported to NFIRS in Zip Code 43556


 Nearest zip codes: 43536, 45821, 43549, 43526, 43506, 45879.


 According to the data from the years 2002 - 2018 the average number of fires per year is 12. The highest number of reported fires - 24 took place in 2017, and the least - 3 in 2002. The data has an increasing trend.
 When looking into fire subcategories, the most reports belonged to: Structure Fires (56.6%), and Outside Fires (33.2%).