Estimated zip code population in 2022: 7,934 Zip code population in 2010: 7,613 Zip code population in 2000: 6,720
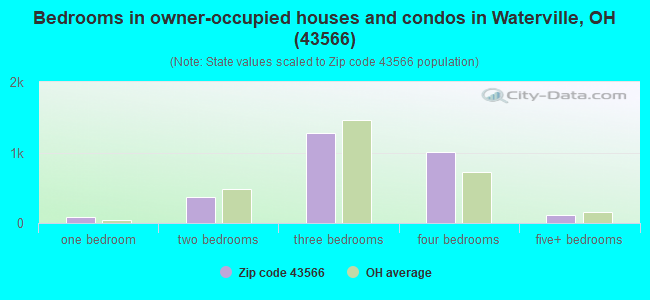
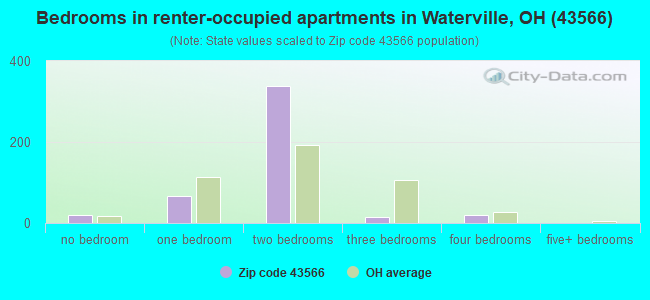
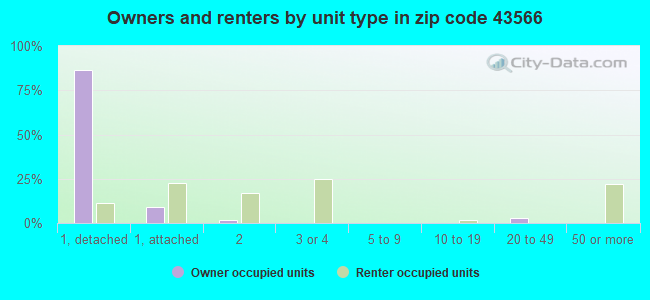
Houses and condos: 3,506 Renter-occupied apartments: 458
% of renters here:
14%
State:
33%
March 2022 cost of living index in zip code 43566: 94.7 (less than average, U.S. average is 100)
Land area: 19.7 sq. mi. Water area: 0.9 sq. mi.
Population density: 403 people per square mile
(low).
OSM Map
General Map
Google Map
MSN Map
OSM Map
General Map
Google Map
MSN Map
OSM Map
General Map
Google Map
MSN Map
OSM Map
General Map
Google Map
MSN Map
Please wait while loading the map...
Real estate property taxes paid for housing units in 2022:
This zip code:
1.4% ($4,024)
Ohio:
1.3% ($2,639)
Median real estate property taxes paid for housing units with mortgages in 2022: $3,974 (1.3%) Median real estate property taxes paid for housing units with no mortgage in 2022: $4,113 (1.5%)
Business Search- 14 Million verified businesses
Males: 4,015
(50.6%)
Females: 3,918
(49.4%)
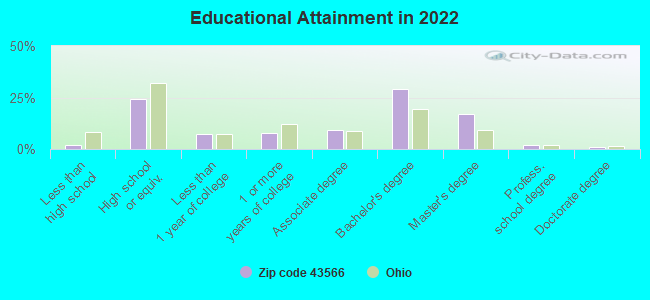
For population 25 years and over in 43566:
High school or higher: 99.3%
Bachelor's degree or higher: 49.7%
Graduate or professional degree: 20.3%
Unemployed: 3.5%
Mean travel time to work (commute): 25.1 minutes
For population 15 years and over in 43566:
Never married: 25.0%
Now married: 59.5%
Separated: 0.2%
Widowed: 7.6%
Divorced: 7.8%
Zip code 43566 compared to state average:
Median household income above state average.
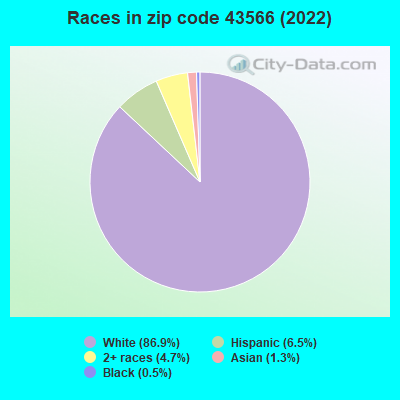
Black race population percentage significantly below state average.
Median age above state average.
Foreign-born population percentage below state average.
Renting percentage significantly below state average.
Length of stay since moving in significantly above state average.
House age below state average.
Percentage of population with a bachelor's degree or higher above state average.
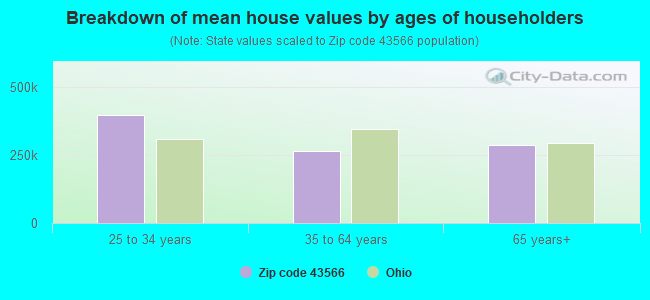
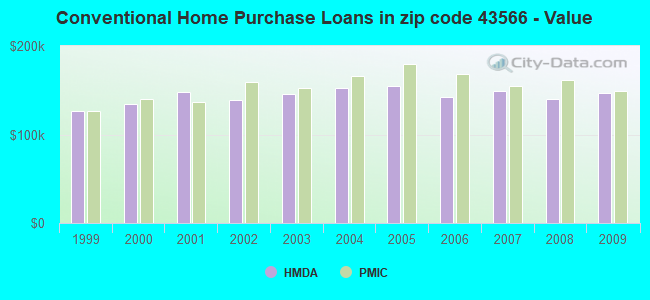
Estimated median house/condo value in 2022: $292,510
43566:
$292,510
Ohio:
$204,100
According to our research of Ohio and other state lists, there were 3 registered sex offenders living in 43566 zip code as of May 28, 2024. The ratio of all residents to sex offenders in zip code 43566 is 2,707 to 1. The ratio of registered sex offenders to all residents in this zip code is much lower than the state average.
Median resident age:
This zip code:
46.1 years
Ohio median age:
39.9 years
Average household size:
This zip code:
2.4 people
Ohio:
2.4 people
Averages for the 2020 tax year for zip code 43566, filed in 2021:
Average Adjusted Gross Income (AGI) in 2020: $82,352 (Individual Income Tax Returns)
Here:
$82,352
State:
$67,288
Salary/wage: $71,844 (reported on 79.6% of returns)
Here:
$71,844
State:
$55,628
(% of AGI for various income ranges: 1103.1% for AGIs below $25k, 3401.8% for AGIs $25k-50k, 6256.0% for AGIs $50k-75k, 9080.6% for AGIs $75k-100k, 18291.7% for AGIs $100k-200k, 81335.7% for AGIs over 200k)
Taxable interest for individuals: $1,144 (reported on 37.2% of returns)
This zip code:
$1,144
Ohio:
$1,518
(% of AGI for various income ranges: 16.2% for AGIs below $25k, 27.9% for AGIs $25k-50k, 51.4% for AGIs $50k-75k, 87.4% for AGIs $75k-100k, 115.0% for AGIs $100k-200k, 545.7% for AGIs over 200k)
Ordinary dividends: $4,229 (reported on 30.4% of returns)
Here:
$4,229
State:
$7,167
(% of AGI for various income ranges: 37.6% for AGIs below $25k, 63.7% for AGIs $25k-50k, 109.8% for AGIs $50k-75k, 140.9% for AGIs $75k-100k, 305.3% for AGIs $100k-200k, 3200.0% for AGIs over 200k)
Net capital gain/loss in AGI: +$10,061 (reported on 26.8% of returns)
Here:
+$10,061
State:
+$18,919
(% of AGI for various income ranges: 17.2% for AGIs below $25k, 32.5% for AGIs $25k-50k, 77.6% for AGIs $50k-75k, 178.5% for AGIs $75k-100k, 514.7% for AGIs $100k-200k, 10837.1% for AGIs over 200k)
Profit/loss from business: +$20,260 (reported on 13.2% of returns)
Here:
+$20,260
State:
+$13,744
(% of AGI for various income ranges: 57.8% for AGIs below $25k, 110.5% for AGIs $25k-50k, 304.2% for AGIs $50k-75k, 235.0% for AGIs $75k-100k, 710.3% for AGIs $100k-200k, 6108.6% for AGIs over 200k)
Taxable individual retirement arrangement distribution: $19,715 (reported on 15.4% of returns)
43566:
$19,715
Ohio:
$18,876
(% of AGI for various income ranges: 109.3% for AGIs below $25k, 286.8% for AGIs $25k-50k, 358.8% for AGIs $50k-75k, 646.2% for AGIs $75k-100k, 825.3% for AGIs $100k-200k, 3192.9% for AGIs over 200k)
Self-employed (Keogh) retirement plans: $21,625 (reported on 0.9% of returns)
43566:
$21,625
Ohio:
$24,898
(% of AGI for various income ranges: 149.1% for AGIs $100k-200k)
Total itemized deductions: $30,771 (reported on 7.7% of returns)
Here:
$30,771
State:
$33,869
(% of AGI for various income ranges: 197.0% for AGIs $25k-50k, 241.6% for AGIs $50k-75k, 435.9% for AGIs $75k-100k, 583.1% for AGIs $100k-200k, 4695.7% for AGIs over 200k)
Charity contributions: $12,215 (reported on 5.9% of returns)
Here:
$12,215
State:
$14,577
(% of AGI for various income ranges: 15.0% for AGIs below $25k, 35.8% for AGIs $50k-75k, 67.1% for AGIs $75k-100k, 155.3% for AGIs $100k-200k, 2514.3% for AGIs over 200k)
Taxes paid: $7,638 (reported on 7.7% of returns)
43566:
$7,638
State:
$7,681
(% of AGI for various income ranges: 30.9% for AGIs $25k-50k, 51.4% for AGIs $50k-75k, 127.4% for AGIs $75k-100k, 188.6% for AGIs $100k-200k, 914.3% for AGIs over 200k)
Earned income credit: $2,000 (reported on 5.7% of returns)
Here:
$2,000
State:
$2,304
(% of AGI for various income ranges: 40.6% for AGIs below $25k, 37.1% for AGIs $25k-50k)
Percentage of individuals using paid preparers for their 2020 taxes: 92.7%
Here:
93%
State:
94%
(% for various income ranges: 91.4% for AGIs below $25k, 92.4% for AGIs $25k-50k, 93.2% for AGIs $50k-75k, 94.4% for AGIs $75k-100k, 92.4% for AGIs $100k-200k, 96.0% for AGIs over 200k)
Averages for the 2012 tax year for zip code 43566, filed in 2013:
Average Adjusted Gross Income (AGI) in 2012: $66,300 (Individual Income Tax Returns)
Here:
$66,300
State:
$54,926
Salary/wage: $57,440 (reported on 83.9% of returns)
Here:
$57,440
State:
$45,869
(% of AGI for various income ranges: 69.1% for AGIs below $25k, 67.1% for AGIs $25k-50k, 72.7% for AGIs $50k-75k, 73.0% for AGIs $75k-100k, 79.6% for AGIs $100k-200k, 61.6% for AGIs over 200k)
Taxable interest for individuals: $1,096 (reported on 43.4% of returns)
This zip code:
$1,096
Ohio:
$1,297
(% of AGI for various income ranges: 1.4% for AGIs below $25k, 0.8% for AGIs $25k-50k, 0.7% for AGIs $50k-75k, 0.6% for AGIs $75k-100k, 0.3% for AGIs $100k-200k, 1.5% for AGIs over 200k)
Ordinary dividends: $3,091 (reported on 31.2% of returns)
Here:
$3,091
State:
$5,821
(% of AGI for various income ranges: 2.6% for AGIs below $25k, 1.5% for AGIs $25k-50k, 1.6% for AGIs $50k-75k, 0.9% for AGIs $75k-100k, 1.3% for AGIs $100k-200k, 1.9% for AGIs over 200k)
Net capital gain/loss in AGI: +$3,801 (reported on 23.9% of returns)
Here:
+$3,801
State:
+$11,232
(% of AGI for various income ranges: 0.4% for AGIs $25k-50k, 0.5% for AGIs $50k-75k, 0.9% for AGIs $75k-100k, 0.7% for AGIs $100k-200k, 5.4% for AGIs over 200k)
Profit/loss from business: +$16,218 (reported on 14.3% of returns)
Here:
+$16,218
State:
+$12,773
(% of AGI for various income ranges: 4.2% for AGIs below $25k, 2.2% for AGIs $25k-50k, 1.5% for AGIs $50k-75k, 2.6% for AGIs $75k-100k, 3.4% for AGIs $100k-200k, 7.3% for AGIs over 200k)
Taxable individual retirement arrangement distribution: $15,705 (reported on 15.8% of returns)
43566:
$15,705
Ohio:
$14,511
(% of AGI for various income ranges: 7.5% for AGIs below $25k, 5.2% for AGIs $25k-50k, 3.6% for AGIs $50k-75k, 3.7% for AGIs $75k-100k, 3.3% for AGIs $100k-200k, 2.8% for AGIs over 200k)
Self-employment retirement plans: $26,433 (reported on 0.8% of returns)
43566:
$26,433
Ohio:
$20,257
(% of AGI for various income ranges: 0.9% for AGIs $100k-200k)
Total itemized deductions: $19,716 (19% of AGI, reported on 48.8% of returns)
Here:
$19,716
State:
$21,278
Here:
19.3% of AGI
State:
18.8% of AGI
(% of AGI for various income ranges: 15.2% for AGIs below $25k, 12.5% for AGIs $25k-50k, 13.7% for AGIs $50k-75k, 15.4% for AGIs $75k-100k, 15.4% for AGIs $100k-200k, 13.5% for AGIs over 200k)
Charity contributions: $3,039 (reported on 41.0% of returns)
Here:
$3,039
State:
$3,943
(% of AGI for various income ranges: 0.9% for AGIs below $25k, 1.4% for AGIs $25k-50k, 1.7% for AGIs $50k-75k, 1.9% for AGIs $75k-100k, 2.1% for AGIs $100k-200k, 2.2% for AGIs over 200k)
Taxes paid: $8,827 (reported on 48.6% of returns)
43566:
$8,827
State:
$9,568
(% of AGI for various income ranges: 2.7% for AGIs below $25k, 3.8% for AGIs $25k-50k, 5.4% for AGIs $50k-75k, 6.6% for AGIs $75k-100k, 7.6% for AGIs $100k-200k, 7.7% for AGIs over 200k)
Earned income credit: $1,926 (reported on 7.0% of returns)
Here:
$1,926
State:
$2,285
(% of AGI for various income ranges: 2.8% for AGIs below $25k, 0.6% for AGIs $25k-50k)
Percentage of individuals using paid preparers for their 2012 taxes: 53.2%
Here:
53%
State:
51%
(% for various income ranges: 43.9% for AGIs below $25k, 56.2% for AGIs $25k-50k, 59.4% for AGIs $50k-75k, 57.7% for AGIs $75k-100k, 54.3% for AGIs $100k-200k, 66.7% for AGIs over 200k)
Averages for the 2004 tax year for zip code 43566, filed in 2005:
Average Adjusted Gross Income (AGI) in 2004: $55,620 (Individual Income Tax Returns)
Here:
$55,620
State:
$44,480
Salary/wage: $51,132 (reported on 85.5% of returns)
Here:
$51,132
State:
$39,198
(% of AGI for various income ranges: 102.2% for AGIs below $10k, 62.2% for AGIs $10k-25k, 76.6% for AGIs $25k-50k, 80.5% for AGIs $50k-75k, 86.3% for AGIs $75k-100k, 75.9% for AGIs over 100k)
Taxable interest for individuals: $1,224 (reported on 57.9% of returns)
This zip code:
$1,224
Ohio:
$1,532
(% of AGI for various income ranges: 5.9% for AGIs below $10k, 5.4% for AGIs $10k-25k, 1.6% for AGIs $25k-50k, 1.1% for AGIs $50k-75k, 0.7% for AGIs $75k-100k, 0.9% for AGIs over 100k)
Taxable dividends: $2,378 (reported on 36.6% of returns)
Here:
$2,378
State:
$3,496
(% of AGI for various income ranges: 3.6% for AGIs below $10k, 2.7% for AGIs $10k-25k, 1.7% for AGIs $25k-50k, 1.0% for AGIs $50k-75k, 0.9% for AGIs $75k-100k, 1.9% for AGIs over 100k)
Net capital gain/loss: +$3,576 (reported on 28.6% of returns)
Here:
+$3,576
State:
+$8,582
(% of AGI for various income ranges: -1.7% for AGIs below $10k, -0.1% for AGIs $10k-25k, 0.5% for AGIs $25k-50k, 0.4% for AGIs $50k-75k, 0.7% for AGIs $75k-100k, 4.0% for AGIs over 100k)
Profit/loss from business: +$12,911 (reported on 15.4% of returns)
Here:
+$12,911
State:
+$10,813
(% of AGI for various income ranges: 4.1% for AGIs below $10k, 5.0% for AGIs $10k-25k, 3.2% for AGIs $25k-50k, 3.0% for AGIs $50k-75k, 1.9% for AGIs $75k-100k, 4.7% for AGIs over 100k)
IRA payment deduction: $3,127 (reported on 2.7% of returns)
43566:
$3,127
Ohio:
$2,794
(% of AGI for various income ranges: 0.5% for AGIs $10k-25k, 0.3% for AGIs $25k-50k, 0.2% for AGIs $50k-75k, 0.1% for AGIs $75k-100k, 0.1% for AGIs over 100k)
Self-employed pension: $10,720 (reported on 1.3% of returns)
Here:
$10,720
Ohio:
$13,981
Total itemized deductions: $18,050 (21% of AGI, reported on 54.2% of returns)
Here:
$18,050
State:
$17,503
Here:
21.5% of AGI
State:
20.8% of AGI
(% of AGI for various income ranges: 17.9% for AGIs below $10k, 16.4% for AGIs $10k-25k, 15.8% for AGIs $25k-50k, 18.7% for AGIs $50k-75k, 19.7% for AGIs $75k-100k, 16.7% for AGIs over 100k)
Charity contributions deductions: $2,480 (3% of AGI, reported on 47.5% of returns)
Here:
$2,480
State:
$3,087
Here:
2.8% of AGI
State:
3.4% of AGI
(% of AGI for various income ranges: 0.3% for AGIs below $10k, 1.3% for AGIs $10k-25k, 1.7% for AGIs $25k-50k, 1.9% for AGIs $50k-75k, 2.2% for AGIs $75k-100k, 2.5% for AGIs over 100k)
Total tax: $7,915 (reported on 82.0% of returns)
43566:
$7,915
State:
$6,781
(% of AGI for various income ranges: 2.4% for AGIs below $10k, 4.6% for AGIs $10k-25k, 7.7% for AGIs $25k-50k, 9.2% for AGIs $50k-75k, 9.7% for AGIs $75k-100k, 16.5% for AGIs over 100k)
Earned income credit: $1,315 (reported on 4.8% of returns)
Here:
$1,315
State:
$1,696
Percentage of individuals using paid preparers for their 2004 taxes: 53.7%
Here:
54%
State:
55%
(% for various income ranges: 39.9% for AGIs below $10k, 51.9% for AGIs $10k-25k, 61.0% for AGIs $25k-50k, 58.9% for AGIs $50k-75k, 52.8% for AGIs $75k-100k, 56.5% for AGIs over 100k)
Household received Food Stamps/SNAP in the past 12 months: 65 Household did not receive Food Stamps/SNAP in the past 12 months: 3,228
Women who had a birth in the past 12 months: 58 (23 now married, 34 unmarried) Women who did not have a birth in the past 12 months: 1,271 (716 now married, 554 unmarried)
Housing units in zip code 43566 with a mortgage: 1,960 (317 second mortgage, 310 both second mortgage and home equity loan) Houses without a mortgage: 24
Median monthly owner costs for units with a mortgage: $1,761 Median monthly owner costs for units without a mortgage: $666
Residents with income below the poverty level in 2022:
This zip code:
4.2%
Whole state:
13.4%
Residents with income below 50% of the poverty level in 2022:
This zip code:
2.9%
Whole state:
7.0%
Median number of rooms in houses and condos:
Here:
7.2
State:
6.7
Median number of rooms in apartments:
Here:
4.1
State:
4.4
Notable locations in this zip code not listed on our city pages
Churches in zip code 43566 include: Waterville United Methodist Church (A), First Presbyterian Church (B), Zion Lutheran Church (C). Display/hide their locations on the map
Parks in zip code 43566 include: Missionary Island State Wildlife Area (1), Waterville Commercial Historic District (2), Baer Park (3), Conrad Park (4), Farnsworth Metropark (5), Pray Park (6), Stitt Park (7), Waterworks Park (8). Display/hide their locations on the map
In group quarters: 126 (-1 institutionalized population)
Size of family households: 1,116 2-persons, 412 3-persons, 257 4-persons, 287 5-persons, 58 6-persons
Size of nonfamily households: 1,066 1-person, 101 2-persons
1,443 married couples with children.
362 single-parent households (244 men, 118 women).
95.7% of residents of 43566 zip code speak English at home.
1.5% of residents speak Spanish at home (54% very well, 38% well, 8% not well).
1.3% of residents speak other Indo-European language at home (89% very well, 11% not well).
1.6% of residents speak Asian or Pacific Island language at home (90% very well, 10% well).
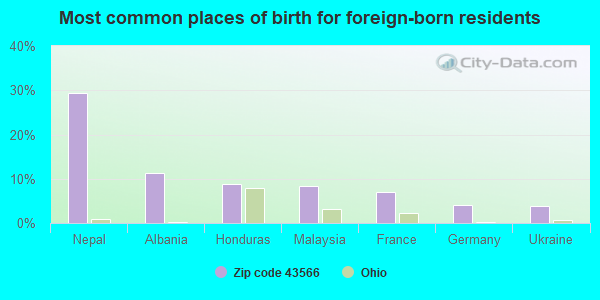
Foreign born population: 239 (3.0%) (61.5% of them are naturalized citizens)
This zip code:
3.0%
Whole state:
5.0%
29%Nepal
11%Albania
9%Honduras
8%Malaysia
7%France
4%Germany
4%Ukraine
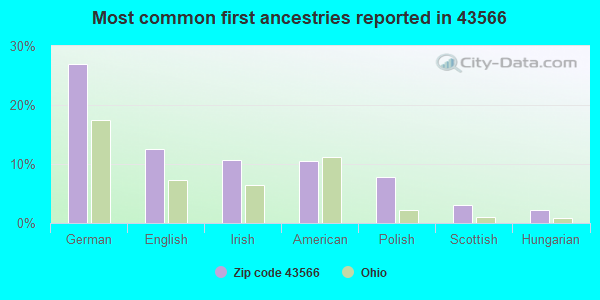
27%German
12%English
11%Irish
10%American
8%Polish
3%Scottish
2%Hungarian
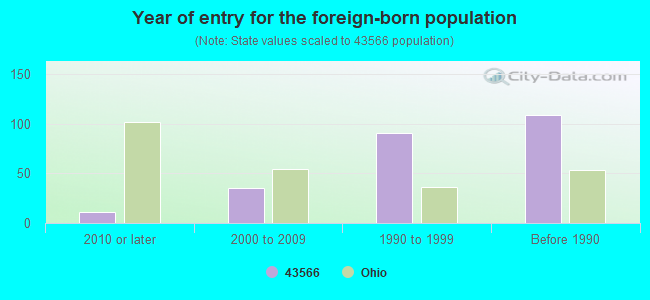
Year of entry for the foreign-born population
112010 or later
352000 to 2009
911990 to 1999
109Before 1990
Facilities with environmental interests located in this zip code:
BP OIL CO * (ANTHONY WAYNE TRAIL-FARNS in WATERVILLE, OH)
STATE MASTER (Ohio general info) - AIR MAJOR STATE MASTER (Ohio general info) - -48-5541-168-3, EPCRA Conditionally Exempt Small Quantity Generators, less than 100 kg/month of hazardous waste (Resource Conservation and Recovery Act (tracking hazardous waste)) - notification Organizations: BP OIL COMPANY (CONTACT/OWNER)
Alternative names: BP OIL CO NO 06985 *, BP OIL SITE NO 06985
AMERICAN METALCRAFT CO (218 MECHANIC ST in WATERVILLE, OH)
AIR MINOR (AIRS/AFS) STATE MASTER (Ohio general info) - AIR MAJOR Small Quantity Generators, between 100 kg and 1000 kg of hazardous waste/month (Resource Conservation and Recovery Act (tracking hazardous waste)) - notification Business SIC classification: COATING, ENGRAVING, AND ALLIED SERVICES
BLUE CREEK CONSERVATION AREA (7790 SHADEL RD in WATERVILLE TOWNSHIP, OH)
(Resource Conservation and Recovery Act (tracking hazardous waste)) Organizations: TOLEDO AREA METROPARKS (CONTACT/OPERATOR)
CH-1K PAINTING INC (CONTRACTOR FOR ODOT) (RT 64 BRIDGE WOO-64-12.03 in WATERVILLE, OH)
Conditionally Exempt Small Quantity Generators, less than 100 kg/month of hazardous waste (Resource Conservation and Recovery Act (tracking hazardous waste)) Organizations: OHIO DEPARTMENT OF TRANSPORTATION (CONTACT/OWNER)
Housing units lacking complete plumbing facilities: 1.1% Housing units lacking complete kitchen facilities: 2.4%
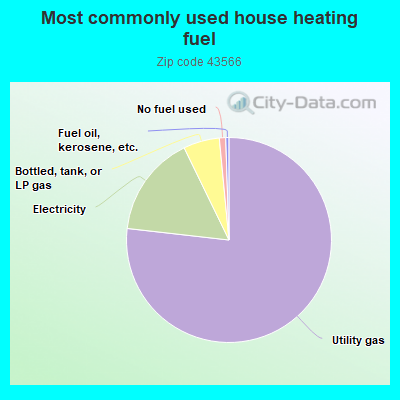
76.8%Utility gas
16.0%Electricity
5.7%Bottled, tank, or LP gas
1.0%No fuel used
0.5%Fuel oil, kerosene, etc.
Population in 1990: 5,918. Population change in the 1990s: +802 (+13.6%).
Place of birth for U.S.-born residents:
This state: 6,075
Northeast: 425
Midwest: 728
South: 263
West: 174
57% of the 43566 zip code residents lived in the same house 5 years ago. Out of people who lived in different houses, 77% lived in this county. Out of people who lived in different counties, 50% lived in Ohio.
90% of the 43566 zip code residents lived in the same house 1 year ago. Out of people who lived in different houses, 68% moved from this county. Out of people who lived in different houses, 21% moved from different county within same state. Out of people who lived in different houses, 7% moved from different state.
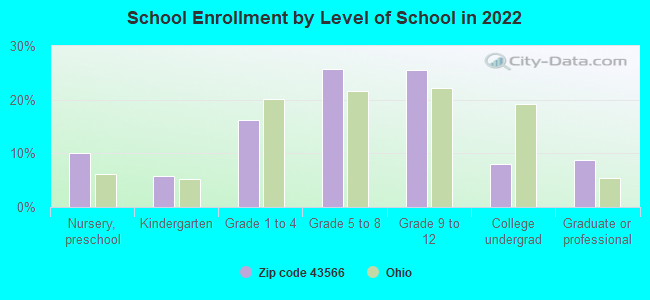
Private vs. public school enrollment:
Students in private schools in grades 1 to 8 (elementary and middle school): 118
Here:
15.8%
Ohio:
16.0%
Students in private schools in grades 9 to 12 (high school): 45
Here:
10.0%
Ohio:
13.1%
Students in private undergraduate colleges: 7
Here:
5.1%
Ohio:
22.3%
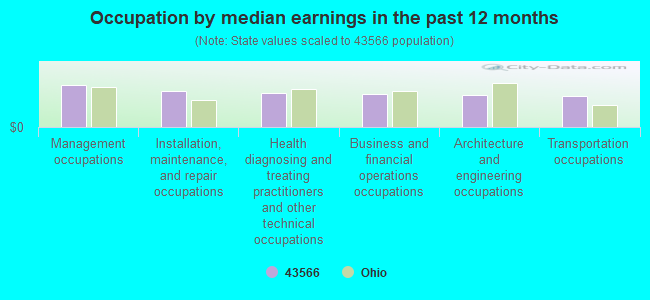
Occupation by median earnings in the past 12 months ($)
102,724Management occupations
88,274Installation, maintenance, and repair occupations
83,827Health diagnosing and treating practitioners and other technical occupations
81,048Business and financial operations occupations
79,374Architecture and engineering occupations
76,580Transportation occupations
Companies with federal contracts located in this zip code:
SMOKE & FIRE COMPANY (27 N RIVER RD in WATERVILLE, OH; small business) : $3,515 in 3 contractsfrom 2005 to 2006
$2,914 with Army for Textile Fabrics. Taking place in CA. Signed on 2005-09-29. Completion date: 2005-10-29.
$601, same as above.Signed on 2006-02-09. Completion date: 2005-10-29.
$0, same as above.Signed on 2006-02-09. Completion date: 2005-10-29.
T J F, INC (1070 DISHER DR in WATERVILLE, OH; small business) : $0 in 2 contractsin 2004
$0 with Defense Logistics Agency for Hardware, Commercial. Signed on 2004-03-29. Completion date: 2006-03-28.
$0, same as above.Signed on 2004-03-29. Completion date: 2006-03-28.
Top industries in this zip code by the number of employees in 2005:
Health Care and Social Assistance: Nursing Care Facilities (100-249 employees: 1 establishment, 50-99 employees: 1 establishment)
Wholesale Trade: Industrial Machinery and Equipment Merchant Wholesalers (50-99: 2)
2002 - 2018 National Fire Incident Reporting System (NFIRS) incidents
According to the data from the years 2002 - 2018 the average number of fires per year is 20. The highest number of reported fire incidents - 36 took place in 2017, and the least - 4 in 2002. The data has a growing trend.
When looking into fire subcategories, the most reports belonged to: Structure Fires (51.0%), and Outside Fires (33.2%).
Fire incident types reported to NFIRS in Zip Code 43566


 Nearest zip codes: 43525, 43571, 43565, 43542, 43537, 43522.
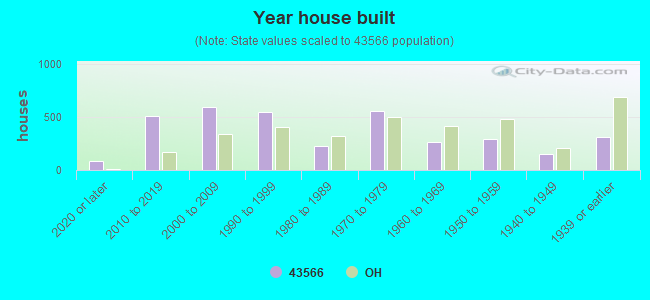


 According to the data from the years 2002 - 2018 the average number of fires per year is 20. The highest number of reported fire incidents - 36 took place in 2017, and the least - 4 in 2002. The data has a growing trend.
 When looking into fire subcategories, the most reports belonged to: Structure Fires (51.0%), and Outside Fires (33.2%).