Estimated zip code population in 2022: 2,851 Zip code population in 2010: 2,503 Zip code population in 2000: 2,479
Houses and condos: 1,260 Renter-occupied apartments: 165
% of renters here:
18%
State:
33%
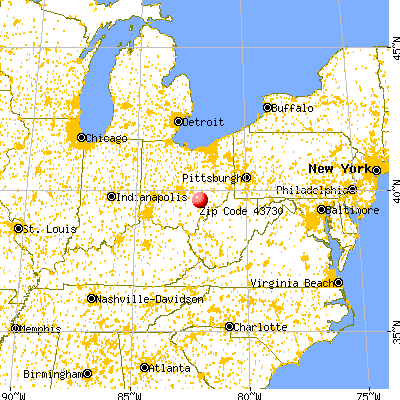
March 2022 cost of living index in zip code 43730: 82.1 (low, U.S. average is 100)
Land area: 46.4 sq. mi. Water area: 0.3 sq. mi.
Population density: 61 people per square mile
(very low).
OSM Map
General Map
Google Map
MSN Map
OSM Map
General Map
Google Map
MSN Map
OSM Map
General Map
Google Map
MSN Map
OSM Map
General Map
Google Map
MSN Map
Please wait while loading the map...
Real estate property taxes paid for housing units in 2022:
This zip code:
0.8% ($1,316)
Ohio:
1.3% ($2,639)
Median real estate property taxes paid for housing units with mortgages in 2022: $1,246 (0.7%) Median real estate property taxes paid for housing units with no mortgage in 2022: $1,542 (1.1%)
Business Search- 14 Million verified businesses
Males: 1,545
(54.2%)
Females: 1,305
(45.8%)
For population 25 years and over in 43730:
High school or higher: 77.6%
Bachelor's degree or higher: 6.7%
Graduate or professional degree: 3.2%
Unemployed: 3.8%
Mean travel time to work (commute): 40.5 minutes
For population 15 years and over in 43730:
Never married: 33.0%
Now married: 47.4%
Separated: 1.8%
Widowed: 6.1%
Divorced: 11.7%
Zip code 43730 compared to state average:
Black race population percentage significantly below state average.
Hispanic race population percentage significantly below state average.
Foreign-born population percentage significantly below state average.
Renting percentage below state average.
Length of stay since moving in significantly above state average.
Number of college students significantly below state average.
Percentage of population with a bachelor's degree or higher significantly below state average.
Averages for the 2020 tax year for zip code 43730, filed in 2021:
Average Adjusted Gross Income (AGI) in 2020: $44,447 (Individual Income Tax Returns)
Here:
$44,447
State:
$67,288
Salary/wage: $41,494 (reported on 82.0% of returns)
Here:
$41,494
State:
$55,628
(% of AGI for various income ranges: 1109.6% for AGIs below $25k, 3458.8% for AGIs $25k-50k, 5870.0% for AGIs $50k-75k, 11025.0% for AGIs $75k-100k, 13158.3% for AGIs $100k-200k)
Taxable interest for individuals: $429 (reported on 17.0% of returns)
This zip code:
$429
Ohio:
$1,518
(% of AGI for various income ranges: 2.6% for AGIs below $25k, 15.4% for AGIs $25k-50k, 5.0% for AGIs $50k-75k, 23.3% for AGIs $75k-100k, 13.3% for AGIs $100k-200k)
Ordinary dividends: $2,960 (reported on 5.0% of returns)
Here:
$2,960
State:
$7,167
(% of AGI for various income ranges: 9.3% for AGIs below $25k, 87.9% for AGIs $50k-75k)
Net capital gain/loss in AGI: +$2,860 (reported on 5.0% of returns)
Here:
+$2,860
State:
+$18,919
(% of AGI for various income ranges: 16.7% for AGIs below $25k, 163.3% for AGIs $75k-100k)
Profit/loss from business: +$5,092 (reported on 13.0% of returns)
Here:
+$5,092
State:
+$13,744
(% of AGI for various income ranges: 77.4% for AGIs below $25k, 175.4% for AGIs $25k-50k, 53.3% for AGIs $75k-100k)
Taxable individual retirement arrangement distribution: $9,040 (reported on 5.0% of returns)
43730:
$9,040
Ohio:
$18,876
(% of AGI for various income ranges: 68.5% for AGIs below $25k, 190.7% for AGIs $50k-75k)
Earned income credit: $2,168 (reported on 22.0% of returns)
Here:
$2,168
State:
$2,304
(% of AGI for various income ranges: 104.4% for AGIs below $25k, 81.2% for AGIs $25k-50k)
Percentage of individuals using paid preparers for their 2020 taxes: 93.0%
Here:
93%
State:
94%
(% for various income ranges: 91.7% for AGIs below $25k, 96.7% for AGIs $25k-50k, 94.1% for AGIs $50k-75k, 88.9% for AGIs $75k-100k, 87.5% for AGIs $100k-200k)
Averages for the 2012 tax year for zip code 43730, filed in 2013:
Average Adjusted Gross Income (AGI) in 2012: $37,326 (Individual Income Tax Returns)
Here:
$37,326
State:
$54,926
Salary/wage: $35,156 (reported on 86.3% of returns)
Here:
$35,156
State:
$45,869
(% of AGI for various income ranges: 71.7% for AGIs below $25k, 81.9% for AGIs $25k-50k, 84.6% for AGIs $50k-75k, 87.1% for AGIs $75k-100k, 75.7% for AGIs $100k-200k)
Taxable interest for individuals: $650 (reported on 18.9% of returns)
This zip code:
$650
Ohio:
$1,297
(% of AGI for various income ranges: 0.8% for AGIs below $25k, 0.2% for AGIs $25k-50k, 0.5% for AGIs $50k-75k, 0.3% for AGIs $75k-100k)
Ordinary dividends: $1,283 (reported on 6.3% of returns)
Here:
$1,283
State:
$5,821
(% of AGI for various income ranges: 0.3% for AGIs $25k-50k, 0.6% for AGIs $75k-100k)
Net capital gain/loss in AGI: +$167 (reported on 3.2% of returns)
Here:
+$167
State:
+$11,232
Profit/loss from business: +$6,973 (reported on 11.6% of returns)
Here:
+$6,973
State:
+$12,773
(% of AGI for various income ranges: 5.9% for AGIs below $25k, 3.0% for AGIs $25k-50k, 2.4% for AGIs $75k-100k)
Taxable individual retirement arrangement distribution: $6,340 (reported on 5.3% of returns)
43730:
$6,340
Ohio:
$14,511
(% of AGI for various income ranges: 2.0% for AGIs $25k-50k, 1.3% for AGIs $50k-75k)
Total itemized deductions: $15,808 (26% of AGI, reported on 12.6% of returns)
Here:
$15,808
State:
$21,278
Here:
25.6% of AGI
State:
18.8% of AGI
(% of AGI for various income ranges: 5.9% for AGIs $25k-50k, 7.1% for AGIs $50k-75k, 9.8% for AGIs $75k-100k)
Charity contributions: $1,800 (reported on 7.4% of returns)
Here:
$1,800
State:
$3,943
(% of AGI for various income ranges: 0.5% for AGIs $25k-50k, 1.1% for AGIs $75k-100k)
Taxes paid: $3,867 (reported on 12.6% of returns)
43730:
$3,867
State:
$9,568
(% of AGI for various income ranges: 1.1% for AGIs $25k-50k, 1.5% for AGIs $50k-75k, 3.2% for AGIs $75k-100k)
Earned income credit: $2,173 (reported on 23.2% of returns)
Here:
$2,173
State:
$2,285
(% of AGI for various income ranges: 7.6% for AGIs below $25k, 1.0% for AGIs $25k-50k)
Percentage of individuals using paid preparers for their 2012 taxes: 35.8%
Here:
36%
State:
51%
(% for various income ranges: 31.7% for AGIs below $25k, 32.1% for AGIs $25k-50k, 50.0% for AGIs $50k-75k, 37.5% for AGIs $75k-100k, 50.0% for AGIs $100k-200k)
Averages for the 2004 tax year for zip code 43730, filed in 2005:
Average Adjusted Gross Income (AGI) in 2004: $29,415 (Individual Income Tax Returns)
Here:
$29,415
State:
$44,480
Salary/wage: $27,683 (reported on 87.9% of returns)
Here:
$27,683
State:
$39,198
(% of AGI for various income ranges: 82.9% for AGIs below $10k, 78.5% for AGIs $10k-25k, 83.8% for AGIs $25k-50k, 85.4% for AGIs $50k-75k, 78.0% for AGIs $75k-100k)
Taxable interest for individuals: $978 (reported on 25.8% of returns)
This zip code:
$978
Ohio:
$1,532
(% of AGI for various income ranges: 2.4% for AGIs below $10k, 0.7% for AGIs $10k-25k, 0.8% for AGIs $25k-50k, 1.0% for AGIs $50k-75k, 0.2% for AGIs $75k-100k)
Taxable dividends: $826 (reported on 8.2% of returns)
Here:
$826
State:
$3,496
Profit/loss from business: +$4,110 (reported on 11.3% of returns)
Here:
+$4,110
State:
+$10,813
(% of AGI for various income ranges: 5.8% for AGIs below $10k, 3.0% for AGIs $10k-25k, 1.8% for AGIs $25k-50k, 0.6% for AGIs $50k-75k)
IRA payment deduction: $2,000 (reported on 1.0% of returns)
43730:
$2,000
Ohio:
$2,794
Total itemized deductions: $12,317 (24% of AGI, reported on 11.8% of returns)
Here:
$12,317
State:
$17,503
Here:
24.1% of AGI
State:
20.8% of AGI
(% of AGI for various income ranges: 1.8% for AGIs $10k-25k, 5.5% for AGIs $25k-50k, 6.2% for AGIs $50k-75k, 5.7% for AGIs $75k-100k)
Charity contributions deductions: $1,262 (2% of AGI, reported on 7.7% of returns)
Here:
$1,262
State:
$3,087
Here:
2.4% of AGI
State:
3.4% of AGI
Total tax: $2,830 (reported on 70.6% of returns)
43730:
$2,830
State:
$6,781
(% of AGI for various income ranges: 2.1% for AGIs below $10k, 3.7% for AGIs $10k-25k, 6.0% for AGIs $25k-50k, 8.3% for AGIs $50k-75k, 11.7% for AGIs $75k-100k)
Earned income credit: $1,620 (reported on 19.9% of returns)
Here:
$1,620
State:
$1,696
Percentage of individuals using paid preparers for their 2004 taxes: 49.6%
Here:
50%
State:
55%
(% for various income ranges: 40.4% for AGIs below $10k, 47.1% for AGIs $10k-25k, 55.2% for AGIs $25k-50k, 52.1% for AGIs $50k-75k, 61.1% for AGIs $75k-100k)
Household received Food Stamps/SNAP in the past 12 months: 162 Household did not receive Food Stamps/SNAP in the past 12 months: 780
Women who did not have a birth in the past 12 months: 639 (335 now married, 303 unmarried)
Housing units in zip code 43730 with a mortgage: 362 (38 second mortgage, 39 both second mortgage and home equity loan) Median monthly owner costs for units with a mortgage: $1,204 Median monthly owner costs for units without a mortgage: $387
Residents with income below the poverty level in 2022:
This zip code:
10.8%
Whole state:
13.4%
Residents with income below 50% of the poverty level in 2022:
This zip code:
5.7%
Whole state:
7.0%
Median number of rooms in houses and condos:
Here:
5.8
State:
6.7
Median number of rooms in apartments:
Here:
5.6
State:
4.4
Notable locations in this zip code not listed on our city pages
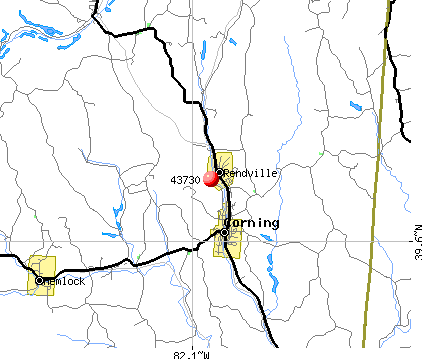
Churches in zip code 43730 include: Pleasant Grove Church (A), First Baptist Church of Rendville (B), Saint Bernard Catholic Church (C). Display/hide their locations on the map
Cemeteries: Springer Cemetery (1), Mount Carmel Cemetery (2), Monroe Cemetery (3), Harring Cemetery (4), Bethel Cemetery (5), Asberry Cemetery (6), Chapel Hill Cemetery (7). Display/hide their locations on the map
Reservoirs: Sunday Creek Coal Company Pond 9420-0 (A), San Toy Lake (B), Altiers Lake (C), New York Central Reservoir 9420 (D), Seimer Pond (E). Display/hide their locations on the map
243 married couples with children.
97 single-parent households (25 men, 72 women).
98.2% of residents of 43730 zip code speak English at home.
0.2% of residents speak Spanish at home (100% very well).
0.4% of residents speak other Indo-European language at home (100% very well).
0.4% of residents speak Asian or Pacific Island language at home (100% very well).
Foreign born population: 9 (0.3%) (0.0% of them are naturalized citizens)
:
0.3%
Whole state:
5.0%
100%United Kingdom, excluding England and Scotland
89%Sweden
27%English
18%American
10%Irish
10%German
5%Hungarian
4%Serbian
2%Italian
Year of entry for the foreign-born population
02010 or later
02000 to 2009
01990 to 1999
8Before 1990
Facilities with environmental interests located in this zip code:
BUCKINGHAM COAL CO UNDERGROUND MINE NO 7 (TWP RD 298 in CORNING, OH)
STATE MASTER (Ohio general info) - PCS-OH0134937, National Pollutant Discharge Elimination System Permit National Pollutant Discharge Elimination System NON-MAJOR (Tracking pollutant discharge elimination systems) - permit Business SIC classification: BITUMINOUS COAL UNDERGROUND MINING
BUCKINGHAM COAL CO (TWP RD 295 in CORNING, OH)
National Pollutant Discharge Elimination System NON-MAJOR (Tracking pollutant discharge elimination systems) - permit Business SIC classification: BITUMINOUS COAL UNDERGROUND MINING
Housing units lacking complete plumbing facilities: 12.3% Housing units lacking complete kitchen facilities: 13.4%
34.9%Electricity
32.2%Utility gas
13.9%Bottled, tank, or LP gas
12.1%Wood
6.2%Fuel oil, kerosene, etc.
0.9%Other fuel
Population in 1990: 3,374.
Place of birth for U.S.-born residents:
This state: 2,582
Northeast: 52
Midwest: 35
South: 129
West: 36
76% of the 43730 zip code residents lived in the same house 5 years ago. Out of people who lived in different houses, 59% lived in this county. Out of people who lived in different counties, 50% lived in Ohio.
88% of the 43730 zip code residents lived in the same house 1 year ago. Out of people who lived in different houses, 38% moved from this county. Out of people who lived in different houses, 55% moved from different county within same state. Out of people who lived in different houses, 7% moved from different state.
Private vs. public school enrollment:
Students in private schools in grades 1 to 8 (elementary and middle school): 40
Here:
18.5%
Ohio:
16.0%
Students in private schools in grades 9 to 12 (high school): 1
Here:
0.9%
Ohio:
13.1%
Students in private undergraduate colleges:
Here:
0.0%
Ohio:
22.3%
Occupation by median earnings in the past 12 months ($)
97,003Transportation occupations
57,242Law enforcement workers including supervisors
45,988Production occupations
43,600Building and grounds cleaning and maintenance occupations
40,599Business and financial operations occupations
38,348Office and administrative support occupations
Companies with federal contracts located in this zip code:
AWT SERVICES INC (9320 TOWNSHIP RD 295 in CORNING, OH; small business) : $613,022 in 15 contractsfrom 2003 to 2005
Contracts for Maintenance, Repair and Rebuilding of Equipment -- Service and Trade Equipment, Construction of Structures and Facilities -- Highways, Roads, Streets, Bridges, and Railways (includes resurfacing), Maintenance, Repair and Rebuilding of Equipment -- Materials Handling Equipment, Maintenance, Repair and Rebuilding of Equipment -- Prefabricated Structures and Scaffolding, and moreby Defense Commissary Agency, Forest Service, Department of Veterans Affairs, Bureau of the Census, and others Signed by year:2000: $0; 2001: $0; 2002: $0; 2003: $139,777; 2004: $113,465; 2005: $359,780; 2006: $0.
Biggest contracts:
$241,610 with Defense Commissary Agency for Maintenance, Repair and Rebuilding of Equipment -- Service and Trade Equipment. Taking place in AL. Signed on 2005-09-20. Completion date: 2006-07-31.
$110,493 with Forest Service for Construction of Structures and Facilities -- Highways, Roads, Streets, Bridges, and Railways (includes resurfacing). Signed on 2003-06-15. Completion date: 2003-10-15.
$43,561 with Department of Veterans Affairs for Maintenance, Repair and Rebuilding of Equipment -- Materials Handling Equipment. Taking place in IL. Signed on 2005-10-01. Completion date: 2006-09-30.
$43,484 with Defense Commissary Agency for Maintenance, Repair and Rebuilding of Equipment -- Service and Trade Equipment. Taking place in NM. Signed on 2005-09-06. Completion date: 2005-08-31.
A C E R / A W T SERVICES INC (9320 TOWNSHIP RD 295 in CORNING, OH; small business) : $351,467 in 8 contractsfrom 2002 to 2006
Contracts for Maintenance, Repair and Rebuilding of Equipment -- Service and Trade Equipment, Maintenance, Repair or Alteration of Real Property -- Food or Grain Storage Buildings, Fire Protection Services by Defense Commissary Agency, Department of Defense, Air Force Signed by year:2000: $0; 2001: $0; 2002: $124,007; 2003: $64,224; 2004: $64,224; 2005: $65,192; 2006: $33,820.
Biggest contracts:
$65,192 with Defense Commissary Agency for Maintenance, Repair and Rebuilding of Equipment -- Service and Trade Equipment. Taking place in TX. Signed on 2005-11-30. Completion date: 2004-11-30.
$64,224, same as above.Signed on 2004-10-26. Completion date: 2004-11-30.
$64,224, same as above.Signed on 2003-10-31. Completion date: 2004-11-30.
$63,784 with Department of Defense for Maintenance, Repair and Rebuilding of Equipment -- Service and Trade Equipment. Taking place in TX. Signed on 2002-11-20. Completion date: 2003-11-30.
PERRY RECLAIMING, INC (5033 STATE ROUTE 13 SE in CORNING, OH; small business) : $6,652 in 2 contractsin 2004
$3,326 with Army for Mining, Rock Drilling, Earth Boring and Related Equipment. Signed on 2004-08-06. Completion date: 2004-07-19.
$3,326 with U.S. Army Corps of Engineers - civil program financing only for Mining, Rock Drilling, Earth Boring and Related Equipment. Signed on 2004-08-06. Completion date: 2004-07-19.
Top industries in this zip code by the number of employees in 2005:
Mining: Support Activities for Oil and Gas Operations (20-49 employees: 1 establishment)
Information: Cellular and Other Wireless Telecommunications (20-49: 1)
Mining: Crude Petroleum and Natural Gas Extraction (10-19: 1, 1-4: 1)
Educational Services: Elementary and Secondary Schools (10-19: 1)
Construction: Site Preparation Contractors (5-9: 1, 1-4: 2)
Finance and Insurance: Commercial Banking (5-9: 1)
Other Services (except Public Administration): Civic and Social Organizations (5-9: 1)
Fatal accident statistics in 2013:
Fatal accident count: 1
Vehicles involved in fatal accidents: 1
Fatal accidents caused by drunken drivers: 1
Fatalities: 1
Persons involved in fatal accidents: 1
Pedestrians involved in fatal accidents: 0
2002 - 2018 National Fire Incident Reporting System (NFIRS) incidents
According to the data from the years 2002 - 2018 the average number of fires per year is 22. The highest number of reported fire incidents - 38 took place in 2018, and the least - 10 in 2004. The data has a growing trend.
When looking into fire subcategories, the most reports belonged to: Structure Fires (64.6%), and Outside Fires (24.3%).
Fire incident types reported to NFIRS in Zip Code 43730


 Nearest zip codes: 43761, 45732, 43782, 43731, 43144, 43764.


 According to the data from the years 2002 - 2018 the average number of fires per year is 22. The highest number of reported fire incidents - 38 took place in 2018, and the least - 10 in 2004. The data has a growing trend.
 When looking into fire subcategories, the most reports belonged to: Structure Fires (64.6%), and Outside Fires (24.3%).