Estimated zip code population in 2022: 2,151 Zip code population in 2010: 2,407 Zip code population in 2000: 2,463
Houses and condos: 981 Renter-occupied apartments: 218
% of renters here:
26%
State:
33%
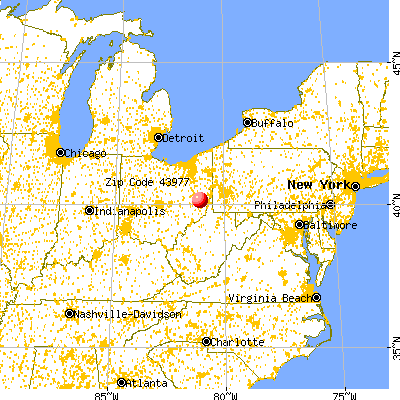
March 2022 cost of living index in zip code 43977: 82.5 (low, U.S. average is 100)
Land area: 46.0 sq. mi. Water area: 2.1 sq. mi.
Population density: 47 people per square mile
(very low).
OSM Map
General Map
Google Map
MSN Map
OSM Map
General Map
Google Map
MSN Map
OSM Map
General Map
Google Map
MSN Map
OSM Map
General Map
Google Map
MSN Map
Please wait while loading the map...
Real estate property taxes paid for housing units in 2022:
This zip code:
0.9% ($1,091)
Ohio:
1.3% ($2,639)
Median real estate property taxes paid for housing units with mortgages in 2022: $1,566 (1.0%) Median real estate property taxes paid for housing units with no mortgage in 2022: $909 (1.0%)
Business Search- 14 Million verified businesses
Males: 1,109
(51.5%)
Females: 1,042
(48.5%)
For population 25 years and over in 43977:
High school or higher: 94.7%
Bachelor's degree or higher: 12.4%
Graduate or professional degree: 3.3%
Unemployed: 3.4%
Mean travel time to work (commute): 27.7 minutes
For population 15 years and over in 43977:
Never married: 32.5%
Now married: 48.2%
Separated: 3.7%
Widowed: 5.9%
Divorced: 9.8%
Zip code 43977 compared to state average:
Median house value below state average.
Black race population percentage significantly below state average.
Hispanic race population percentage significantly below state average.
Foreign-born population percentage significantly below state average.
Length of stay since moving in significantly above state average.
Number of college students below state average.
Percentage of population with a bachelor's degree or higher significantly below state average.
Averages for the 2020 tax year for zip code 43977, filed in 2021:
Average Adjusted Gross Income (AGI) in 2020: $46,858 (Individual Income Tax Returns)
Here:
$46,858
State:
$67,288
Salary/wage: $41,691 (reported on 81.4% of returns)
Here:
$41,691
State:
$55,628
(% of AGI for various income ranges: 1003.3% for AGIs below $25k, 3396.1% for AGIs $25k-50k, 6194.6% for AGIs $50k-75k, 9335.0% for AGIs $75k-100k, 15105.0% for AGIs $100k-200k)
Taxable interest for individuals: $1,050 (reported on 20.6% of returns)
This zip code:
$1,050
Ohio:
$1,518
(% of AGI for various income ranges: 5.4% for AGIs below $25k, 19.1% for AGIs $25k-50k, 19.2% for AGIs $50k-75k, 15.0% for AGIs $75k-100k, 198.3% for AGIs $100k-200k)
Ordinary dividends: $1,960 (reported on 10.3% of returns)
Here:
$1,960
State:
$7,167
(% of AGI for various income ranges: 16.2% for AGIs below $25k, 13.9% for AGIs $25k-50k, 40.8% for AGIs $50k-75k, 120.0% for AGIs $100k-200k)
Net capital gain/loss in AGI: +$9,433 (reported on 9.3% of returns)
Here:
+$9,433
State:
+$18,919
(% of AGI for various income ranges: 40.4% for AGIs $25k-50k, 20.0% for AGIs $50k-75k, 1216.7% for AGIs $100k-200k)
Profit/loss from business: +$10,450 (reported on 10.3% of returns)
Here:
+$10,450
State:
+$13,744
(% of AGI for various income ranges: 152.1% for AGIs below $25k, 148.5% for AGIs $50k-75k, 811.7% for AGIs $100k-200k)
Taxable individual retirement arrangement distribution: $13,929 (reported on 7.2% of returns)
43977:
$13,929
Ohio:
$18,876
(% of AGI for various income ranges: 129.6% for AGIs below $25k, 510.8% for AGIs $50k-75k)
Earned income credit: $2,144 (reported on 16.5% of returns)
Here:
$2,144
State:
$2,304
(% of AGI for various income ranges: 94.6% for AGIs below $25k, 50.4% for AGIs $25k-50k)
Percentage of individuals using paid preparers for their 2020 taxes: 94.8%
Here:
95%
State:
94%
(% for various income ranges: 93.9% for AGIs below $25k, 96.6% for AGIs $25k-50k, 94.1% for AGIs $50k-75k, 100.0% for AGIs $75k-100k, 90.0% for AGIs $100k-200k)
Averages for the 2012 tax year for zip code 43977, filed in 2013:
Average Adjusted Gross Income (AGI) in 2012: $44,149 (Individual Income Tax Returns)
Here:
$44,149
State:
$54,926
Salary/wage: $35,736 (reported on 85.7% of returns)
Here:
$35,736
State:
$45,869
(% of AGI for various income ranges: 77.1% for AGIs below $25k, 79.5% for AGIs $25k-50k, 75.3% for AGIs $50k-75k, 75.7% for AGIs $75k-100k, 50.8% for AGIs $100k-200k)
Taxable interest for individuals: $752 (reported on 29.6% of returns)
This zip code:
$752
Ohio:
$1,297
(% of AGI for various income ranges: 1.3% for AGIs below $25k, 0.8% for AGIs $25k-50k, 0.3% for AGIs $50k-75k, 0.4% for AGIs $75k-100k, 0.2% for AGIs $100k-200k)
Ordinary dividends: $1,327 (reported on 11.2% of returns)
Here:
$1,327
State:
$5,821
(% of AGI for various income ranges: 0.8% for AGIs below $25k, 0.5% for AGIs $25k-50k, 0.6% for AGIs $75k-100k, 0.2% for AGIs $100k-200k)
Net capital gain/loss in AGI: +$943 (reported on 7.1% of returns)
Here:
+$943
State:
+$11,232
(% of AGI for various income ranges: 1.1% for AGIs $75k-100k)
Profit/loss from business: +$8,600 (reported on 10.2% of returns)
Here:
+$8,600
State:
+$12,773
(% of AGI for various income ranges: 3.9% for AGIs below $25k, 3.6% for AGIs $25k-50k, 4.6% for AGIs $75k-100k)
Taxable individual retirement arrangement distribution: $8,714 (reported on 7.1% of returns)
43977:
$8,714
Ohio:
$14,511
(% of AGI for various income ranges: 1.8% for AGIs below $25k, 2.6% for AGIs $25k-50k, 3.8% for AGIs $75k-100k)
Total itemized deductions: $21,230 (20% of AGI, reported on 10.2% of returns)
Here:
$21,230
State:
$21,278
Here:
19.9% of AGI
State:
18.8% of AGI
(% of AGI for various income ranges: 7.3% for AGIs $25k-50k, 5.4% for AGIs $75k-100k, 8.4% for AGIs $100k-200k)
Charity contributions: $3,317 (reported on 6.1% of returns)
Here:
$3,317
State:
$3,943
(% of AGI for various income ranges: 0.8% for AGIs $50k-75k, 1.0% for AGIs $100k-200k)
Taxes paid: $7,300 (reported on 10.2% of returns)
43977:
$7,300
State:
$9,568
(% of AGI for various income ranges: 1.3% for AGIs $25k-50k, 1.4% for AGIs $75k-100k, 4.0% for AGIs $100k-200k)
Earned income credit: $2,037 (reported on 19.4% of returns)
Here:
$2,037
State:
$2,285
(% of AGI for various income ranges: 6.3% for AGIs below $25k, 1.0% for AGIs $25k-50k)
Percentage of individuals using paid preparers for their 2012 taxes: 56.1%
Here:
56%
State:
51%
(% for various income ranges: 47.5% for AGIs below $25k, 57.7% for AGIs $25k-50k, 66.7% for AGIs $50k-75k, 55.6% for AGIs $75k-100k, 75.0% for AGIs $100k-200k)
Averages for the 2004 tax year for zip code 43977, filed in 2005:
Average Adjusted Gross Income (AGI) in 2004: $29,501 (Individual Income Tax Returns)
Here:
$29,501
State:
$44,480
Salary/wage: $27,732 (reported on 85.7% of returns)
Here:
$27,732
State:
$39,198
(% of AGI for various income ranges: 79.7% for AGIs below $10k, 80.1% for AGIs $10k-25k, 81.1% for AGIs $25k-50k, 86.5% for AGIs $50k-75k, 86.3% for AGIs $75k-100k, 57.5% for AGIs over 100k)
Taxable interest for individuals: $1,346 (reported on 34.4% of returns)
This zip code:
$1,346
Ohio:
$1,532
(% of AGI for various income ranges: 1.7% for AGIs below $10k, 2.5% for AGIs $10k-25k, 2.2% for AGIs $25k-50k, 0.7% for AGIs $50k-75k, 0.2% for AGIs $75k-100k, 1.0% for AGIs over 100k)
Taxable dividends: $876 (reported on 12.0% of returns)
Here:
$876
State:
$3,496
Net capital gain/loss: +$1,303 (reported on 7.0% of returns)
Here:
+$1,303
State:
+$8,582
Profit/loss from business: +$4,439 (reported on 13.1% of returns)
Here:
+$4,439
State:
+$10,813
(% of AGI for various income ranges: 7.4% for AGIs below $10k, 3.9% for AGIs $10k-25k, 2.0% for AGIs $25k-50k, 1.1% for AGIs $50k-75k)
IRA payment deduction: $1,944 (reported on 1.9% of returns)
43977:
$1,944
Ohio:
$2,794
Total itemized deductions: $15,500 (24% of AGI, reported on 10.6% of returns)
Here:
$15,500
State:
$17,503
Here:
23.9% of AGI
State:
20.8% of AGI
(% of AGI for various income ranges: 10.6% for AGIs below $10k, 4.3% for AGIs $25k-50k, 5.6% for AGIs $50k-75k, 7.5% for AGIs $75k-100k, 16.9% for AGIs over 100k)
Charity contributions deductions: $3,061 (4% of AGI, reported on 7.0% of returns)
Here:
$3,061
State:
$3,087
Here:
4.4% of AGI
State:
3.4% of AGI
Total tax: $3,256 (reported on 72.5% of returns)
43977:
$3,256
State:
$6,781
(% of AGI for various income ranges: 2.0% for AGIs below $10k, 4.2% for AGIs $10k-25k, 6.5% for AGIs $25k-50k, 9.2% for AGIs $50k-75k, 11.9% for AGIs $75k-100k, 16.1% for AGIs over 100k)
Earned income credit: $1,482 (reported on 20.5% of returns)
Here:
$1,482
State:
$1,696
Percentage of individuals using paid preparers for their 2004 taxes: 62.2%
Here:
62%
State:
55%
(% for various income ranges: 58.5% for AGIs below $10k, 58.5% for AGIs $10k-25k, 69.1% for AGIs $25k-50k, 61.2% for AGIs $50k-75k, 59.0% for AGIs $75k-100k, 70.6% for AGIs over 100k)
Household received Food Stamps/SNAP in the past 12 months: 123 Household did not receive Food Stamps/SNAP in the past 12 months: 711
Women who had a birth in the past 12 months: 15 (3 now married, 12 unmarried) Women who did not have a birth in the past 12 months: 434 (232 now married, 201 unmarried)
Housing units in zip code 43977 with a mortgage: 230 (27 second mortgage, 9 home equity loan, 19 both second mortgage and home equity loan) Houses without a mortgage: 9
Median monthly owner costs for units with a mortgage: $1,142 Median monthly owner costs for units without a mortgage: $417
Residents with income below the poverty level in 2022:
This zip code:
11.0%
Whole state:
13.4%
Residents with income below 50% of the poverty level in 2022:
This zip code:
6.6%
Whole state:
7.0%
Median number of rooms in houses and condos:
Here:
6.2
State:
6.7
Median number of rooms in apartments:
Here:
4.8
State:
4.4
Notable locations in this zip code not listed on our city pages
Notable locations in zip code 43977: Lafferty Fire and Emergency Medical Services Station 27 (A), Flushing Volunteer Fire Department Station 24 (B). Display/hide their locations on the map
Cemeteries: Stillwater Cemetery (1), Crabapple Cemetery (2), Moorefield Methodist Episcopal Cemetery (3), Rockhill Cemetery (4), Flushing Township Cemetery (5), Flushing City Cemetery (6), Flushing Area Cemetery (7). Display/hide their locations on the map
Reservoirs: Consolidation Coal Company Pond 0110- (A), Ohnoname 31 Reservoir (B), Consolidation Coal Company Pond 0110- (C), B & O Railroad Pond Dam (D). Display/hide their locations on the map
In group quarters: 6 (-1 institutionalized population)
Size of family households: 254 2-persons, 145 3-persons, 106 4-persons, 34 5-persons, 12 6-persons, 7 7-or-more-persons
Size of nonfamily households: 215 1-person, 35 2-persons, 20 4-persons
267 married couples with children.
169 single-parent households (69 men, 100 women).
98.6% of residents of 43977 zip code speak English at home.
0.7% of residents speak Asian or Pacific Island language at home (64% very well, 36% well).
Foreign born population: 17 (0.8%) (41.6% of them are naturalized citizens)
This zip code:
0.8%
Whole state:
5.0%
47%Malaysia
35%Singapore
22%Italian
16%German
15%American
12%Irish
12%English
4%Polish
3%European
Year of entry for the foreign-born population
42010 or later
02000 to 2009
51990 to 1999
6Before 1990
Housing units lacking complete plumbing facilities: 2.3% Housing units lacking complete kitchen facilities: 3.1%
37.0%Utility gas
33.0%Electricity
10.3%Fuel oil, kerosene, etc.
9.4%Bottled, tank, or LP gas
7.1%Wood
3.6%Other fuel
Population in 1990: 2,719.
Place of birth for U.S.-born residents:
This state: 1,154
Northeast: 63
Midwest: 27
South: 820
West: 49
68% of the 43977 zip code residents lived in the same house 5 years ago. Out of people who lived in different houses, 57% lived in this county. Out of people who lived in different counties, 50% lived in Ohio.
94% of the 43977 zip code residents lived in the same house 1 year ago. Out of people who lived in different houses, 63% moved from this county. Out of people who lived in different houses, 29% moved from different county within same state. Out of people who lived in different houses, 10% moved from different state.
Private vs. public school enrollment:
Students in private schools in grades 1 to 8 (elementary and middle school): 10
Here:
4.9%
Ohio:
16.0%
Students in private schools in grades 9 to 12 (high school): 7
Here:
4.5%
Ohio:
13.1%
Students in private undergraduate colleges:
Here:
0.0%
Ohio:
22.3%
Occupation by median earnings in the past 12 months ($)
110,052Business and financial operations occupations
104,749Fire fighting and prevention, and other protective service workers including supervisors
66,384Health diagnosing and treating practitioners and other technical occupations
66,015Management occupations
57,262Health technologists and technicians
55,472Law enforcement workers including supervisors
Top industries in this zip code by the number of employees in 2005:
Professional, Scientific, and Technical Services: Surveying and Mapping (except Geophysical) Services (20-49 employees: 1 establishment)
Administrative and Support and Waste Management and Remediation Services: All Other Support Services (10-19: 1)
Wholesale Trade: Poultry and Poultry Product Merchant Wholesalers (10-19: 1)
Health Care and Social Assistance: Offices of Chiropractors (10-19: 1)
Finance and Insurance: Commercial Banking (5-9: 2)
Accommodation and Food Services: Limited-Service Restaurants (5-9: 1, 1-4: 1)
Professional, Scientific, and Technical Services: Drafting Services (5-9: 1)
Fatal accident statistics in 2012:
Fatal accident count: 1
Vehicles involved in fatal accidents: 1
Fatal accidents caused by drunken drivers: 1
Fatalities: 1
Persons involved in fatal accidents: 1
Pedestrians involved in fatal accidents: 0
Home Mortgage Disclosure Act Aggregated Statistics For Year 2009 (Based on 4 partial tracts)
A) FHA, FSA/RHS & VA Home Purchase Loans
B) Conventional Home Purchase Loans
C) Refinancings
D) Home Improvement Loans
F) Non-occupant Loans on < 5 Family Dwellings (A B C & D)
G) Loans On Manufactured Home Dwelling (A B C & D)
Number
Average Value
Number
Average Value
Number
Average Value
Number
Average Value
Number
Average Value
Number
Average Value
LOANS ORIGINATED
15
$126,417
20
$92,212
58
$140,481
14
$23,011
9
$80,747
5
$46,744
APPLICATIONS APPROVED, NOT ACCEPTED
1
$119,040
3
$99,790
1
$161,600
0
$0
0
$0
0
$0
APPLICATIONS DENIED
3
$92,033
5
$69,262
14
$101,576
8
$28,579
2
$42,765
3
$25,333
APPLICATIONS WITHDRAWN
0
$0
1
$98,880
15
$205,689
1
$9,700
2
$288,245
0
$0
FILES CLOSED FOR INCOMPLETENESS
1
$161,750
1
$31,740
1
$159,910
0
$0
0
$0
0
$0
Aggregated Statistics For Year 2008 (Based on 4 partial tracts)
A) FHA, FSA/RHS & VA Home Purchase Loans
B) Conventional Home Purchase Loans
C) Refinancings
D) Home Improvement Loans
F) Non-occupant Loans on < 5 Family Dwellings (A B C & D)
G) Loans On Manufactured Home Dwelling (A B C & D)
Number
Average Value
Number
Average Value
Number
Average Value
Number
Average Value
Number
Average Value
Number
Average Value
LOANS ORIGINATED
12
$95,401
21
$96,931
48
$100,588
7
$23,223
5
$77,904
4
$72,528
APPLICATIONS APPROVED, NOT ACCEPTED
0
$0
3
$65,257
2
$84,565
0
$0
0
$0
1
$122,210
APPLICATIONS DENIED
3
$104,707
10
$106,730
28
$84,302
10
$39,349
1
$50,890
2
$98,185
APPLICATIONS WITHDRAWN
1
$105,830
4
$172,185
13
$156,288
1
$197,520
1
$29,980
1
$41,440
FILES CLOSED FOR INCOMPLETENESS
1
$59,960
1
$169,910
1
$223,120
1
$24,500
0
$0
0
$0
Aggregated Statistics For Year 2007 (Based on 4 partial tracts)
A) FHA, FSA/RHS & VA Home Purchase Loans
B) Conventional Home Purchase Loans
C) Refinancings
D) Home Improvement Loans
F) Non-occupant Loans on < 5 Family Dwellings (A B C & D)
G) Loans On Manufactured Home Dwelling (A B C & D)
Number
Average Value
Number
Average Value
Number
Average Value
Number
Average Value
Number
Average Value
Number
Average Value
LOANS ORIGINATED
3
$75,410
46
$103,503
54
$84,495
33
$43,382
10
$58,473
7
$56,027
APPLICATIONS APPROVED, NOT ACCEPTED
0
$0
4
$124,335
14
$106,707
2
$24,400
0
$0
0
$0
APPLICATIONS DENIED
2
$46,735
14
$92,199
55
$92,816
14
$26,217
4
$82,592
4
$50,535
APPLICATIONS WITHDRAWN
0
$0
8
$112,955
22
$86,859
4
$27,335
2
$188,265
2
$48,500
FILES CLOSED FOR INCOMPLETENESS
1
$30,860
1
$171,950
7
$129,701
0
$0
0
$0
0
$0
Aggregated Statistics For Year 2006 (Based on 4 partial tracts)
A) FHA, FSA/RHS & VA Home Purchase Loans
B) Conventional Home Purchase Loans
C) Refinancings
D) Home Improvement Loans
F) Non-occupant Loans on < 5 Family Dwellings (A B C & D)
G) Loans On Manufactured Home Dwelling (A B C & D)
Number
Average Value
Number
Average Value
Number
Average Value
Number
Average Value
Number
Average Value
Number
Average Value
LOANS ORIGINATED
6
$70,008
45
$112,620
57
$83,196
28
$33,298
9
$64,019
6
$37,022
APPLICATIONS APPROVED, NOT ACCEPTED
0
$0
6
$90,865
9
$97,164
2
$22,925
0
$0
0
$0
APPLICATIONS DENIED
1
$29,100
8
$100,179
52
$101,968
20
$33,212
2
$51,145
5
$52,052
APPLICATIONS WITHDRAWN
1
$22,050
5
$133,690
22
$94,946
3
$40,290
0
$0
1
$46,460
FILES CLOSED FOR INCOMPLETENESS
0
$0
3
$95,823
9
$145,477
0
$0
0
$0
0
$0
Aggregated Statistics For Year 2005 (Based on 4 partial tracts)
A) FHA, FSA/RHS & VA Home Purchase Loans
B) Conventional Home Purchase Loans
C) Refinancings
D) Home Improvement Loans
F) Non-occupant Loans on < 5 Family Dwellings (A B C & D)
G) Loans On Manufactured Home Dwelling (A B C & D)
Number
Average Value
Number
Average Value
Number
Average Value
Number
Average Value
Number
Average Value
Number
Average Value
LOANS ORIGINATED
9
$60,561
45
$103,962
49
$89,948
27
$32,438
9
$47,900
8
$48,702
APPLICATIONS APPROVED, NOT ACCEPTED
0
$0
8
$113,026
17
$60,803
2
$38,200
1
$49,340
3
$38,403
APPLICATIONS DENIED
2
$26,015
19
$89,221
61
$78,969
20
$30,864
2
$37,695
13
$53,992
APPLICATIONS WITHDRAWN
0
$0
6
$145,615
33
$96,054
3
$70,810
1
$142,950
2
$73,085
FILES CLOSED FOR INCOMPLETENESS
1
$26,450
1
$141,090
6
$64,047
0
$0
0
$0
0
$0
Aggregated Statistics For Year 2004 (Based on 4 partial tracts)
A) FHA, FSA/RHS & VA Home Purchase Loans
B) Conventional Home Purchase Loans
C) Refinancings
D) Home Improvement Loans
F) Non-occupant Loans on < 5 Family Dwellings (A B C & D)
G) Loans On Manufactured Home Dwelling (A B C & D)
Number
Average Value
Number
Average Value
Number
Average Value
Number
Average Value
Number
Average Value
Number
Average Value
LOANS ORIGINATED
7
$94,310
42
$91,987
70
$98,181
14
$31,657
12
$56,822
7
$67,744
APPLICATIONS APPROVED, NOT ACCEPTED
0
$0
5
$115,362
15
$76,161
4
$57,975
0
$0
2
$64,370
APPLICATIONS DENIED
1
$55,850
16
$62,654
56
$74,453
15
$19,411
1
$88,040
6
$60,793
APPLICATIONS WITHDRAWN
0
$0
6
$79,118
33
$85,585
1
$132,270
0
$0
3
$44,663
FILES CLOSED FOR INCOMPLETENESS
0
$0
2
$134,400
7
$96,730
1
$63,490
1
$94,480
2
$70,025
Aggregated Statistics For Year 2003 (Based on 4 partial tracts)
A) FHA, FSA/RHS & VA Home Purchase Loans
B) Conventional Home Purchase Loans
C) Refinancings
D) Home Improvement Loans
F) Non-occupant Loans on < 5 Family Dwellings (A B C & D)
Number
Average Value
Number
Average Value
Number
Average Value
Number
Average Value
Number
Average Value
LOANS ORIGINATED
3
$57,620
44
$103,681
122
$99,269
19
$13,577
6
$79,918
APPLICATIONS APPROVED, NOT ACCEPTED
0
$0
4
$62,262
29
$82,774
3
$24,040
2
$27,335
APPLICATIONS DENIED
1
$40,290
17
$57,276
49
$69,589
8
$10,420
1
$42,330
APPLICATIONS WITHDRAWN
0
$0
5
$81,346
27
$87,519
2
$11,955
0
$0
FILES CLOSED FOR INCOMPLETENESS
4
$64,445
3
$112,687
7
$95,893
0
$0
1
$94,310
Aggregated Statistics For Year 2002 (Based on 4 partial tracts)
A) FHA, FSA/RHS & VA Home Purchase Loans
B) Conventional Home Purchase Loans
C) Refinancings
D) Home Improvement Loans
F) Non-occupant Loans on < 5 Family Dwellings (A B C & D)
Number
Average Value
Number
Average Value
Number
Average Value
Number
Average Value
Number
Average Value
LOANS ORIGINATED
6
$84,180
37
$86,342
82
$83,252
15
$21,697
3
$39,680
APPLICATIONS APPROVED, NOT ACCEPTED
0
$0
4
$38,875
29
$61,679
4
$12,698
0
$0
APPLICATIONS DENIED
1
$79,360
14
$50,979
61
$56,375
8
$12,034
3
$31,743
APPLICATIONS WITHDRAWN
0
$0
3
$54,147
14
$56,453
1
$17,640
1
$28,220
FILES CLOSED FOR INCOMPLETENESS
4
$73,285
2
$101,925
6
$65,517
0
$0
0
$0
Aggregated Statistics For Year 2001 (Based on 4 partial tracts)
A) FHA, FSA/RHS & VA Home Purchase Loans
B) Conventional Home Purchase Loans
C) Refinancings
D) Home Improvement Loans
F) Non-occupant Loans on < 5 Family Dwellings (A B C & D)
Number
Average Value
Number
Average Value
Number
Average Value
Number
Average Value
Number
Average Value
LOANS ORIGINATED
4
$52,002
37
$64,589
80
$74,412
20
$18,374
4
$26,895
APPLICATIONS APPROVED, NOT ACCEPTED
0
$0
7
$41,651
21
$56,381
8
$19,575
0
$0
APPLICATIONS DENIED
0
$0
16
$42,784
37
$74,199
10
$13,748
1
$62,250
APPLICATIONS WITHDRAWN
0
$0
1
$40,740
25
$57,984
2
$7,290
0
$0
FILES CLOSED FOR INCOMPLETENESS
0
$0
0
$0
8
$64,445
0
$0
0
$0
Aggregated Statistics For Year 2000 (Based on 4 partial tracts)
A) FHA, FSA/RHS & VA Home Purchase Loans
B) Conventional Home Purchase Loans
C) Refinancings
D) Home Improvement Loans
F) Non-occupant Loans on < 5 Family Dwellings (A B C & D)
Number
Average Value
Number
Average Value
Number
Average Value
Number
Average Value
Number
Average Value
LOANS ORIGINATED
5
$62,336
30
$72,311
35
$60,036
22
$15,655
4
$33,848
APPLICATIONS APPROVED, NOT ACCEPTED
0
$0
9
$40,177
16
$62,634
4
$16,902
0
$0
APPLICATIONS DENIED
2
$33,070
27
$53,979
43
$47,649
4
$8,158
3
$44,677
APPLICATIONS WITHDRAWN
0
$0
5
$56,234
28
$58,635
0
$0
0
$0
FILES CLOSED FOR INCOMPLETENESS
0
$0
0
$0
6
$50,310
0
$0
0
$0
Aggregated Statistics For Year 1999 (Based on 2 partial tracts)
A) FHA, FSA/RHS & VA Home Purchase Loans
B) Conventional Home Purchase Loans
C) Refinancings
D) Home Improvement Loans
F) Non-occupant Loans on < 5 Family Dwellings (A B C & D)
Detailed PMIC statistics for the following Tracts:0106.00
, 0107.00
2002 - 2018 National Fire Incident Reporting System (NFIRS) incidents
According to the data from the years 2002 - 2018 the average number of fire incidents per year is 17. The highest number of reported fires - 38 took place in 2008, and the least - 4 in 2004. The data has a declining trend.
When looking into fire subcategories, the most incidents belonged to: Structure Fires (73.4%), and Outside Fires (17.7%).
Fire incident types reported to NFIRS in Zip Code 43977


 Nearest zip codes: 43985, 43759, 43951, 43972, 43983, 43907.


 According to the data from the years 2002 - 2018 the average number of fire incidents per year is 17. The highest number of reported fires - 38 took place in 2008, and the least - 4 in 2004. The data has a declining trend.
 When looking into fire subcategories, the most incidents belonged to: Structure Fires (73.4%), and Outside Fires (17.7%).