Estimated zip code population in 2022: 5,346 Zip code population in 2010: 4,557 Zip code population in 2000: 4,150
Houses and condos: 2,294 Renter-occupied apartments: 328
% of renters here:
16%
State:
33%
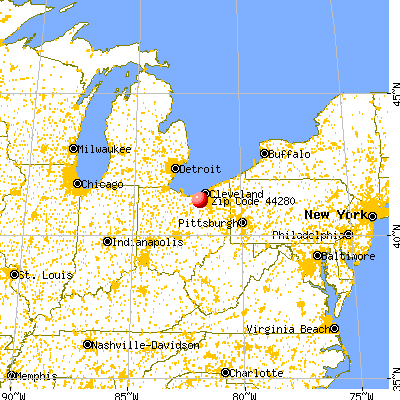
March 2022 cost of living index in zip code 44280: 88.2 (less than average, U.S. average is 100)
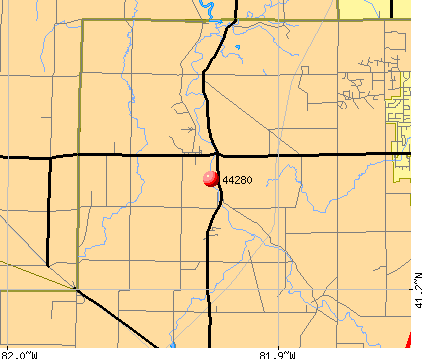
Land area: 24.5 sq. mi. Water area: 0.0 sq. mi.
Population density: 218 people per square mile
(very low).
OSM Map
General Map
Google Map
MSN Map
OSM Map
General Map
Google Map
MSN Map
OSM Map
General Map
Google Map
MSN Map
OSM Map
General Map
Google Map
MSN Map
Please wait while loading the map...
Real estate property taxes paid for housing units in 2022:
This zip code:
1.0% ($3,689)
Ohio:
1.3% ($2,639)
Median real estate property taxes paid for housing units with mortgages in 2022: $3,720 (0.9%) Median real estate property taxes paid for housing units with no mortgage in 2022: $3,655 (1.2%)
Business Search- 14 Million verified businesses
Males: 2,660
(49.8%)
Females: 2,685
(50.2%)
For population 25 years and over in 44280:
High school or higher: 95.2%
Bachelor's degree or higher: 38.9%
Graduate or professional degree: 14.0%
Unemployed: 1.2%
Mean travel time to work (commute): 24.8 minutes
For population 15 years and over in 44280:
Never married: 21.8%
Now married: 65.1%
Separated: 0.3%
Widowed: 4.9%
Divorced: 7.9%
Zip code 44280 compared to state average:
Median household income above state average.
Median house value above state average.
Unemployed percentage significantly below state average.
Black race population percentage significantly below state average.
Hispanic race population percentage significantly below state average.
Median age significantly above state average.
Foreign-born population percentage significantly below state average.
Renting percentage below state average.
Length of stay since moving in significantly above state average.
Estimated median house/condo value in 2022: $362,659
44280:
$362,659
Ohio:
$204,100
According to our research of Ohio and other state lists, there were 4 registered sex offenders living in 44280 zip code as of June 08, 2024. The ratio of all residents to sex offenders in zip code 44280 is 1,134 to 1. The ratio of registered sex offenders to all residents in this zip code is lower than the state average.
Median resident age:
This zip code:
49.3 years
Ohio median age:
39.9 years
Average household size:
This zip code:
2.5 people
Ohio:
2.4 people
Averages for the 2020 tax year for zip code 44280, filed in 2021:
Average Adjusted Gross Income (AGI) in 2020: $82,805 (Individual Income Tax Returns)
Here:
$82,805
State:
$67,288
Salary/wage: $71,317 (reported on 78.4% of returns)
Here:
$71,317
State:
$55,628
(% of AGI for various income ranges: 1215.3% for AGIs below $25k, 3322.1% for AGIs $25k-50k, 6440.6% for AGIs $50k-75k, 9093.0% for AGIs $75k-100k, 17436.3% for AGIs $100k-200k, 66472.9% for AGIs over 200k)
Taxable interest for individuals: $1,423 (reported on 39.7% of returns)
This zip code:
$1,423
Ohio:
$1,518
(% of AGI for various income ranges: 25.3% for AGIs below $25k, 53.3% for AGIs $25k-50k, 52.9% for AGIs $50k-75k, 64.8% for AGIs $75k-100k, 103.7% for AGIs $100k-200k, 1004.3% for AGIs over 200k)
Ordinary dividends: $5,049 (reported on 27.0% of returns)
Here:
$5,049
State:
$7,167
(% of AGI for various income ranges: 46.7% for AGIs below $25k, 74.3% for AGIs $25k-50k, 94.0% for AGIs $50k-75k, 104.8% for AGIs $75k-100k, 270.3% for AGIs $100k-200k, 3077.1% for AGIs over 200k)
Net capital gain/loss in AGI: +$10,904 (reported on 24.8% of returns)
Here:
+$10,904
State:
+$18,919
(% of AGI for various income ranges: 29.0% for AGIs below $25k, 63.6% for AGIs $25k-50k, 38.9% for AGIs $50k-75k, 210.9% for AGIs $75k-100k, 537.6% for AGIs $100k-200k, 7760.0% for AGIs over 200k)
Profit/loss from business: +$12,179 (reported on 14.9% of returns)
Here:
+$12,179
State:
+$13,744
(% of AGI for various income ranges: 121.2% for AGIs below $25k, 141.7% for AGIs $25k-50k, 190.6% for AGIs $50k-75k, 67.4% for AGIs $75k-100k, 372.1% for AGIs $100k-200k, 3284.3% for AGIs over 200k)
Taxable individual retirement arrangement distribution: $20,433 (reported on 14.6% of returns)
44280:
$20,433
Ohio:
$18,876
(% of AGI for various income ranges: 95.5% for AGIs below $25k, 262.4% for AGIs $25k-50k, 264.3% for AGIs $50k-75k, 575.2% for AGIs $75k-100k, 947.4% for AGIs $100k-200k, 2830.0% for AGIs over 200k)
Total itemized deductions: $31,273 (reported on 8.3% of returns)
Here:
$31,273
State:
$33,869
(% of AGI for various income ranges: 216.0% for AGIs $25k-50k, 257.1% for AGIs $50k-75k, 315.7% for AGIs $75k-100k, 621.6% for AGIs $100k-200k, 4622.9% for AGIs over 200k)
Charity contributions: $9,205 (reported on 6.7% of returns)
Here:
$9,205
State:
$14,577
(% of AGI for various income ranges: 38.3% for AGIs $50k-75k, 30.9% for AGIs $75k-100k, 88.4% for AGIs $100k-200k, 1988.6% for AGIs over 200k)
Taxes paid: $7,669 (reported on 8.3% of returns)
44280:
$7,669
State:
$7,681
(% of AGI for various income ranges: 26.4% for AGIs $25k-50k, 60.9% for AGIs $50k-75k, 115.7% for AGIs $75k-100k, 208.7% for AGIs $100k-200k, 872.9% for AGIs over 200k)
Earned income credit: $1,594 (reported on 5.4% of returns)
Here:
$1,594
State:
$2,304
(% of AGI for various income ranges: 32.7% for AGIs below $25k, 26.4% for AGIs $25k-50k)
Percentage of individuals using paid preparers for their 2020 taxes: 92.7%
Here:
93%
State:
94%
(% for various income ranges: 91.2% for AGIs below $25k, 91.8% for AGIs $25k-50k, 94.1% for AGIs $50k-75k, 91.7% for AGIs $75k-100k, 94.0% for AGIs $100k-200k, 95.0% for AGIs over 200k)
Averages for the 2012 tax year for zip code 44280, filed in 2013:
Average Adjusted Gross Income (AGI) in 2012: $64,740 (Individual Income Tax Returns)
Here:
$64,740
State:
$54,926
Salary/wage: $53,914 (reported on 84.2% of returns)
Here:
$53,914
State:
$45,869
(% of AGI for various income ranges: 69.2% for AGIs below $25k, 68.6% for AGIs $25k-50k, 72.6% for AGIs $50k-75k, 75.5% for AGIs $75k-100k, 75.5% for AGIs $100k-200k, 55.3% for AGIs over 200k)
Taxable interest for individuals: $1,088 (reported on 46.0% of returns)
This zip code:
$1,088
Ohio:
$1,297
(% of AGI for various income ranges: 1.5% for AGIs below $25k, 1.1% for AGIs $25k-50k, 0.5% for AGIs $50k-75k, 0.7% for AGIs $75k-100k, 0.4% for AGIs $100k-200k, 1.3% for AGIs over 200k)
Ordinary dividends: $3,780 (reported on 28.7% of returns)
Here:
$3,780
State:
$5,821
(% of AGI for various income ranges: 2.8% for AGIs below $25k, 1.1% for AGIs $25k-50k, 1.2% for AGIs $50k-75k, 0.9% for AGIs $75k-100k, 1.2% for AGIs $100k-200k, 3.6% for AGIs over 200k)
Net capital gain/loss in AGI: +$2,918 (reported on 18.9% of returns)
Here:
+$2,918
State:
+$11,232
(% of AGI for various income ranges: 0.5% for AGIs $75k-100k, 0.8% for AGIs $100k-200k, 3.1% for AGIs over 200k)
Profit/loss from business: +$11,073 (reported on 15.5% of returns)
Here:
+$11,073
State:
+$12,773
(% of AGI for various income ranges: 6.8% for AGIs below $25k, 4.5% for AGIs $25k-50k, 2.2% for AGIs $50k-75k, 1.5% for AGIs $75k-100k, 2.5% for AGIs $100k-200k, 2.0% for AGIs over 200k)
Taxable individual retirement arrangement distribution: $14,618 (reported on 14.7% of returns)
44280:
$14,618
Ohio:
$14,511
(% of AGI for various income ranges: 4.1% for AGIs below $25k, 3.8% for AGIs $25k-50k, 3.3% for AGIs $50k-75k, 4.8% for AGIs $75k-100k, 4.3% for AGIs $100k-200k)
Total itemized deductions: $19,520 (19% of AGI, reported on 43.0% of returns)
Here:
$19,520
State:
$21,278
Here:
18.8% of AGI
State:
18.8% of AGI
(% of AGI for various income ranges: 10.2% for AGIs below $25k, 12.7% for AGIs $25k-50k, 13.0% for AGIs $50k-75k, 13.9% for AGIs $75k-100k, 14.8% for AGIs $100k-200k, 10.1% for AGIs over 200k)
Charity contributions: $2,515 (reported on 33.6% of returns)
Here:
$2,515
State:
$3,943
(% of AGI for various income ranges: 0.6% for AGIs below $25k, 1.1% for AGIs $25k-50k, 1.3% for AGIs $50k-75k, 1.3% for AGIs $75k-100k, 1.5% for AGIs $100k-200k, 1.3% for AGIs over 200k)
Taxes paid: $8,242 (reported on 43.0% of returns)
44280:
$8,242
State:
$9,568
(% of AGI for various income ranges: 1.6% for AGIs below $25k, 3.4% for AGIs $25k-50k, 4.8% for AGIs $50k-75k, 5.7% for AGIs $75k-100k, 6.9% for AGIs $100k-200k, 6.1% for AGIs over 200k)
Earned income credit: $1,721 (reported on 7.2% of returns)
Here:
$1,721
State:
$2,285
(% of AGI for various income ranges: 2.5% for AGIs below $25k, 0.5% for AGIs $25k-50k)
Percentage of individuals using paid preparers for their 2012 taxes: 55.1%
Here:
55%
State:
51%
(% for various income ranges: 45.7% for AGIs below $25k, 55.6% for AGIs $25k-50k, 61.2% for AGIs $50k-75k, 60.0% for AGIs $75k-100k, 55.3% for AGIs $100k-200k, 87.5% for AGIs over 200k)
Averages for the 2004 tax year for zip code 44280, filed in 2005:
Average Adjusted Gross Income (AGI) in 2004: $56,991 (Individual Income Tax Returns)
Here:
$56,991
State:
$44,480
Salary/wage: $50,105 (reported on 86.3% of returns)
Here:
$50,105
State:
$39,198
(% of AGI for various income ranges: 120.4% for AGIs below $10k, 65.9% for AGIs $10k-25k, 78.2% for AGIs $25k-50k, 79.9% for AGIs $50k-75k, 84.5% for AGIs $75k-100k, 69.2% for AGIs over 100k)
Taxable interest for individuals: $1,765 (reported on 60.0% of returns)
This zip code:
$1,765
Ohio:
$1,532
(% of AGI for various income ranges: 8.0% for AGIs below $10k, 3.2% for AGIs $10k-25k, 2.2% for AGIs $25k-50k, 1.9% for AGIs $50k-75k, 1.4% for AGIs $75k-100k, 1.6% for AGIs over 100k)
Taxable dividends: $2,676 (reported on 35.3% of returns)
Here:
$2,676
State:
$3,496
(% of AGI for various income ranges: 9.6% for AGIs below $10k, 1.5% for AGIs $10k-25k, 1.1% for AGIs $25k-50k, 0.7% for AGIs $50k-75k, 0.8% for AGIs $75k-100k, 2.9% for AGIs over 100k)
Net capital gain/loss: +$5,893 (reported on 24.8% of returns)
Here:
+$5,893
State:
+$8,582
(% of AGI for various income ranges: -10.0% for AGIs below $10k, 1.1% for AGIs $10k-25k, -0.4% for AGIs $25k-50k, 0.7% for AGIs $50k-75k, 1.5% for AGIs $75k-100k, 6.1% for AGIs over 100k)
Profit/loss from business: +$12,975 (reported on 16.3% of returns)
Here:
+$12,975
State:
+$10,813
(% of AGI for various income ranges: 8.0% for AGIs below $10k, 9.6% for AGIs $10k-25k, 3.2% for AGIs $25k-50k, 3.5% for AGIs $50k-75k, 2.2% for AGIs $75k-100k, 3.8% for AGIs over 100k)
IRA payment deduction: $3,220 (reported on 3.7% of returns)
44280:
$3,220
Ohio:
$2,794
(% of AGI for various income ranges: 0.5% for AGIs $10k-25k, 0.3% for AGIs $25k-50k, 0.3% for AGIs $50k-75k, 0.1% for AGIs $75k-100k, 0.1% for AGIs over 100k)
Self-employed pension: $13,857 (reported on 0.6% of returns)
Here:
$13,857
Ohio:
$13,981
Total itemized deductions: $17,531 (22% of AGI, reported on 51.9% of returns)
Here:
$17,531
State:
$17,503
Here:
21.7% of AGI
State:
20.8% of AGI
(% of AGI for various income ranges: 15.1% for AGIs $10k-25k, 15.4% for AGIs $25k-50k, 17.6% for AGIs $50k-75k, 17.4% for AGIs $75k-100k, 14.8% for AGIs over 100k)
Charity contributions deductions: $2,046 (2% of AGI, reported on 44.5% of returns)
Here:
$2,046
State:
$3,087
Here:
2.4% of AGI
State:
3.4% of AGI
(% of AGI for various income ranges: 1.1% for AGIs $10k-25k, 1.4% for AGIs $25k-50k, 1.7% for AGIs $50k-75k, 1.8% for AGIs $75k-100k, 1.6% for AGIs over 100k)
Total tax: $7,747 (reported on 87.1% of returns)
44280:
$7,747
State:
$6,781
(% of AGI for various income ranges: 1.6% for AGIs below $10k, 5.5% for AGIs $10k-25k, 7.5% for AGIs $25k-50k, 9.3% for AGIs $50k-75k, 9.9% for AGIs $75k-100k, 17.9% for AGIs over 100k)
Earned income credit: $1,628 (reported on 4.2% of returns)
Here:
$1,628
State:
$1,696
Percentage of individuals using paid preparers for their 2004 taxes: 57.9%
Here:
58%
State:
55%
(% for various income ranges: 43.9% for AGIs below $10k, 55.4% for AGIs $10k-25k, 59.1% for AGIs $25k-50k, 60.6% for AGIs $50k-75k, 55.7% for AGIs $75k-100k, 66.5% for AGIs over 100k)
Household received Food Stamps/SNAP in the past 12 months: 40 Household did not receive Food Stamps/SNAP in the past 12 months: 2,054
Women who had a birth in the past 12 months: 34 (35 now married, 0 unmarried) Women who did not have a birth in the past 12 months: 1,069 (618 now married, 450 unmarried)
Housing units in zip code 44280 with a mortgage: 1,130 (281 second mortgage, 214 both second mortgage and home equity loan) Houses without a mortgage: 49
Median monthly owner costs for units with a mortgage: $1,803 Median monthly owner costs for units without a mortgage: $760
Residents with income below the poverty level in 2022:
This zip code:
3.5%
Whole state:
13.4%
Residents with income below 50% of the poverty level in 2022:
This zip code:
1.1%
Whole state:
7.0%
Median number of rooms in houses and condos:
Here:
7.3
State:
6.7
Median number of rooms in apartments:
Here:
4.8
State:
4.4
Notable locations in this zip code not listed on our city pages
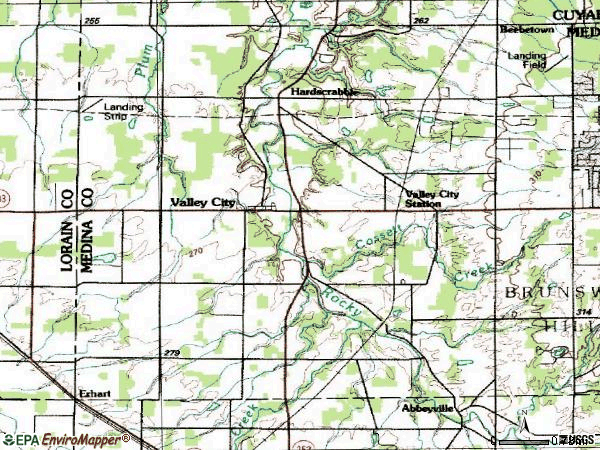
Notable locations in zip code 44280: Davis Tree Farm and Nursery (A), Hill Haven Farm and Greenhouse (B), Valley City - Liverpool Township Fire and Rescue (C). Display/hide their locations on the map
Churches in zip code 44280 include: Saint Pauls Church (A), Zion Lutheran Church (B), Saint Martin of Tours Church (C). Display/hide their locations on the map
Cemeteries: Myrtle Hill Cemetery (1), Rest Acre Cemetery (2), Saint Martin of Tours Cemetery (3), Saint Pauls Evangelical Lutheran Cemetery (4), Zion Lutheran Cemetery (5). Display/hide their locations on the map
In group quarters: 56 (-1 institutionalized population)
Size of family households: 640 2-persons, 471 3-persons, 339 4-persons, 40 5-persons, 18 6-persons, 42 7-or-more-persons
Size of nonfamily households: 472 1-person, 64 2-persons
844 married couples with children.
42 single-parent households (42 women).
96.9% of residents of 44280 zip code speak English at home.
0.8% of residents speak Spanish at home (100% very well).
2.5% of residents speak other Indo-European language at home (45% very well, 55% well).
Foreign born population: 66 (1.2%) (34.3% of them are naturalized citizens)
This zip code:
1.2%
Whole state:
5.0%
67%France
27%Poland
31%German
10%Italian
8%Irish
8%Polish
5%American
5%Hungarian
5%English
Year of entry for the foreign-born population
112010 or later
112000 to 2009
01990 to 1999
57Before 1990
Facilities with environmental interests located in this zip code:
CHC INDUSTRIES INC (5656 INNOVATION DR in VALLEY CITY, OH)
STATE MASTER (Ohio general info) - AIR MAJOR, RCRA-OHR000036566, HAZARDOUS WASTE PROGRAM HAZARDOUS WASTE BIENNIAL REPORTER (Resource Conservation and Recovery Act (tracking hazardous waste)) (Resource Conservation and Recovery Act (tracking hazardous waste)) Business SIC classification: MISCELLANEOUS FABRICATED WIRE PRODUCTS Business NAICS classification: STEEL WIRE DRAWING. Organizations: CLEANERS HANGAR COMPANY (CONTACT/OWNER)
Alternative names: CHC INDUSTRIES VALLEY CITY
BOEHM PRESS STEEL (5440 WEGMAN RD in VALLEY CITY, OH)
STATE MASTER (Ohio general info) - RCRA-OHR000011882, HAZARDOUS WASTE PROGRAM Small Quantity Generators, between 100 kg and 1000 kg of hazardous waste/month (Resource Conservation and Recovery Act (tracking hazardous waste)) - notification Organizations: ROBERT BOEHM (CONTACT/OWNER)
Housing units lacking complete plumbing facilities: 5.1% Housing units lacking complete kitchen facilities: 6.9%
57.4%Utility gas
17.1%Electricity
11.2%Bottled, tank, or LP gas
7.2%Fuel oil, kerosene, etc.
4.7%Wood
1.5%Other fuel
1.1%No fuel used
Population in 1990: 3,711. Population change in the 1990s: +439 (+11.8%).
Place of birth for U.S.-born residents:
This state: 4,420
Northeast: 237
Midwest: 206
South: 311
West: 78
68% of the 44280 zip code residents lived in the same house 5 years ago. Out of people who lived in different houses, 52% lived in this county. Out of people who lived in different counties, 50% lived in Ohio.
98% of the 44280 zip code residents lived in the same house 1 year ago. Out of people who lived in different houses, 49% moved from this county. Out of people who lived in different houses, 90% moved from different county within same state.
Private vs. public school enrollment:
Students in private schools in grades 1 to 8 (elementary and middle school): 180
Here:
39.1%
Ohio:
16.0%
Students in private schools in grades 9 to 12 (high school): 58
Here:
22.2%
Ohio:
13.1%
Students in private undergraduate colleges:
Here:
0.0%
Ohio:
22.3%
Occupation by median earnings in the past 12 months ($)
107,761Architecture and engineering occupations
99,107Management occupations
92,813Education, training, and library occupations
89,046Business and financial operations occupations
82,277Installation, maintenance, and repair occupations
76,328Health diagnosing and treating practitioners and other technical occupations
Companies with federal contracts located in this zip code:
WEBB-STILES COMPANY (675 LIVERPOOL DR in VALLEY CITY, OH; small business) : $1,966,925 in 7 contractsfrom 2002 to 2005
Contracts for Conveyors, Miscellaneous Materials Handling Equipment by Defense Logistics Agency, Air Force Signed by year:2000: $0; 2001: $0; 2002: $493,218; 2003: $270,940; 2004: $0; 2005: $1,202,767; 2006: $0.
Biggest contracts:
$908,693 with Defense Logistics Agency for Conveyors. Signed on 2005-03-31. Completion date: 2005-12-30.
$493,218 with Defense Logistics Agency for Conveyors. Taking place in CA. Signed on 2002-04-11. Completion date: 2002-12-31.
$266,870 with Air Force for Miscellaneous Materials Handling Equipment. Taking place in DE. Signed on 2003-02-25. Completion date: 2003-11-21.
$230,110 with Air Force for Miscellaneous Materials Handling Equipment. Taking place in CO. Signed on 2005-02-17. Completion date: 2005-08-14.
ORDEX INCORPORATED (5777 CENTER RD in VALLEY CITY, OH; small business) : $671,631 in 32 contractsfrom 2000 to 2006
Contracts for Packing and Gasket Materials, Miscellaneous Vehicular Components, O-Ring, Hose, Pipe, Tube, Lubrication, and Railing Fittings, and moreby Defense Logistics Agency, Army Signed by year:2000: $119,880; 2001: $88,560; 2002: $99,978; 2003: $175,981; 2004: $33,403; 2005: $145,731; 2006: $8,098.
Biggest contracts:
$99,978 with Defense Logistics Agency for Packing and Gasket Materials. Signed on 2002-09-12. Completion date: 2002-11-15.
$99,121, same as above.Signed on 2003-10-06. Completion date: 2003-12-19.
$88,560, same as above.Signed on 2001-01-01. Completion date: 2001-01-05.
$76,860 with Defense Logistics Agency for Miscellaneous Vehicular Components. Signed on 2003-12-27. Completion date: 2004-03-26.
CORNERSTONE CONSULTING ASSOCIA (2761 STIEGLER RD in VALLEY CITY, OH; small business)
$3,761 with Army for Training Aids. Signed on 2002-06-04. Completion date: 2002-05-31.
Top industries in this zip code by the number of employees in 2005:
Wholesale Trade: Metal Service Centers and Other Metal Merchant Wholesalers (50-99 employees: 3 establishments)
Wholesale Trade: Motor Vehicle Supplies and New Parts Merchant Wholesalers (50-99: 1, 1-4: 1)
Management of Companies and Enterprises: Corporate, Subsidiary, and Regional Managing Offices (50-99: 1)
People in group quarters in 2010:
27 people in group homes intended for adults
4 people in residential treatment centers for adults
People in group quarters in 2000:
145 people in nursing homes
33 people in homes for the mentally retarded
Fatal accident statistics in 2012:
Fatal accident count: 1
Vehicles involved in fatal accidents: 1
Fatal accidents caused by drunken drivers: 1
Fatalities: 1
Persons involved in fatal accidents: 2
Pedestrians involved in fatal accidents: 0
Fatal accident statistics in 2011:
Fatal accident count: 1
Vehicles involved in fatal accidents: 2
Fatal accidents caused by drunken drivers: 0
Fatalities: 1
Persons involved in fatal accidents: 2
Pedestrians involved in fatal accidents: 0
Home Mortgage Disclosure Act Aggregated Statistics For Year 2009 (Based on 2 partial tracts)
A) FHA, FSA/RHS & VA Home Purchase Loans
B) Conventional Home Purchase Loans
C) Refinancings
D) Home Improvement Loans
F) Non-occupant Loans on < 5 Family Dwellings (A B C & D)
Number
Average Value
Number
Average Value
Number
Average Value
Number
Average Value
Number
Average Value
LOANS ORIGINATED
18
$209,231
34
$157,851
230
$183,530
13
$66,928
5
$101,122
APPLICATIONS APPROVED, NOT ACCEPTED
2
$218,860
2
$81,290
13
$151,312
2
$9,825
2
$117,020
APPLICATIONS DENIED
0
$0
0
$0
88
$190,090
7
$51,811
2
$16,975
APPLICATIONS WITHDRAWN
2
$251,910
0
$0
41
$201,014
0
$0
2
$114,340
FILES CLOSED FOR INCOMPLETENESS
0
$0
0
$0
16
$167,494
0
$0
0
$0
Aggregated Statistics For Year 2008 (Based on 2 partial tracts)
A) FHA, FSA/RHS & VA Home Purchase Loans
B) Conventional Home Purchase Loans
C) Refinancings
D) Home Improvement Loans
E) Loans on Dwellings For 5+ Families
G) Loans On Manufactured Home Dwelling (A B C & D)
Number
Average Value
Number
Average Value
Number
Average Value
Number
Average Value
Number
Average Value
Number
Average Value
LOANS ORIGINATED
9
$161,191
55
$204,647
89
$178,981
14
$38,539
2
$153,650
0
$0
APPLICATIONS APPROVED, NOT ACCEPTED
5
$216,894
4
$115,682
9
$173,697
13
$13,331
0
$0
0
$0
APPLICATIONS DENIED
4
$104,515
5
$141,498
55
$187,918
18
$37,618
0
$0
2
$33,945
APPLICATIONS WITHDRAWN
0
$0
2
$121,490
25
$209,318
0
$0
0
$0
0
$0
FILES CLOSED FOR INCOMPLETENESS
0
$0
2
$238,510
9
$173,896
0
$0
0
$0
0
$0
Aggregated Statistics For Year 2007 (Based on 2 partial tracts)
B) Conventional Home Purchase Loans
C) Refinancings
D) Home Improvement Loans
F) Non-occupant Loans on < 5 Family Dwellings (A B C & D)
G) Loans On Manufactured Home Dwelling (A B C & D)
Number
Average Value
Number
Average Value
Number
Average Value
Number
Average Value
Number
Average Value
LOANS ORIGINATED
114
$178,770
129
$146,557
14
$21,822
0
$0
2
$69,675
APPLICATIONS APPROVED, NOT ACCEPTED
13
$227,311
18
$155,931
5
$31,086
4
$283,622
0
$0
APPLICATIONS DENIED
18
$164,467
89
$176,512
14
$63,679
5
$234,044
0
$0
APPLICATIONS WITHDRAWN
13
$192,265
36
$171,960
7
$106,176
4
$136,675
0
$0
FILES CLOSED FOR INCOMPLETENESS
0
$0
4
$140,248
2
$26,800
0
$0
0
$0
Aggregated Statistics For Year 2006 (Based on 2 partial tracts)
A) FHA, FSA/RHS & VA Home Purchase Loans
B) Conventional Home Purchase Loans
C) Refinancings
D) Home Improvement Loans
E) Loans on Dwellings For 5+ Families
F) Non-occupant Loans on < 5 Family Dwellings (A B C & D)
Number
Average Value
Number
Average Value
Number
Average Value
Number
Average Value
Number
Average Value
Number
Average Value
LOANS ORIGINATED
2
$152,755
188
$176,921
152
$150,215
20
$60,566
0
$0
13
$136,194
APPLICATIONS APPROVED, NOT ACCEPTED
0
$0
20
$205,012
55
$214,522
5
$58,600
0
$0
7
$172,790
APPLICATIONS DENIED
0
$0
36
$237,568
98
$175,780
20
$100,050
2
$482,380
4
$207,245
APPLICATIONS WITHDRAWN
0
$0
9
$158,809
59
$178,357
7
$88,309
0
$0
0
$0
FILES CLOSED FOR INCOMPLETENESS
0
$0
0
$0
18
$177,469
0
$0
0
$0
0
$0
Aggregated Statistics For Year 2005 (Based on 2 partial tracts)
A) FHA, FSA/RHS & VA Home Purchase Loans
B) Conventional Home Purchase Loans
C) Refinancings
D) Home Improvement Loans
F) Non-occupant Loans on < 5 Family Dwellings (A B C & D)
G) Loans On Manufactured Home Dwelling (A B C & D)
Number
Average Value
Number
Average Value
Number
Average Value
Number
Average Value
Number
Average Value
Number
Average Value
LOANS ORIGINATED
2
$75,035
150
$187,438
248
$175,750
21
$83,120
7
$174,576
2
$121,490
APPLICATIONS APPROVED, NOT ACCEPTED
0
$0
14
$226,388
34
$227,529
4
$130,868
4
$151,415
0
$0
APPLICATIONS DENIED
0
$0
16
$122,271
113
$193,285
20
$65,568
7
$148,033
0
$0
APPLICATIONS WITHDRAWN
0
$0
7
$195,506
48
$185,248
9
$102,630
2
$112,555
0
$0
FILES CLOSED FOR INCOMPLETENESS
0
$0
5
$135,066
9
$244,566
2
$13,400
0
$0
0
$0
Aggregated Statistics For Year 2004 (Based on 2 partial tracts)
A) FHA, FSA/RHS & VA Home Purchase Loans
B) Conventional Home Purchase Loans
C) Refinancings
D) Home Improvement Loans
F) Non-occupant Loans on < 5 Family Dwellings (A B C & D)
G) Loans On Manufactured Home Dwelling (A B C & D)
Number
Average Value
Number
Average Value
Number
Average Value
Number
Average Value
Number
Average Value
Number
Average Value
LOANS ORIGINATED
4
$114,790
145
$194,394
214
$166,179
14
$114,087
7
$226,643
2
$384,120
APPLICATIONS APPROVED, NOT ACCEPTED
0
$0
11
$161,281
38
$179,130
5
$97,548
2
$43,770
0
$0
APPLICATIONS DENIED
2
$113,450
13
$215,904
141
$184,007
11
$144,065
0
$0
0
$0
APPLICATIONS WITHDRAWN
2
$109,875
20
$191,166
71
$159,863
4
$48,685
2
$133,995
0
$0
FILES CLOSED FOR INCOMPLETENESS
0
$0
2
$343,025
16
$187,816
0
$0
2
$89,330
0
$0
Aggregated Statistics For Year 2003 (Based on 2 partial tracts)
A) FHA, FSA/RHS & VA Home Purchase Loans
B) Conventional Home Purchase Loans
C) Refinancings
D) Home Improvement Loans
F) Non-occupant Loans on < 5 Family Dwellings (A B C & D)
Number
Average Value
Number
Average Value
Number
Average Value
Number
Average Value
Number
Average Value
LOANS ORIGINATED
2
$125,060
161
$169,161
582
$157,506
21
$43,900
23
$102,768
APPLICATIONS APPROVED, NOT ACCEPTED
0
$0
16
$114,901
71
$168,771
4
$16,972
4
$96,478
APPLICATIONS DENIED
0
$0
13
$206,284
109
$152,582
14
$27,054
7
$90,096
APPLICATIONS WITHDRAWN
2
$145,610
16
$252,358
84
$144,906
7
$48,493
0
$0
FILES CLOSED FOR INCOMPLETENESS
2
$109,875
4
$168,388
18
$186,898
0
$0
4
$168,388
Aggregated Statistics For Year 2002 (Based on 2 partial tracts)
A) FHA, FSA/RHS & VA Home Purchase Loans
B) Conventional Home Purchase Loans
C) Refinancings
D) Home Improvement Loans
F) Non-occupant Loans on < 5 Family Dwellings (A B C & D)
Number
Average Value
Number
Average Value
Number
Average Value
Number
Average Value
Number
Average Value
LOANS ORIGINATED
5
$185,450
170
$171,009
379
$150,716
18
$13,598
4
$88,882
APPLICATIONS APPROVED, NOT ACCEPTED
0
$0
7
$253,953
55
$139,095
11
$29,235
5
$310,868
APPLICATIONS DENIED
0
$0
4
$171,512
88
$145,506
7
$10,464
0
$0
APPLICATIONS WITHDRAWN
0
$0
7
$174,066
59
$127,999
7
$29,096
0
$0
FILES CLOSED FOR INCOMPLETENESS
0
$0
2
$419,850
16
$171,179
0
$0
0
$0
Aggregated Statistics For Year 2001 (Based on 2 partial tracts)
A) FHA, FSA/RHS & VA Home Purchase Loans
B) Conventional Home Purchase Loans
C) Refinancings
D) Home Improvement Loans
F) Non-occupant Loans on < 5 Family Dwellings (A B C & D)
Number
Average Value
Number
Average Value
Number
Average Value
Number
Average Value
Number
Average Value
LOANS ORIGINATED
2
$97,370
154
$184,171
377
$138,094
14
$39,688
13
$87,543
APPLICATIONS APPROVED, NOT ACCEPTED
0
$0
9
$133,797
32
$149,628
13
$43,565
0
$0
APPLICATIONS DENIED
2
$103,625
13
$87,131
73
$131,058
9
$6,749
2
$25,905
APPLICATIONS WITHDRAWN
0
$0
4
$156,328
57
$133,117
2
$6,255
0
$0
FILES CLOSED FOR INCOMPLETENESS
0
$0
2
$151,860
16
$113,002
0
$0
0
$0
Aggregated Statistics For Year 2000 (Based on 2 partial tracts)
A) FHA, FSA/RHS & VA Home Purchase Loans
B) Conventional Home Purchase Loans
C) Refinancings
D) Home Improvement Loans
F) Non-occupant Loans on < 5 Family Dwellings (A B C & D)
Number
Average Value
Number
Average Value
Number
Average Value
Number
Average Value
Number
Average Value
LOANS ORIGINATED
2
$103,625
157
$169,112
100
$121,382
25
$46,237
0
$0
APPLICATIONS APPROVED, NOT ACCEPTED
0
$0
16
$196,526
30
$143,940
14
$15,441
0
$0
APPLICATIONS DENIED
0
$0
9
$105,608
50
$127,456
18
$20,844
0
$0
APPLICATIONS WITHDRAWN
2
$132,210
7
$144,204
30
$106,898
11
$68,703
2
$44,665
FILES CLOSED FOR INCOMPLETENESS
0
$0
0
$0
2
$119,700
0
$0
0
$0
Aggregated Statistics For Year 1999 (Based on 1 partial tract)
A) FHA, FSA/RHS & VA Home Purchase Loans
B) Conventional Home Purchase Loans
C) Refinancings
D) Home Improvement Loans
F) Non-occupant Loans on < 5 Family Dwellings (A B C & D)
Detailed PMIC statistics for the following Tracts:4020.00
2002 - 2018 National Fire Incident Reporting System (NFIRS) incidents
Based on the data from the years 2002 - 2018 the average number of fire incidents per year is 23. The highest number of reported fire incidents - 40 took place in 2014, and the least - 14 in 2011. The data has a dropping trend.
When looking into fire subcategories, the most reports belonged to: Structure Fires (46.2%), and Outside Fires (42.6%).
Fire incident types reported to NFIRS in Zip Code 44280


 Nearest zip codes: 44028, 44149, 44212, 44044, 44138, 44256.


 Based on the data from the years 2002 - 2018 the average number of fire incidents per year is 23. The highest number of reported fire incidents - 40 took place in 2014, and the least - 14 in 2011. The data has a dropping trend.
 When looking into fire subcategories, the most reports belonged to: Structure Fires (46.2%), and Outside Fires (42.6%).