Estimated zip code population in 2022: 7,216 Zip code population in 2010: 7,261 Zip code population in 2000: 7,975
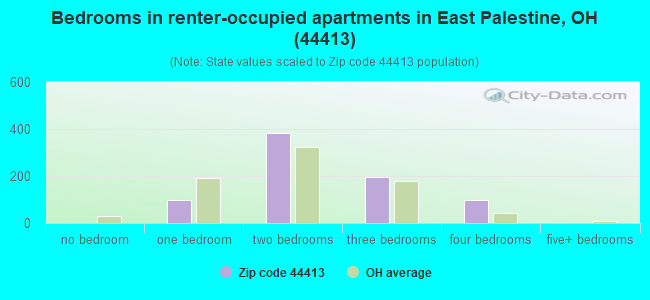
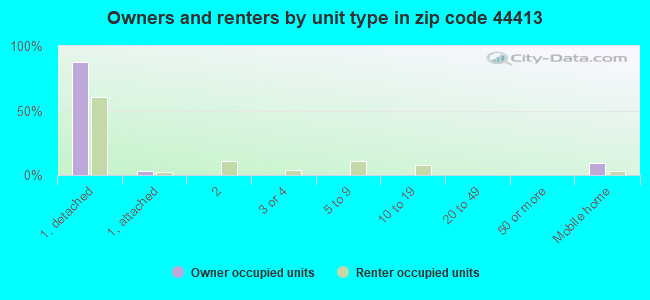
Houses and condos: 3,308 Renter-occupied apartments: 777
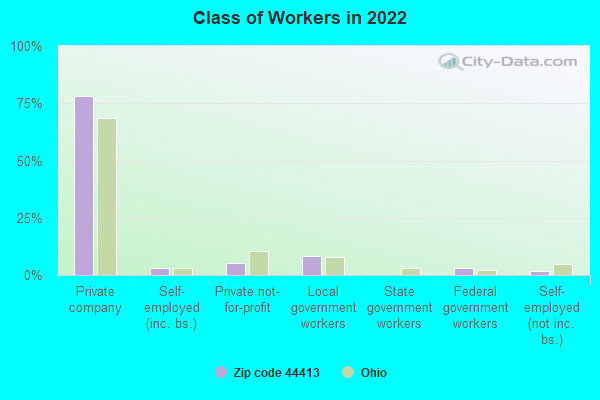
% of renters here:
26%
State:
33%
March 2022 cost of living index in zip code 44413: 76.6 (low, U.S. average is 100)
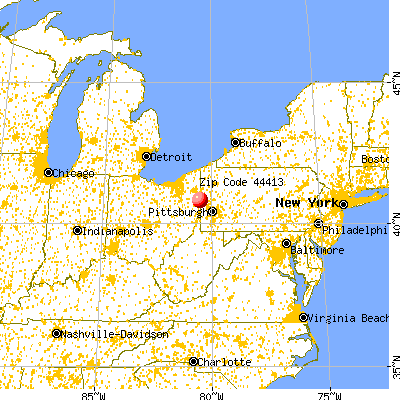
Land area: 23.7 sq. mi. Water area: 0.0 sq. mi.
Population density: 304 people per square mile
(very low).
OSM Map
General Map
Google Map
MSN Map
OSM Map
General Map
Google Map
MSN Map
OSM Map
General Map
Google Map
MSN Map
OSM Map
General Map
Google Map
MSN Map
Please wait while loading the map...
Real estate property taxes paid for housing units in 2022:
This zip code:
1.1% ($1,400)
Ohio:
1.3% ($2,639)
Median real estate property taxes paid for housing units with mortgages in 2022: $1,482 (1.0%) Median real estate property taxes paid for housing units with no mortgage in 2022: $1,313 (1.2%)
Business Search- 14 Million verified businesses
Males: 3,661
(50.7%)
Females: 3,555
(49.3%)
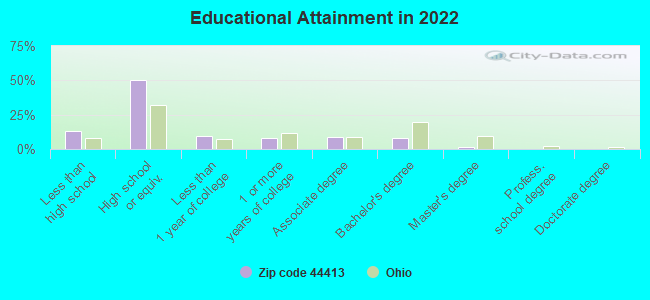
For population 25 years and over in 44413:
High school or higher: 85.2%
Bachelor's degree or higher: 10.2%
Graduate or professional degree: 2.0%
Unemployed: 1.7%
Mean travel time to work (commute): 22.7 minutes
For population 15 years and over in 44413:
Never married: 29.7%
Now married: 43.1%
Separated: 1.9%
Widowed: 9.9%
Divorced: 15.4%
Zip code 44413 compared to state average:
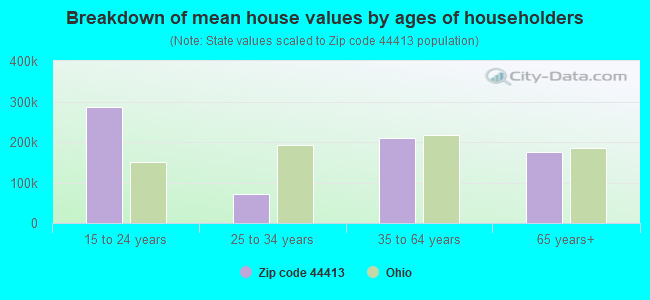
Median house value below state average.
Unemployed percentage below state average.
Black race population percentage significantly below state average.
Foreign-born population percentage significantly below state average.
Length of stay since moving in significantly above state average.
Number of college students below state average.
Percentage of population with a bachelor's degree or higher significantly below state average.
Averages for the 2020 tax year for zip code 44413, filed in 2021:
Average Adjusted Gross Income (AGI) in 2020: $47,995 (Individual Income Tax Returns)
Here:
$47,995
State:
$67,288
Salary/wage: $42,234 (reported on 83.5% of returns)
Here:
$42,234
State:
$55,628
(% of AGI for various income ranges: 1144.8% for AGIs below $25k, 3406.7% for AGIs $25k-50k, 6383.0% for AGIs $50k-75k, 8396.4% for AGIs $75k-100k, 14809.5% for AGIs $100k-200k)
Taxable interest for individuals: $699 (reported on 21.4% of returns)
This zip code:
$699
Ohio:
$1,518
(% of AGI for various income ranges: 11.3% for AGIs below $25k, 8.4% for AGIs $25k-50k, 18.4% for AGIs $50k-75k, 39.2% for AGIs $75k-100k, 48.4% for AGIs $100k-200k)
Ordinary dividends: $2,218 (reported on 14.7% of returns)
Here:
$2,218
State:
$7,167
(% of AGI for various income ranges: 22.9% for AGIs below $25k, 16.5% for AGIs $25k-50k, 44.9% for AGIs $50k-75k, 87.2% for AGIs $75k-100k, 194.7% for AGIs $100k-200k)
Net capital gain/loss in AGI: +$3,545 (reported on 12.1% of returns)
Here:
+$3,545
State:
+$18,919
(% of AGI for various income ranges: 7.7% for AGIs below $25k, 19.0% for AGIs $25k-50k, 63.7% for AGIs $50k-75k, 128.0% for AGIs $75k-100k, 351.1% for AGIs $100k-200k)
Profit/loss from business: +$9,824 (reported on 11.0% of returns)
Here:
+$9,824
State:
+$13,744
(% of AGI for various income ranges: 72.3% for AGIs below $25k, 77.2% for AGIs $25k-50k, 163.0% for AGIs $50k-75k, 166.0% for AGIs $75k-100k, 686.3% for AGIs $100k-200k)
Taxable individual retirement arrangement distribution: $12,237 (reported on 8.7% of returns)
44413:
$12,237
Ohio:
$18,876
(% of AGI for various income ranges: 52.2% for AGIs below $25k, 92.0% for AGIs $25k-50k, 144.2% for AGIs $50k-75k, 348.4% for AGIs $75k-100k, 492.1% for AGIs $100k-200k)
Total itemized deductions: $30,825 (reported on 1.2% of returns)
Here:
$30,825
State:
$33,869
(% of AGI for various income ranges: 34.3% for AGIs below $25k, 479.5% for AGIs $100k-200k)
Charity contributions: $7,100 (reported on 0.6% of returns)
Here:
$7,100
State:
$14,577
(% of AGI for various income ranges: 33.0% for AGIs $50k-75k)
Taxes paid: $5,800 (reported on 1.2% of returns)
44413:
$5,800
State:
$7,681
(% of AGI for various income ranges: 9.1% for AGIs $25k-50k, 82.6% for AGIs $100k-200k)
Earned income credit: $2,100 (reported on 17.6% of returns)
Here:
$2,100
State:
$2,304
(% of AGI for various income ranges: 82.3% for AGIs below $25k, 61.8% for AGIs $25k-50k)
Percentage of individuals using paid preparers for their 2020 taxes: 93.9%
Here:
94%
State:
94%
(% for various income ranges: 94.4% for AGIs below $25k, 93.9% for AGIs $25k-50k, 93.1% for AGIs $50k-75k, 93.8% for AGIs $75k-100k, 93.1% for AGIs $100k-200k, 100.0% for AGIs over 200k)
Averages for the 2012 tax year for zip code 44413, filed in 2013:
Average Adjusted Gross Income (AGI) in 2012: $43,052 (Individual Income Tax Returns)
Here:
$43,052
State:
$54,926
Salary/wage: $35,833 (reported on 86.6% of returns)
Here:
$35,833
State:
$45,869
(% of AGI for various income ranges: 75.3% for AGIs below $25k, 80.6% for AGIs $25k-50k, 82.2% for AGIs $50k-75k, 76.2% for AGIs $75k-100k, 71.7% for AGIs $100k-200k, 27.8% for AGIs over 200k)
Taxable interest for individuals: $619 (reported on 24.6% of returns)
This zip code:
$619
Ohio:
$1,297
(% of AGI for various income ranges: 0.9% for AGIs below $25k, 0.3% for AGIs $25k-50k, 0.1% for AGIs $50k-75k, 0.3% for AGIs $75k-100k, 0.5% for AGIs $100k-200k, 0.2% for AGIs over 200k)
Ordinary dividends: $2,076 (reported on 14.6% of returns)
Here:
$2,076
State:
$5,821
(% of AGI for various income ranges: 1.2% for AGIs below $25k, 0.4% for AGIs $25k-50k, 0.5% for AGIs $50k-75k, 0.6% for AGIs $75k-100k, 0.6% for AGIs $100k-200k, 1.7% for AGIs over 200k)
Net capital gain/loss in AGI: +$1,037 (reported on 7.7% of returns)
Here:
+$1,037
State:
+$11,232
(% of AGI for various income ranges: 0.2% for AGIs $25k-50k, 0.3% for AGIs $50k-75k, 0.4% for AGIs $100k-200k)
Profit/loss from business: +$11,278 (reported on 11.7% of returns)
Here:
+$11,278
State:
+$12,773
(% of AGI for various income ranges: 5.9% for AGIs below $25k, 2.4% for AGIs $25k-50k, 2.1% for AGIs $50k-75k, 3.7% for AGIs $75k-100k, 4.7% for AGIs $100k-200k)
Taxable individual retirement arrangement distribution: $9,340 (reported on 8.6% of returns)
44413:
$9,340
Ohio:
$14,511
(% of AGI for various income ranges: 2.3% for AGIs below $25k, 1.7% for AGIs $25k-50k, 1.6% for AGIs $50k-75k, 2.7% for AGIs $75k-100k, 2.8% for AGIs $100k-200k)
Total itemized deductions: $17,104 (18% of AGI, reported on 15.7% of returns)
Here:
$17,104
State:
$21,278
Here:
18.5% of AGI
State:
18.8% of AGI
(% of AGI for various income ranges: 2.4% for AGIs below $25k, 4.0% for AGIs $25k-50k, 6.3% for AGIs $50k-75k, 8.0% for AGIs $75k-100k, 9.1% for AGIs $100k-200k, 8.2% for AGIs over 200k)
Charity contributions: $2,937 (reported on 10.0% of returns)
Here:
$2,937
State:
$3,943
(% of AGI for various income ranges: 0.4% for AGIs $25k-50k, 0.5% for AGIs $50k-75k, 0.9% for AGIs $75k-100k, 1.2% for AGIs $100k-200k, 1.4% for AGIs over 200k)
Taxes paid: $6,329 (reported on 15.7% of returns)
44413:
$6,329
State:
$9,568
(% of AGI for various income ranges: 0.4% for AGIs below $25k, 1.1% for AGIs $25k-50k, 1.7% for AGIs $50k-75k, 2.9% for AGIs $75k-100k, 3.9% for AGIs $100k-200k, 4.9% for AGIs over 200k)
Earned income credit: $1,861 (reported on 19.1% of returns)
Here:
$1,861
State:
$2,285
(% of AGI for various income ranges: 4.8% for AGIs below $25k, 1.1% for AGIs $25k-50k)
Percentage of individuals using paid preparers for their 2012 taxes: 54.0%
Here:
54%
State:
51%
(% for various income ranges: 46.3% for AGIs below $25k, 56.9% for AGIs $25k-50k, 60.8% for AGIs $50k-75k, 61.5% for AGIs $75k-100k, 60.0% for AGIs $100k-200k, 100.0% for AGIs over 200k)
Averages for the 2004 tax year for zip code 44413, filed in 2005:
Average Adjusted Gross Income (AGI) in 2004: $32,131 (Individual Income Tax Returns)
Here:
$32,131
State:
$44,480
Salary/wage: $30,071 (reported on 87.9% of returns)
Here:
$30,071
State:
$39,198
(% of AGI for various income ranges: 99.6% for AGIs below $10k, 79.1% for AGIs $10k-25k, 86.1% for AGIs $25k-50k, 87.5% for AGIs $50k-75k, 85.2% for AGIs $75k-100k, 60.1% for AGIs over 100k)
Taxable interest for individuals: $832 (reported on 39.4% of returns)
This zip code:
$832
Ohio:
$1,532
(% of AGI for various income ranges: 3.6% for AGIs below $10k, 2.1% for AGIs $10k-25k, 0.7% for AGIs $25k-50k, 0.7% for AGIs $50k-75k, 0.9% for AGIs $75k-100k, 0.7% for AGIs over 100k)
Taxable dividends: $1,044 (reported on 19.8% of returns)
Here:
$1,044
State:
$3,496
(% of AGI for various income ranges: 2.1% for AGIs below $10k, 0.8% for AGIs $10k-25k, 0.5% for AGIs $25k-50k, 0.6% for AGIs $50k-75k, 0.5% for AGIs $75k-100k, 0.8% for AGIs over 100k)
Net capital gain/loss: +$1,947 (reported on 12.3% of returns)
Here:
+$1,947
State:
+$8,582
(% of AGI for various income ranges: -0.6% for AGIs below $10k, 0.6% for AGIs $10k-25k, 0.4% for AGIs $25k-50k, 1.3% for AGIs $50k-75k, 0.3% for AGIs $75k-100k, 1.5% for AGIs over 100k)
Profit/loss from business: +$10,215 (reported on 13.3% of returns)
Here:
+$10,215
State:
+$10,813
(% of AGI for various income ranges: 11.3% for AGIs below $10k, 4.5% for AGIs $10k-25k, 2.9% for AGIs $25k-50k, 1.6% for AGIs $50k-75k, 2.6% for AGIs $75k-100k, 12.6% for AGIs over 100k)
IRA payment deduction: $2,946 (reported on 2.6% of returns)
44413:
$2,946
Ohio:
$2,794
(% of AGI for various income ranges: 0.3% for AGIs $10k-25k, 0.3% for AGIs $25k-50k, 0.2% for AGIs $50k-75k, 0.4% for AGIs $75k-100k)
Total itemized deductions: $13,266 (21% of AGI, reported on 19.2% of returns)
Here:
$13,266
State:
$17,503
Here:
21.1% of AGI
State:
20.8% of AGI
(% of AGI for various income ranges: 3.2% for AGIs below $10k, 4.2% for AGIs $10k-25k, 6.2% for AGIs $25k-50k, 10.2% for AGIs $50k-75k, 10.7% for AGIs $75k-100k, 10.7% for AGIs over 100k)
Charity contributions deductions: $1,750 (3% of AGI, reported on 14.5% of returns)
Here:
$1,750
State:
$3,087
Here:
2.6% of AGI
State:
3.4% of AGI
(% of AGI for various income ranges: 0.2% for AGIs $10k-25k, 0.6% for AGIs $25k-50k, 0.9% for AGIs $50k-75k, 1.2% for AGIs $75k-100k, 1.5% for AGIs over 100k)
Total tax: $3,827 (reported on 72.9% of returns)
44413:
$3,827
State:
$6,781
(% of AGI for various income ranges: 2.6% for AGIs below $10k, 4.2% for AGIs $10k-25k, 6.3% for AGIs $25k-50k, 8.5% for AGIs $50k-75k, 11.0% for AGIs $75k-100k, 19.2% for AGIs over 100k)
Earned income credit: $1,424 (reported on 17.4% of returns)
Here:
$1,424
State:
$1,696
Percentage of individuals using paid preparers for their 2004 taxes: 53.2%
Here:
53%
State:
55%
(% for various income ranges: 42.7% for AGIs below $10k, 52.7% for AGIs $10k-25k, 58.1% for AGIs $25k-50k, 54.0% for AGIs $50k-75k, 62.5% for AGIs $75k-100k, 72.3% for AGIs over 100k)
Likely homosexual households (counted as self-reported same-sex unmarried-partner households)
Lesbian couples: 0.0% of all households
Gay men: 0.4% of all households
Household received Food Stamps/SNAP in the past 12 months: 336 Household did not receive Food Stamps/SNAP in the past 12 months: 2,662
Women who had a birth in the past 12 months: 146 (86 now married, 58 unmarried) Women who did not have a birth in the past 12 months: 1,458 (470 now married, 988 unmarried)
Housing units in zip code 44413 with a mortgage: 1,167 (118 second mortgage, 88 both second mortgage and home equity loan) Houses without a mortgage: 49
Median monthly owner costs for units with a mortgage: $1,000 Median monthly owner costs for units without a mortgage: $382
Residents with income below the poverty level in 2022:
This zip code:
8.7%
Whole state:
13.4%
Residents with income below 50% of the poverty level in 2022:
This zip code:
6.5%
Whole state:
7.0%
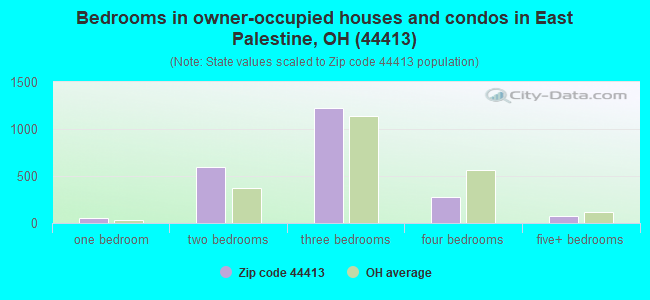
Median number of rooms in houses and condos:
Here:
6.3
State:
6.7
Median number of rooms in apartments:
Here:
4.9
State:
4.4
Notable locations in this zip code not listed on our city pages
Notable locations in zip code 44413: East Palestine Fire Department Station 2 (A), East Palestine Fire Department Station 1 (B), East Palestine Memorial Public Library (C). Display/hide their locations on the map
Churches in zip code 44413 include: Our Lady of Lourdes Roman Catholic Church (A), Grace Evangelical Lutheran Church (B), Centenary United Methodist Church (C), First United Presbyterian Church of East Palestine (D), East Palestine Church of the Nazarene (E), First Church of Christ of East Palestine (F). Display/hide their locations on the map
Cemeteries: Glenview Cemetery (1), Saint Marys Cemetery (2), Unity Brick Church Cemetery (3), Koch Cemetery (4), Mason Rich Cemetery (5). Display/hide their locations on the map
750 married couples with children.
689 single-parent households (346 men, 343 women).
97.5% of residents of 44413 zip code speak English at home.
1.4% of residents speak Spanish at home (68% very well, 32% well).
1.0% of residents speak other Indo-European language at home (100% very well).
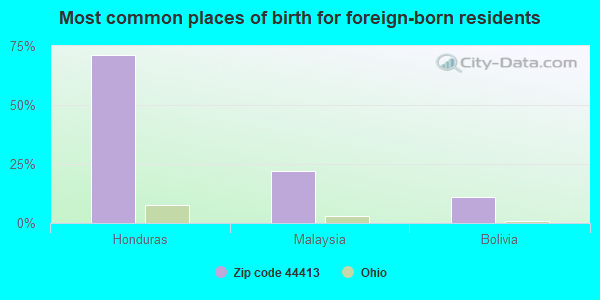
Foreign born population: 101 (1.4%) (92.0% of them are naturalized citizens)
This zip code:
1.4%
Whole state:
5.0%
71%Honduras
22%Malaysia
11%Bolivia
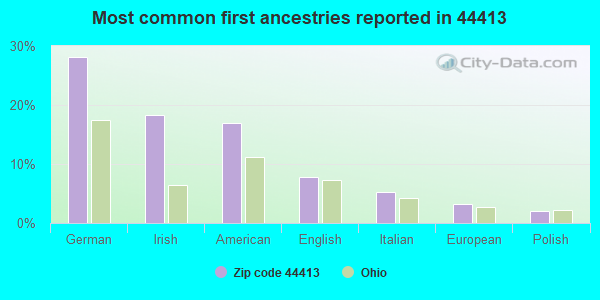
28%German
18%Irish
17%American
8%English
5%Italian
3%European
2%Polish
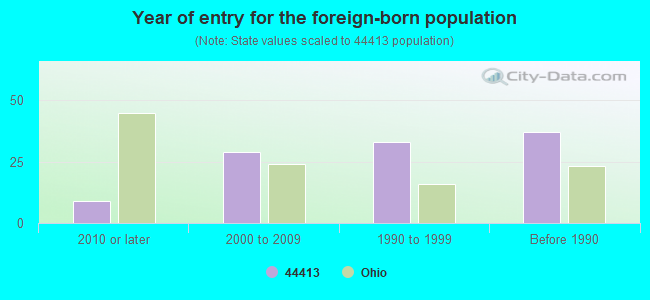
Year of entry for the foreign-born population
92010 or later
292000 to 2009
331990 to 1999
37Before 1990
Facilities with environmental interests located in this zip code:
BLOSCO IRON AND STEEL CO (1000 E TAGGERT in EAST PALESTINE, OH)
STATE MASTER (Ohio general info) - RCRA-OHD018006205, HAZARDOUS WASTE PROGRAM Conditionally Exempt Small Quantity Generators, less than 100 kg/month of hazardous waste (Resource Conservation and Recovery Act (tracking hazardous waste)) - notification
BIRNESSER AMOCO (212 N MARKET ST in EAST PALESTINE, OH)
STATE MASTER (Ohio general info) - RCRA-OHR000030775, HAZARDOUS WASTE PROGRAM Conditionally Exempt Small Quantity Generators, less than 100 kg/month of hazardous waste (Resource Conservation and Recovery Act (tracking hazardous waste)) Organizations: THE LYDEN CO (CONTACT/OWNER)
, LYDEN COMPANY (CONTACT/OWNER)
BLOSCO IRON AND STEEL CO (57 E CLARK ST in EAST PALESTINE, OH)
STATE MASTER (Ohio general info) - RCRA-OHD987056140, HAZARDOUS WASTE PROGRAM Small Quantity Generators, between 100 kg and 1000 kg of hazardous waste/month (Resource Conservation and Recovery Act (tracking hazardous waste)) - notification
BP OIL 6192 * (49917 ST RTE 14 in EAST PALESTINE, OH)
STATE MASTER (Ohio general info) - AIR MAJOR, EPCRA, RCRA-OHD987036886, HAZARDOUS WASTE PROGRAM Conditionally Exempt Small Quantity Generators, less than 100 kg/month of hazardous waste (Resource Conservation and Recovery Act (tracking hazardous waste)) - notification Organizations: BP OIL CO (CONTACT/OWNER)
, BP OIL COMPANY (CONTACT/OWNER)
Alternative names: BP OIL CO SITE 6192
ASSOCIATED TAD INC (390 E TAGGART ST in EAST PALESTINE, OH)
Conditionally Exempt Small Quantity Generators, less than 100 kg/month of hazardous waste (Resource Conservation and Recovery Act (tracking hazardous waste)) - notification Organizations: ALBERT C GLAVAN (CONTACT/OWNER)
BOTT FORD MERCURY BODYSHOP (169 W TAGGART ST in EAST PALESTINE, OH)
Conditionally Exempt Small Quantity Generators, less than 100 kg/month of hazardous waste (Resource Conservation and Recovery Act (tracking hazardous waste)) - notification Organizations: BOTT ELDON AND BOTT JESSICA L (CONTACT/OWNER)
AKENHIAO ICE CREAM (598 PARK AVENUE in EAST PALESTINE, OH)
COMPLIANCE ACTIVITY (Tracking inspections of insecticide, fungicide, and rodenticide, and toxic substances)
AMERICAN RUNNER CO (200 JAMES ST in EAST PALESTINE, OH)
TRI REPORTER (Tracking of toxic chemicals releasing facilities) Business SIC classification: NONCLAY REFRACTORIES
Housing units lacking complete plumbing facilities: 0.5% Housing units lacking complete kitchen facilities: 2.8%
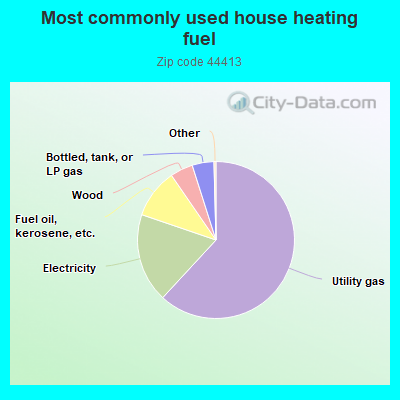
62.0%Utility gas
18.4%Electricity
10.2%Fuel oil, kerosene, etc.
4.7%Wood
4.5%Bottled, tank, or LP gas
Population in 1990: 7,493. Population change in the 1990s: +482 (+6.4%).
Place of birth for U.S.-born residents:
This state: 4,579
Northeast: 1,835
Midwest: 146
South: 383
West: 180
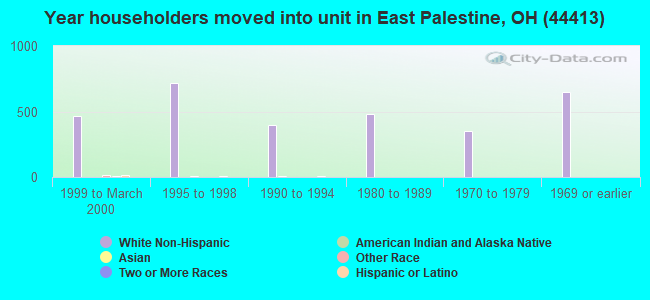
64% of the 44413 zip code residents lived in the same house 5 years ago. Out of people who lived in different houses, 73% lived in this county. Out of people who lived in different counties, 50% lived in Ohio.
96% of the 44413 zip code residents lived in the same house 1 year ago. Out of people who lived in different houses, 61% moved from this county. Out of people who lived in different houses, 19% moved from different county within same state. Out of people who lived in different houses, 29% moved from different state.
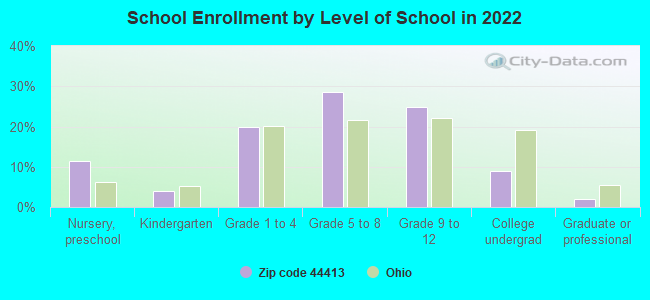
Private vs. public school enrollment:
Students in private schools in grades 1 to 8 (elementary and middle school): 10
Here:
1.4%
Ohio:
16.0%
Students in private schools in grades 9 to 12 (high school): 13
Here:
3.4%
Ohio:
13.1%
Students in private undergraduate colleges:
Here:
0.0%
Ohio:
22.3%
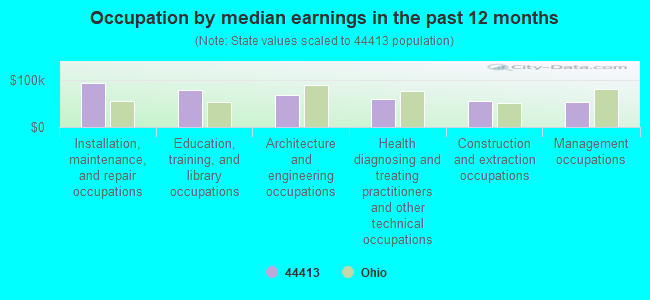
Occupation by median earnings in the past 12 months ($)
93,869Installation, maintenance, and repair occupations
78,566Education, training, and library occupations
68,183Architecture and engineering occupations
59,117Health diagnosing and treating practitioners and other technical occupations
54,508Construction and extraction occupations
53,328Management occupations
Companies with federal contracts located in this zip code:
ER ADVANCED CERAMICS INC (600 E CLARK ST in EAST PALESTINE, OH; small business) : $10,515 in 2 contractsfrom 2004 to 2005
$6,041 with Army for Laboratory Equipment and Supplies. Signed on 2005-08-04. Completion date: 2005-12-30.
$4,474 with Army for Industrial Size Reduction Machinery. Signed on 2004-03-18. Completion date: 2004-04-02.
Top industries in this zip code by the number of employees in 2005:
Other Services (except Public Administration): Commercial and Industrial Machinery and Equipment (except Automotive and Electronic) Repair and Maintenance (20-49: 1, 10-19: 1)
Accommodation and Food Services: Full-Service Restaurants (20-49: 1, 5-9: 1)
Other Services (except Public Administration): Religious Organizations (5-9: 4, 1-4: 4)
Construction: Plumbing, Heating, and Air-Conditioning Contractors (20-49: 1, 1-4: 1)
People in group quarters in 2010:
42 people in nursing facilities/skilled-nursing facilities
7 people in group homes intended for adults
People in group quarters in 2000:
13 people in homes for the mentally ill
2 people in other group homes
2 people in other noninstitutional group quarters
Fatal accident statistics in 2013:
Fatal accident count: 1
Vehicles involved in fatal accidents: 1
Fatal accidents caused by drunken drivers: 0
Fatalities: 1
Persons involved in fatal accidents: 1
Pedestrians involved in fatal accidents: 0
Fatal accident statistics in 2012:
Fatal accident count: 3
Vehicles involved in fatal accidents: 6
Fatal accidents caused by drunken drivers: 0
Fatalities: 3
Persons involved in fatal accidents: 8
Pedestrians involved in fatal accidents: 1
Home Mortgage Disclosure Act Aggregated Statistics For Year 2003 (Based on 2 full and 2 partial tracts)
A) FHA, FSA/RHS & VA Home Purchase Loans
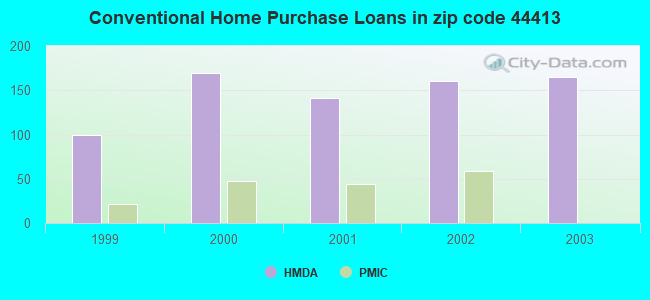
B) Conventional Home Purchase Loans
C) Refinancings
D) Home Improvement Loans
E) Loans on Dwellings For 5+ Families
F) Non-occupant Loans on < 5 Family Dwellings (A B C & D)
Number
Average Value
Number
Average Value
Number
Average Value
Number
Average Value
Number
Average Value
Number
Average Value
LOANS ORIGINATED
51
$70,667
165
$69,771
630
$79,723
42
$13,885
1
$356,800
38
$46,145
APPLICATIONS APPROVED, NOT ACCEPTED
2
$85,080
12
$108,552
117
$84,833
3
$20,903
0
$0
1
$44,330
APPLICATIONS DENIED
4
$65,485
34
$55,587
359
$79,595
37
$15,346
0
$0
4
$46,992
APPLICATIONS WITHDRAWN
5
$85,312
14
$72,454
143
$81,809
0
$0
0
$0
5
$70,954
FILES CLOSED FOR INCOMPLETENESS
0
$0
0
$0
35
$95,407
2
$87,060
0
$0
2
$87,060
Aggregated Statistics For Year 2002 (Based on 2 full and 2 partial tracts)
A) FHA, FSA/RHS & VA Home Purchase Loans
B) Conventional Home Purchase Loans
C) Refinancings
D) Home Improvement Loans
E) Loans on Dwellings For 5+ Families
F) Non-occupant Loans on < 5 Family Dwellings (A B C & D)
Number
Average Value
Number
Average Value
Number
Average Value
Number
Average Value
Number
Average Value
Number
Average Value
LOANS ORIGINATED
55
$65,131
160
$72,625
559
$80,033
67
$16,440
2
$153,340
35
$54,371
APPLICATIONS APPROVED, NOT ACCEPTED
2
$50,455
24
$54,326
122
$72,688
7
$18,601
0
$0
7
$66,176
APPLICATIONS DENIED
4
$93,310
43
$58,245
338
$67,891
60
$9,975
0
$0
9
$48,130
APPLICATIONS WITHDRAWN
2
$33,635
10
$79,612
148
$83,952
11
$18,271
0
$0
5
$46,938
FILES CLOSED FOR INCOMPLETENESS
0
$0
5
$115,212
65
$73,126
0
$0
0
$0
0
$0
Aggregated Statistics For Year 2001 (Based on 2 full and 2 partial tracts)
A) FHA, FSA/RHS & VA Home Purchase Loans
B) Conventional Home Purchase Loans
C) Refinancings
D) Home Improvement Loans
F) Non-occupant Loans on < 5 Family Dwellings (A B C & D)
Number
Average Value
Number
Average Value
Number
Average Value
Number
Average Value
Number
Average Value
LOANS ORIGINATED
49
$76,093
141
$72,677
520
$77,070
62
$13,098
34
$73,046
APPLICATIONS APPROVED, NOT ACCEPTED
3
$87,790
29
$65,785
105
$73,063
15
$14,807
4
$62,820
APPLICATIONS DENIED
9
$75,327
67
$50,997
376
$70,354
49
$15,605
10
$40,561
APPLICATIONS WITHDRAWN
3
$56,397
22
$80,310
138
$77,994
14
$16,936
8
$60,836
FILES CLOSED FOR INCOMPLETENESS
0
$0
2
$132,990
34
$72,651
0
$0
0
$0
Aggregated Statistics For Year 2000 (Based on 2 full and 2 partial tracts)
A) FHA, FSA/RHS & VA Home Purchase Loans
B) Conventional Home Purchase Loans
C) Refinancings
D) Home Improvement Loans
F) Non-occupant Loans on < 5 Family Dwellings (A B C & D)
Number
Average Value
Number
Average Value
Number
Average Value
Number
Average Value
Number
Average Value
LOANS ORIGINATED
46
$70,017
170
$76,585
215
$60,286
105
$16,696
28
$54,887
APPLICATIONS APPROVED, NOT ACCEPTED
0
$0
47
$72,770
103
$69,752
29
$16,048
5
$69,276
APPLICATIONS DENIED
4
$59,275
121
$41,922
227
$56,312
71
$20,857
13
$38,829
APPLICATIONS WITHDRAWN
2
$53,420
24
$76,804
113
$67,391
15
$14,165
5
$42,138
FILES CLOSED FOR INCOMPLETENESS
0
$0
5
$58,510
25
$55,366
0
$0
0
$0
Aggregated Statistics For Year 1999 (Based on 1 full and 1 partial tracts)
A) FHA, FSA/RHS & VA Home Purchase Loans
B) Conventional Home Purchase Loans
C) Refinancings
D) Home Improvement Loans
F) Non-occupant Loans on < 5 Family Dwellings (A B C & D)
Detailed PMIC statistics for the following Tracts:9501.00
, 9515.00
2002 - 2018 National Fire Incident Reporting System (NFIRS) incidents
Based on the data from the years 2002 - 2018 the average number of fires per year is 35. The highest number of reported fires - 51 took place in 2008, and the least - 27 in 2011. The data has a constant trend.
When looking into fire subcategories, the most incidents belonged to: Structure Fires (50.9%), and Outside Fires (37.6%).
Fire incident types reported to NFIRS in Zip Code 44413


 Nearest zip codes: 44445, 44454, 16120, 44441, 44455, 16115.
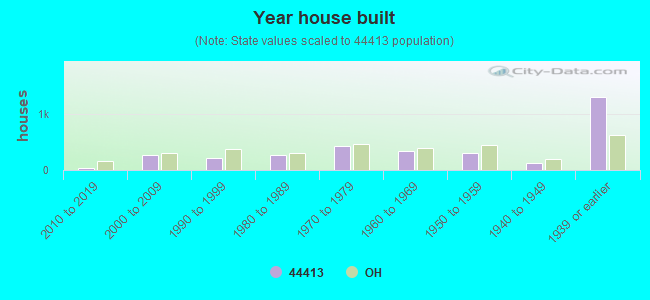


 Based on the data from the years 2002 - 2018 the average number of fires per year is 35. The highest number of reported fires - 51 took place in 2008, and the least - 27 in 2011. The data has a constant trend.
 When looking into fire subcategories, the most incidents belonged to: Structure Fires (50.9%), and Outside Fires (37.6%).