Estimated zip code population in 2022: 2,257 Zip code population in 2010: 2,425 Zip code population in 2000: 2,383
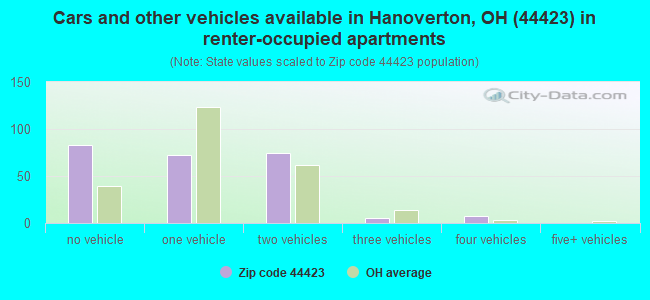
Houses and condos: 944 Renter-occupied apartments: 245
% of renters here:
27%
State:
33%
March 2022 cost of living index in zip code 44423: 84.2 (less than average, U.S. average is 100)
Land area: 27.3 sq. mi. Water area: 0.2 sq. mi.
Population density: 83 people per square mile
(very low).
OSM Map
General Map
Google Map
MSN Map
OSM Map
General Map
Google Map
MSN Map
OSM Map
General Map
Google Map
MSN Map
OSM Map
General Map
Google Map
MSN Map
Please wait while loading the map...
Real estate property taxes paid for housing units in 2022:
This zip code:
0.7% ($1,362)
Ohio:
1.3% ($2,639)
Median real estate property taxes paid for housing units with mortgages in 2022: $1,620 (0.8%) Median real estate property taxes paid for housing units with no mortgage in 2022: $1,207 (0.8%)
Business Search- 14 Million verified businesses
Males: 1,067
(47.3%)
Females: 1,190
(52.7%)
For population 25 years and over in 44423:
High school or higher: 91.2%
Bachelor's degree or higher: 20.2%
Graduate or professional degree: 1.7%
Unemployed: 5.9%
Mean travel time to work (commute): 22.1 minutes
For population 15 years and over in 44423:
Never married: 20.8%
Now married: 58.9%
Separated: 0.5%
Widowed: 7.2%
Divorced: 12.5%
Zip code 44423 compared to state average:
Black race population percentage significantly below state average.
Hispanic race population percentage significantly below state average.
Foreign-born population percentage below state average.
Length of stay since moving in significantly above state average.
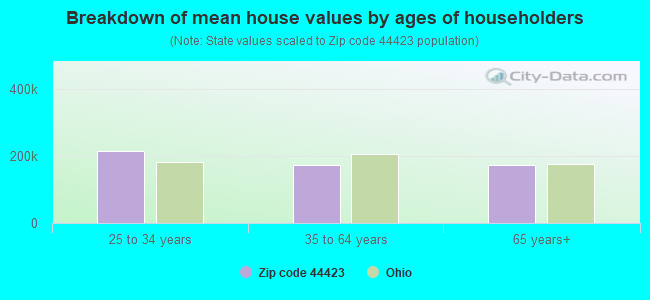
Estimated median house/condo value in 2022: $183,167
44423:
$183,167
Ohio:
$204,100
According to our research of Ohio and other state lists, there were 2 registered sex offenders living in 44423 zip code as of May 28, 2024. The ratio of all residents to sex offenders in zip code 44423 is 1,226 to 1. The ratio of registered sex offenders to all residents in this zip code is lower than the state average.
Median resident age:
This zip code:
38.4 years
Ohio median age:
39.9 years
Average household size:
This zip code:
2.5 people
Ohio:
2.4 people
Averages for the 2020 tax year for zip code 44423, filed in 2021:
Average Adjusted Gross Income (AGI) in 2020: $51,741 (Individual Income Tax Returns)
Here:
$51,741
State:
$67,288
Salary/wage: $46,163 (reported on 79.1% of returns)
Here:
$46,163
State:
$55,628
(% of AGI for various income ranges: 1100.0% for AGIs below $25k, 3156.4% for AGIs $25k-50k, 5801.3% for AGIs $50k-75k, 8783.8% for AGIs $75k-100k, 19702.9% for AGIs $100k-200k)
Taxable interest for individuals: $535 (reported on 23.6% of returns)
This zip code:
$535
Ohio:
$1,518
(% of AGI for various income ranges: 6.8% for AGIs below $25k, 12.0% for AGIs $25k-50k, 13.3% for AGIs $50k-75k, 42.5% for AGIs $75k-100k, 54.3% for AGIs $100k-200k)
Ordinary dividends: $5,739 (reported on 16.4% of returns)
Here:
$5,739
State:
$7,167
(% of AGI for various income ranges: 38.0% for AGIs below $25k, 32.4% for AGIs $25k-50k, 77.3% for AGIs $50k-75k, 1058.6% for AGIs $100k-200k)
Net capital gain/loss in AGI: +$4,427 (reported on 13.6% of returns)
Here:
+$4,427
State:
+$18,919
(% of AGI for various income ranges: 23.2% for AGIs below $25k, 12.4% for AGIs $25k-50k, 168.7% for AGIs $50k-75k, 460.0% for AGIs $100k-200k)
Profit/loss from business: +$11,294 (reported on 15.5% of returns)
Here:
+$11,294
State:
+$13,744
(% of AGI for various income ranges: 158.4% for AGIs below $25k, 158.0% for AGIs $25k-50k, 220.7% for AGIs $50k-75k, 636.2% for AGIs $75k-100k, 412.9% for AGIs $100k-200k)
Taxable individual retirement arrangement distribution: $12,109 (reported on 10.0% of returns)
44423:
$12,109
Ohio:
$18,876
(% of AGI for various income ranges: 80.0% for AGIs below $25k, 247.6% for AGIs $25k-50k, 641.2% for AGIs $75k-100k)
Earned income credit: $2,160 (reported on 13.6% of returns)
Here:
$2,160
State:
$2,304
(% of AGI for various income ranges: 70.4% for AGIs below $25k, 59.2% for AGIs $25k-50k)
Percentage of individuals using paid preparers for their 2020 taxes: 93.6%
Here:
94%
State:
94%
(% for various income ranges: 91.7% for AGIs below $25k, 93.5% for AGIs $25k-50k, 94.7% for AGIs $50k-75k, 90.9% for AGIs $75k-100k, 100.0% for AGIs $100k-200k)
Averages for the 2012 tax year for zip code 44423, filed in 2013:
Average Adjusted Gross Income (AGI) in 2012: $43,982 (Individual Income Tax Returns)
Here:
$43,982
State:
$54,926
Salary/wage: $36,856 (reported on 83.5% of returns)
Here:
$36,856
State:
$45,869
(% of AGI for various income ranges: 69.9% for AGIs below $25k, 73.9% for AGIs $25k-50k, 74.5% for AGIs $50k-75k, 79.3% for AGIs $75k-100k, 56.0% for AGIs $100k-200k)
Taxable interest for individuals: $412 (reported on 30.3% of returns)
This zip code:
$412
Ohio:
$1,297
(% of AGI for various income ranges: 0.6% for AGIs below $25k, 0.3% for AGIs $25k-50k, 0.1% for AGIs $50k-75k, 0.2% for AGIs $75k-100k, 0.3% for AGIs $100k-200k)
Ordinary dividends: $2,311 (reported on 17.4% of returns)
Here:
$2,311
State:
$5,821
(% of AGI for various income ranges: 1.6% for AGIs below $25k, 0.7% for AGIs $25k-50k, 1.0% for AGIs $50k-75k, 0.6% for AGIs $75k-100k, 1.0% for AGIs $100k-200k)
Net capital gain/loss in AGI: +$4,333 (reported on 11.0% of returns)
Here:
+$4,333
State:
+$11,232
(% of AGI for various income ranges: 0.2% for AGIs below $25k, 0.1% for AGIs $25k-50k, 0.1% for AGIs $50k-75k, 0.5% for AGIs $75k-100k, 3.5% for AGIs $100k-200k)
Profit/loss from business: +$8,506 (reported on 16.5% of returns)
Here:
+$8,506
State:
+$12,773
(% of AGI for various income ranges: 8.7% for AGIs below $25k, 4.4% for AGIs $25k-50k, 3.1% for AGIs $50k-75k, 3.0% for AGIs $75k-100k)
Taxable individual retirement arrangement distribution: $8,417 (reported on 11.0% of returns)
44423:
$8,417
Ohio:
$14,511
(% of AGI for various income ranges: 4.1% for AGIs below $25k, 2.5% for AGIs $25k-50k, 4.9% for AGIs $50k-75k)
Total itemized deductions: $16,444 (20% of AGI, reported on 16.5% of returns)
Here:
$16,444
State:
$21,278
Here:
20.2% of AGI
State:
18.8% of AGI
(% of AGI for various income ranges: 6.0% for AGIs $25k-50k, 5.8% for AGIs $50k-75k, 9.1% for AGIs $75k-100k, 7.1% for AGIs $100k-200k)
Charity contributions: $3,075 (reported on 11.0% of returns)
Here:
$3,075
State:
$3,943
(% of AGI for various income ranges: 1.3% for AGIs below $25k, 0.9% for AGIs $50k-75k, 1.2% for AGIs $75k-100k, 0.8% for AGIs $100k-200k)
Taxes paid: $6,056 (reported on 16.5% of returns)
44423:
$6,056
State:
$9,568
(% of AGI for various income ranges: 1.5% for AGIs $25k-50k, 1.8% for AGIs $50k-75k, 2.9% for AGIs $75k-100k, 3.9% for AGIs $100k-200k)
Earned income credit: $2,089 (reported on 16.5% of returns)
Here:
$2,089
State:
$2,285
(% of AGI for various income ranges: 5.2% for AGIs below $25k, 1.0% for AGIs $25k-50k)
Percentage of individuals using paid preparers for their 2012 taxes: 60.6%
Here:
61%
State:
51%
(% for various income ranges: 54.8% for AGIs below $25k, 60.0% for AGIs $25k-50k, 61.1% for AGIs $50k-75k, 70.0% for AGIs $75k-100k, 77.8% for AGIs $100k-200k)
Averages for the 2004 tax year for zip code 44423, filed in 2005:
Average Adjusted Gross Income (AGI) in 2004: $32,656 (Individual Income Tax Returns)
Here:
$32,656
State:
$44,480
Salary/wage: $30,687 (reported on 86.4% of returns)
Here:
$30,687
State:
$39,198
(% of AGI for various income ranges: 109.5% for AGIs below $10k, 76.5% for AGIs $10k-25k, 82.0% for AGIs $25k-50k, 83.8% for AGIs $50k-75k, 83.4% for AGIs $75k-100k, 63.1% for AGIs over 100k)
Taxable interest for individuals: $687 (reported on 37.1% of returns)
This zip code:
$687
Ohio:
$1,532
(% of AGI for various income ranges: 3.9% for AGIs below $10k, 2.3% for AGIs $10k-25k, 0.4% for AGIs $25k-50k, 0.4% for AGIs $50k-75k, 0.3% for AGIs $75k-100k, 0.5% for AGIs over 100k)
Taxable dividends: $1,609 (reported on 19.7% of returns)
Here:
$1,609
State:
$3,496
(% of AGI for various income ranges: 1.2% for AGIs below $10k, 1.6% for AGIs $10k-25k, 0.5% for AGIs $25k-50k, 1.5% for AGIs $50k-75k, 0.7% for AGIs $75k-100k)
Net capital gain/loss: +$3,127 (reported on 12.7% of returns)
Here:
+$3,127
State:
+$8,582
(% of AGI for various income ranges: 2.8% for AGIs below $10k, 0.9% for AGIs $10k-25k, 0.8% for AGIs $25k-50k, 1.7% for AGIs $50k-75k, 2.1% for AGIs $75k-100k)
Profit/loss from business: +$7,274 (reported on 16.0% of returns)
Here:
+$7,274
State:
+$10,813
(% of AGI for various income ranges: 4.0% for AGIs below $10k, 6.5% for AGIs $10k-25k, 4.9% for AGIs $25k-50k, 3.1% for AGIs $50k-75k)
IRA payment deduction: $2,136 (reported on 2.0% of returns)
44423:
$2,136
Ohio:
$2,794
Total itemized deductions: $13,027 (23% of AGI, reported on 19.6% of returns)
Here:
$13,027
State:
$17,503
Here:
23.2% of AGI
State:
20.8% of AGI
(% of AGI for various income ranges: 6.4% for AGIs $10k-25k, 5.7% for AGIs $25k-50k, 10.5% for AGIs $50k-75k, 10.1% for AGIs $75k-100k, 8.7% for AGIs over 100k)
Charity contributions deductions: $2,075 (4% of AGI, reported on 13.1% of returns)
Here:
$2,075
State:
$3,087
Here:
3.5% of AGI
State:
3.4% of AGI
(% of AGI for various income ranges: 0.6% for AGIs $10k-25k, 0.4% for AGIs $25k-50k, 1.2% for AGIs $50k-75k, 2.0% for AGIs $75k-100k)
Total tax: $3,514 (reported on 75.1% of returns)
44423:
$3,514
State:
$6,781
(% of AGI for various income ranges: 3.4% for AGIs below $10k, 4.5% for AGIs $10k-25k, 6.9% for AGIs $25k-50k, 8.5% for AGIs $50k-75k, 10.3% for AGIs $75k-100k, 16.2% for AGIs over 100k)
Earned income credit: $1,701 (reported on 16.5% of returns)
Here:
$1,701
State:
$1,696
Percentage of individuals using paid preparers for their 2004 taxes: 56.6%
Here:
57%
State:
55%
(% for various income ranges: 49.4% for AGIs below $10k, 57.5% for AGIs $10k-25k, 56.9% for AGIs $25k-50k, 59.5% for AGIs $50k-75k, 69.0% for AGIs $75k-100k, 61.9% for AGIs over 100k)
Likely homosexual households (counted as self-reported same-sex unmarried-partner households)
Lesbian couples: 1.5% of all households
Gay men: 1.5% of all households
Household received Food Stamps/SNAP in the past 12 months: 85 Household did not receive Food Stamps/SNAP in the past 12 months: 807
Women who had a birth in the past 12 months: 66 (62 now married, 4 unmarried) Women who did not have a birth in the past 12 months: 421 (210 now married, 210 unmarried)
Housing units in zip code 44423 with a mortgage: 331 (6 second mortgage, 6 both second mortgage and home equity loan) Houses without a mortgage: 21
Median monthly owner costs for units with a mortgage: $1,191 Median monthly owner costs for units without a mortgage: $421
Residents with income below the poverty level in 2022:
This zip code:
12.7%
Whole state:
13.4%
Residents with income below 50% of the poverty level in 2022:
This zip code:
9.4%
Whole state:
7.0%
Median number of rooms in houses and condos:
Here:
6.1
State:
6.7
Median number of rooms in apartments:
Here:
6.6
State:
4.4
Notable locations in this zip code not listed on our city pages
Size of family households: 353 2-persons, 78 3-persons, 143 4-persons, 66 5-persons, 12 6-persons
Size of nonfamily households: 189 1-person, 47 2-persons
384 married couples with children.
52 single-parent households (12 men, 40 women).
98.0% of residents of 44423 zip code speak English at home.
0.2% of residents speak Spanish at home (100% very well).
1.3% of residents speak other Indo-European language at home (93% very well, 7% well).
Foreign born population: 58 (2.6%) (98.3% of them are naturalized citizens)
This zip code:
2.6%
Whole state:
5.0%
74%Lithuania
26%Taiwan
16%France
7%Bolivia
25%Irish
20%German
13%American
11%Italian
8%Scotch-Irish
4%English
3%Eastern European
Year of entry for the foreign-born population
02010 or later
232000 to 2009
21990 to 1999
30Before 1990
28.7%Electricity
24.8%Utility gas
18.7%Bottled, tank, or LP gas
13.8%Wood
12.8%Fuel oil, kerosene, etc.
1.4%Other fuel
Population in 1990: 2,461.
Place of birth for U.S.-born residents:
This state: 1,981
Northeast: 74
Midwest: 8
South: 105
West: 25
65% of the 44423 zip code residents lived in the same house 5 years ago. Out of people who lived in different houses, 72% lived in this county. Out of people who lived in different counties, 50% lived in Ohio.
98% of the 44423 zip code residents lived in the same house 1 year ago. Out of people who lived in different houses, 2% moved from this county. Out of people who lived in different houses, 127% moved from different county within same state.
Private vs. public school enrollment:
Students in private schools in grades 1 to 8 (elementary and middle school): 49
Here:
24.2%
Ohio:
16.0%
Students in private schools in grades 9 to 12 (high school):
Here:
0.0%
Ohio:
13.1%
Students in private undergraduate colleges:
Here:
0.0%
Ohio:
22.3%
Occupation by median earnings in the past 12 months ($)
107,889Management occupations
61,632Health diagnosing and treating practitioners and other technical occupations
60,891Education, training, and library occupations
46,602Installation, maintenance, and repair occupations
45,393Health technologists and technicians
44,263Community and social service occupations
Top industries in this zip code by the number of employees in 2005:
Accommodation and Food Services: Bed-and-Breakfast Inns (20-49 employees: 1 establishment)
Health Care and Social Assistance: Residential Mental Retardation Facilities (20-49: 1)
Accommodation and Food Services: Full-Service Restaurants (10-19: 1, 5-9: 1)
Construction: Highway, Street, and Bridge Construction (10-19: 1)
Finance and Insurance: Commercial Banking (5-9: 2)
Wholesale Trade: Industrial Machinery and Equipment Merchant Wholesalers (5-9: 1)
Health Care and Social Assistance: Offices of Physicians (except Mental Health Specialists) (5-9: 1)
Mining: Drilling Oil and Gas Wells (5-9: 1)
Fatal accident statistics in 2014:
Fatal accident count: 2
Vehicles involved in fatal accidents: 3
Fatal accidents caused by drunken drivers: 1
Fatalities: 2
Persons involved in fatal accidents: 4
Pedestrians involved in fatal accidents: 0
Fatal accident statistics in 2012:
Fatal accident count: 1
Vehicles involved in fatal accidents: 1
Fatal accidents caused by drunken drivers: 1
Fatalities: 1
Persons involved in fatal accidents: 1
Pedestrians involved in fatal accidents: 0
Home Mortgage Disclosure Act Aggregated Statistics For Year 2003 (Based on 4 partial tracts)
A) FHA, FSA/RHS & VA Home Purchase Loans
B) Conventional Home Purchase Loans
C) Refinancings
D) Home Improvement Loans
F) Non-occupant Loans on < 5 Family Dwellings (A B C & D)
Number
Average Value
Number
Average Value
Number
Average Value
Number
Average Value
Number
Average Value
LOANS ORIGINATED
7
$76,966
39
$83,137
169
$80,091
18
$25,982
8
$50,926
APPLICATIONS APPROVED, NOT ACCEPTED
0
$0
3
$68,027
32
$82,382
4
$21,885
2
$45,575
APPLICATIONS DENIED
1
$65,240
9
$59,987
96
$84,561
10
$25,280
4
$64,715
APPLICATIONS WITHDRAWN
0
$0
7
$69,086
40
$90,106
4
$26,308
1
$26,680
FILES CLOSED FOR INCOMPLETENESS
1
$94,670
2
$55,535
12
$91,144
1
$22,000
1
$33,220
Aggregated Statistics For Year 2002 (Based on 4 partial tracts)
A) FHA, FSA/RHS & VA Home Purchase Loans
B) Conventional Home Purchase Loans
C) Refinancings
D) Home Improvement Loans
E) Loans on Dwellings For 5+ Families
F) Non-occupant Loans on < 5 Family Dwellings (A B C & D)
Number
Average Value
Number
Average Value
Number
Average Value
Number
Average Value
Number
Average Value
Number
Average Value
LOANS ORIGINATED
5
$71,226
41
$84,061
122
$77,433
15
$23,007
1
$47,030
7
$53,733
APPLICATIONS APPROVED, NOT ACCEPTED
1
$35,730
9
$65,259
35
$82,261
1
$10,430
0
$0
1
$50,310
APPLICATIONS DENIED
1
$49,550
16
$57,810
76
$74,237
8
$39,606
0
$0
1
$30,510
APPLICATIONS WITHDRAWN
1
$98,290
6
$66,973
36
$80,177
5
$34,798
0
$0
0
$0
FILES CLOSED FOR INCOMPLETENESS
1
$36,180
1
$54,570
14
$73,016
1
$45,230
0
$0
1
$34,950
Aggregated Statistics For Year 2001 (Based on 4 partial tracts)
A) FHA, FSA/RHS & VA Home Purchase Loans
B) Conventional Home Purchase Loans
C) Refinancings
D) Home Improvement Loans
F) Non-occupant Loans on < 5 Family Dwellings (A B C & D)
Number
Average Value
Number
Average Value
Number
Average Value
Number
Average Value
Number
Average Value
LOANS ORIGINATED
10
$79,026
38
$65,166
118
$79,115
19
$14,897
8
$74,095
APPLICATIONS APPROVED, NOT ACCEPTED
1
$51,250
7
$64,597
26
$65,770
5
$8,026
1
$38,270
APPLICATIONS DENIED
1
$50,750
39
$42,863
75
$74,004
10
$21,515
6
$52,078
APPLICATIONS WITHDRAWN
2
$95,385
4
$51,615
38
$64,784
3
$32,487
0
$0
FILES CLOSED FOR INCOMPLETENESS
0
$0
0
$0
6
$72,210
1
$18,090
0
$0
Aggregated Statistics For Year 2000 (Based on 4 partial tracts)
A) FHA, FSA/RHS & VA Home Purchase Loans
B) Conventional Home Purchase Loans
C) Refinancings
D) Home Improvement Loans
F) Non-occupant Loans on < 5 Family Dwellings (A B C & D)
Number
Average Value
Number
Average Value
Number
Average Value
Number
Average Value
Number
Average Value
LOANS ORIGINATED
2
$78,220
40
$72,492
71
$56,693
28
$17,418
8
$40,230
APPLICATIONS APPROVED, NOT ACCEPTED
1
$14,470
11
$76,147
22
$57,685
7
$11,940
1
$95,270
APPLICATIONS DENIED
1
$95,320
38
$41,196
47
$59,917
17
$12,625
3
$49,247
APPLICATIONS WITHDRAWN
1
$21,110
7
$79,031
22
$57,889
6
$28,732
0
$0
FILES CLOSED FOR INCOMPLETENESS
0
$0
0
$0
5
$52,390
0
$0
0
$0
Aggregated Statistics For Year 1999 (Based on 2 partial tracts)
A) FHA, FSA/RHS & VA Home Purchase Loans
B) Conventional Home Purchase Loans
C) Refinancings
D) Home Improvement Loans
F) Non-occupant Loans on < 5 Family Dwellings (A B C & D)
Detailed PMIC statistics for the following Tracts:9510.00
, 9512.00
2002 - 2018 National Fire Incident Reporting System (NFIRS) incidents
Based on the data from the years 2002 - 2018 the average number of fires per year is 21. The highest number of reported fires - 44 took place in 2008, and the least - 3 in 2018. The data has a decreasing trend.
When looking into fire subcategories, the most reports belonged to: Structure Fires (51.8%), and Outside Fires (31.4%).
Fire incident types reported to NFIRS in Zip Code 44423


 Nearest zip codes: 44427, 44493, 43962, 44625, 43945, 44432.


 Based on the data from the years 2002 - 2018 the average number of fires per year is 21. The highest number of reported fires - 44 took place in 2008, and the least - 3 in 2018. The data has a decreasing trend.
 When looking into fire subcategories, the most reports belonged to: Structure Fires (51.8%), and Outside Fires (31.4%).