Estimated zip code population in 2022: 2,988 Zip code population in 2010: 3,032 Zip code population in 2000: 3,101
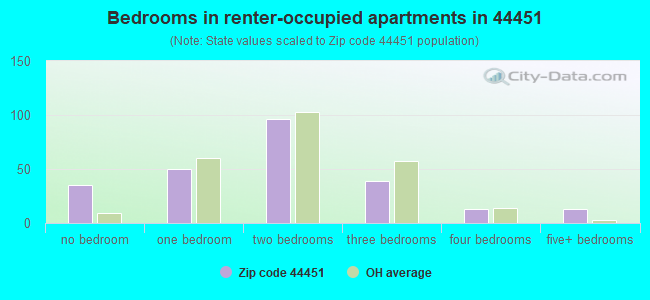
Houses and condos: 1,454 Renter-occupied apartments: 247
% of renters here:
20%
State:
33%
March 2022 cost of living index in zip code 44451: 83.4 (less than average, U.S. average is 100)
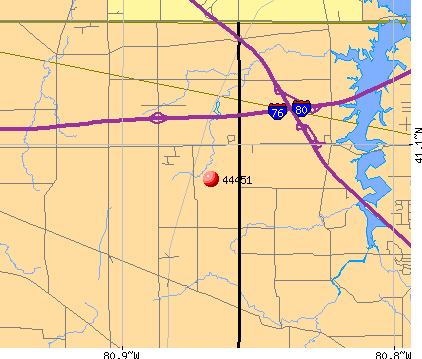
Land area: 37.5 sq. mi. Water area: 0.6 sq. mi.
Population density: 80 people per square mile
(very low).
OSM Map
General Map
Google Map
MSN Map
OSM Map
General Map
Google Map
MSN Map
OSM Map
General Map
Google Map
MSN Map
OSM Map
General Map
Google Map
MSN Map
Please wait while loading the map...
Real estate property taxes paid for housing units in 2022:
This zip code:
1.2% ($2,690)
Ohio:
1.3% ($2,639)
Median real estate property taxes paid for housing units with mortgages in 2022: $2,965 (1.1%) Median real estate property taxes paid for housing units with no mortgage in 2022: $2,428 (1.3%)
Business Search- 14 Million verified businesses
Males: 1,572
(52.6%)
Females: 1,415
(47.4%)
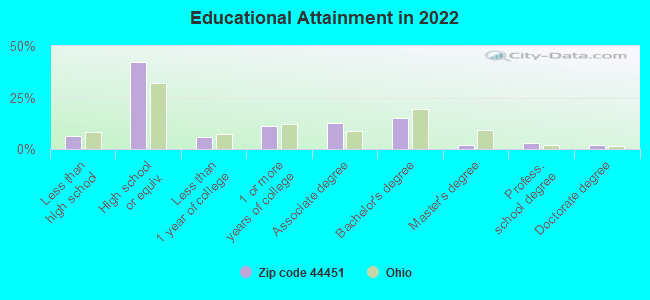
For population 25 years and over in 44451:
High school or higher: 92.7%
Bachelor's degree or higher: 21.7%
Graduate or professional degree: 6.7%
Unemployed: 5.4%
Mean travel time to work (commute): 27.4 minutes
For population 15 years and over in 44451:
Never married: 23.0%
Now married: 59.6%
Separated: 0.0%
Widowed: 7.5%
Divorced: 9.9%
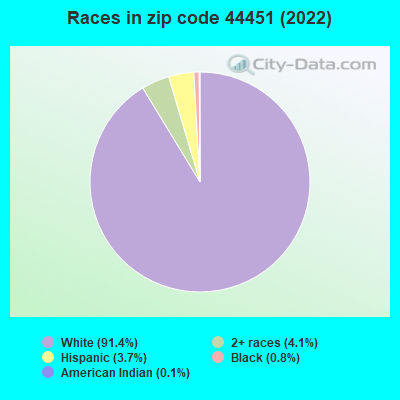
Zip code 44451 compared to state average:
Black race population percentage significantly below state average.
Median age above state average.
Foreign-born population percentage significantly below state average.
Renting percentage below state average.
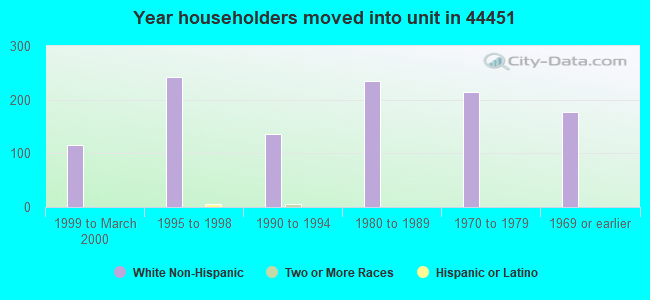
Length of stay since moving in significantly above state average.
Estimated median house/condo value in 2022: $220,023
44451:
$220,023
Ohio:
$204,100
According to our research of Ohio and other state lists, there were 5 registered sex offenders living in 44451 zip code as of May 28, 2024. The ratio of all residents to sex offenders in zip code 44451 is 618 to 1. The ratio of registered sex offenders to all residents in this zip code is near the state average.
Median resident age:
This zip code:
45.5 years
Ohio median age:
39.9 years
Average household size:
This zip code:
2.4 people
Ohio:
2.4 people
Averages for the 2020 tax year for zip code 44451, filed in 2021:
Average Adjusted Gross Income (AGI) in 2020: $62,662 (Individual Income Tax Returns)
Here:
$62,662
State:
$67,288
Salary/wage: $53,154 (reported on 76.9% of returns)
Here:
$53,154
State:
$55,628
(% of AGI for various income ranges: 1184.0% for AGIs below $25k, 3136.6% for AGIs $25k-50k, 6260.0% for AGIs $50k-75k, 9840.9% for AGIs $75k-100k, 14567.9% for AGIs $100k-200k)
Taxable interest for individuals: $1,142 (reported on 32.1% of returns)
This zip code:
$1,142
Ohio:
$1,518
(% of AGI for various income ranges: 35.0% for AGIs below $25k, 30.0% for AGIs $25k-50k, 51.7% for AGIs $50k-75k, 60.0% for AGIs $75k-100k, 123.6% for AGIs $100k-200k)
Ordinary dividends: $3,536 (reported on 21.2% of returns)
Here:
$3,536
State:
$7,167
(% of AGI for various income ranges: 19.7% for AGIs below $25k, 65.5% for AGIs $25k-50k, 56.1% for AGIs $50k-75k, 211.8% for AGIs $75k-100k, 173.6% for AGIs $100k-200k)
Net capital gain/loss in AGI: +$7,607 (reported on 17.3% of returns)
Here:
+$7,607
State:
+$18,919
(% of AGI for various income ranges: 4.0% for AGIs below $25k, 39.7% for AGIs $25k-50k, 68.3% for AGIs $50k-75k, 170.9% for AGIs $75k-100k, 597.9% for AGIs $100k-200k)
Profit/loss from business: +$15,171 (reported on 15.4% of returns)
Here:
+$15,171
State:
+$13,744
(% of AGI for various income ranges: 92.7% for AGIs below $25k, 155.9% for AGIs $25k-50k, 302.2% for AGIs $50k-75k, 395.5% for AGIs $75k-100k, 1380.0% for AGIs $100k-200k)
Taxable individual retirement arrangement distribution: $15,225 (reported on 10.3% of returns)
44451:
$15,225
Ohio:
$18,876
(% of AGI for various income ranges: 61.3% for AGIs below $25k, 154.1% for AGIs $25k-50k, 226.7% for AGIs $50k-75k, 330.0% for AGIs $75k-100k, 738.6% for AGIs $100k-200k)
Total itemized deductions: $28,267 (reported on 3.8% of returns)
Here:
$28,267
State:
$33,869
(% of AGI for various income ranges: 201.7% for AGIs $25k-50k, 793.6% for AGIs $100k-200k)
Charity contributions: $4,900 (reported on 2.6% of returns)
Here:
$4,900
State:
$14,577
(% of AGI for various income ranges: 140.0% for AGIs $100k-200k)
Taxes paid: $6,917 (reported on 3.8% of returns)
44451:
$6,917
State:
$7,681
(% of AGI for various income ranges: 42.8% for AGIs $25k-50k, 207.9% for AGIs $100k-200k)
Earned income credit: $2,059 (reported on 10.9% of returns)
Here:
$2,059
State:
$2,304
(% of AGI for various income ranges: 75.7% for AGIs below $25k, 42.4% for AGIs $25k-50k)
Percentage of individuals using paid preparers for their 2020 taxes: 94.9%
Here:
95%
State:
94%
(% for various income ranges: 93.5% for AGIs below $25k, 94.9% for AGIs $25k-50k, 96.2% for AGIs $50k-75k, 94.4% for AGIs $75k-100k, 95.5% for AGIs $100k-200k, 100.0% for AGIs over 200k)
Averages for the 2012 tax year for zip code 44451, filed in 2013:
Average Adjusted Gross Income (AGI) in 2012: $50,764 (Individual Income Tax Returns)
Here:
$50,764
State:
$54,926
Salary/wage: $40,460 (reported on 84.1% of returns)
Here:
$40,460
State:
$45,869
(% of AGI for various income ranges: 66.9% for AGIs below $25k, 69.7% for AGIs $25k-50k, 72.9% for AGIs $50k-75k, 78.3% for AGIs $75k-100k, 77.7% for AGIs $100k-200k)
Taxable interest for individuals: $1,416 (reported on 35.7% of returns)
This zip code:
$1,416
Ohio:
$1,297
(% of AGI for various income ranges: 1.3% for AGIs below $25k, 0.8% for AGIs $25k-50k, 0.6% for AGIs $50k-75k, 0.6% for AGIs $75k-100k, 1.9% for AGIs $100k-200k)
Ordinary dividends: $1,782 (reported on 21.7% of returns)
Here:
$1,782
State:
$5,821
(% of AGI for various income ranges: 1.5% for AGIs below $25k, 0.9% for AGIs $25k-50k, 0.7% for AGIs $50k-75k, 0.5% for AGIs $75k-100k, 0.9% for AGIs $100k-200k)
Net capital gain/loss in AGI: +$2,141 (reported on 17.2% of returns)
Here:
+$2,141
State:
+$11,232
(% of AGI for various income ranges: 3.1% for AGIs $100k-200k)
Profit/loss from business: +$7,845 (reported on 12.7% of returns)
Here:
+$7,845
State:
+$12,773
(% of AGI for various income ranges: 6.0% for AGIs below $25k, 2.8% for AGIs $25k-50k, 1.7% for AGIs $50k-75k, 2.2% for AGIs $100k-200k)
Taxable individual retirement arrangement distribution: $8,429 (reported on 10.8% of returns)
44451:
$8,429
Ohio:
$14,511
(% of AGI for various income ranges: 2.6% for AGIs below $25k, 2.3% for AGIs $25k-50k, 1.9% for AGIs $50k-75k, 4.7% for AGIs $75k-100k)
Total itemized deductions: $16,302 (19% of AGI, reported on 26.1% of returns)
Here:
$16,302
State:
$21,278
Here:
18.5% of AGI
State:
18.8% of AGI
(% of AGI for various income ranges: 8.7% for AGIs below $25k, 7.3% for AGIs $25k-50k, 8.9% for AGIs $50k-75k, 8.7% for AGIs $75k-100k, 11.5% for AGIs $100k-200k)
Charity contributions: $2,403 (reported on 18.5% of returns)
Here:
$2,403
State:
$3,943
(% of AGI for various income ranges: 0.4% for AGIs below $25k, 0.6% for AGIs $25k-50k, 0.9% for AGIs $50k-75k, 1.0% for AGIs $75k-100k, 1.4% for AGIs $100k-200k)
Taxes paid: $6,444 (reported on 26.1% of returns)
44451:
$6,444
State:
$9,568
(% of AGI for various income ranges: 1.7% for AGIs below $25k, 2.2% for AGIs $25k-50k, 3.0% for AGIs $50k-75k, 3.5% for AGIs $75k-100k, 4.0% for AGIs $100k-200k, 5.7% for AGIs over 200k)
Earned income credit: $1,614 (reported on 13.4% of returns)
Here:
$1,614
State:
$2,285
(% of AGI for various income ranges: 3.6% for AGIs below $25k, 0.6% for AGIs $25k-50k)
Percentage of individuals using paid preparers for their 2012 taxes: 61.1%
Here:
61%
State:
51%
(% for various income ranges: 50.9% for AGIs below $25k, 62.2% for AGIs $25k-50k, 62.5% for AGIs $50k-75k, 73.3% for AGIs $75k-100k, 87.5% for AGIs $100k-200k, 0.0% for AGIs over 200k)
Averages for the 2004 tax year for zip code 44451, filed in 2005:
Average Adjusted Gross Income (AGI) in 2004: $40,959 (Individual Income Tax Returns)
Here:
$40,959
State:
$44,480
Salary/wage: $37,986 (reported on 85.5% of returns)
Here:
$37,986
State:
$39,198
(% of AGI for various income ranges: 121.4% for AGIs below $10k, 70.5% for AGIs $10k-25k, 72.9% for AGIs $25k-50k, 84.4% for AGIs $50k-75k, 83.0% for AGIs $75k-100k, 78.2% for AGIs over 100k)
Taxable interest for individuals: $1,153 (reported on 53.0% of returns)
This zip code:
$1,153
Ohio:
$1,532
(% of AGI for various income ranges: 5.9% for AGIs below $10k, 3.0% for AGIs $10k-25k, 1.9% for AGIs $25k-50k, 1.2% for AGIs $50k-75k, 0.6% for AGIs $75k-100k, 1.1% for AGIs over 100k)
Taxable dividends: $1,342 (reported on 30.6% of returns)
Here:
$1,342
State:
$3,496
(% of AGI for various income ranges: 2.8% for AGIs below $10k, 1.6% for AGIs $10k-25k, 0.9% for AGIs $25k-50k, 0.7% for AGIs $50k-75k, 0.5% for AGIs $75k-100k, 1.5% for AGIs over 100k)
Net capital gain/loss: +$3,273 (reported on 19.0% of returns)
Here:
+$3,273
State:
+$8,582
(% of AGI for various income ranges: 1.9% for AGIs below $10k, -0.0% for AGIs $10k-25k, 1.0% for AGIs $25k-50k, 1.0% for AGIs $50k-75k, 0.9% for AGIs $75k-100k, 3.9% for AGIs over 100k)
Profit/loss from business: +$3,966 (reported on 14.8% of returns)
Here:
+$3,966
State:
+$10,813
(% of AGI for various income ranges: -11.9% for AGIs below $10k, -0.1% for AGIs $10k-25k, 2.7% for AGIs $25k-50k, 2.4% for AGIs $50k-75k, 0.7% for AGIs $75k-100k, 1.0% for AGIs over 100k)
IRA payment deduction: $2,923 (reported on 3.3% of returns)
44451:
$2,923
Ohio:
$2,794
Total itemized deductions: $13,804 (20% of AGI, reported on 33.0% of returns)
Here:
$13,804
State:
$17,503
Here:
20.1% of AGI
State:
20.8% of AGI
(% of AGI for various income ranges: 8.4% for AGIs $10k-25k, 9.6% for AGIs $25k-50k, 12.0% for AGIs $50k-75k, 13.8% for AGIs $75k-100k, 11.7% for AGIs over 100k)
Charity contributions deductions: $1,704 (2% of AGI, reported on 26.9% of returns)
Here:
$1,704
State:
$3,087
Here:
2.3% of AGI
State:
3.4% of AGI
(% of AGI for various income ranges: 0.6% for AGIs $10k-25k, 0.8% for AGIs $25k-50k, 1.3% for AGIs $50k-75k, 1.5% for AGIs $75k-100k, 1.2% for AGIs over 100k)
Total tax: $5,222 (reported on 79.9% of returns)
44451:
$5,222
State:
$6,781
(% of AGI for various income ranges: 3.7% for AGIs below $10k, 4.4% for AGIs $10k-25k, 7.4% for AGIs $25k-50k, 9.4% for AGIs $50k-75k, 11.1% for AGIs $75k-100k, 16.6% for AGIs over 100k)
Earned income credit: $1,371 (reported on 11.2% of returns)
Here:
$1,371
State:
$1,696
Percentage of individuals using paid preparers for their 2004 taxes: 60.9%
Here:
61%
State:
55%
(% for various income ranges: 46.9% for AGIs below $10k, 55.4% for AGIs $10k-25k, 67.7% for AGIs $25k-50k, 60.5% for AGIs $50k-75k, 75.2% for AGIs $75k-100k, 75.3% for AGIs over 100k)
Household received Food Stamps/SNAP in the past 12 months: 164 Household did not receive Food Stamps/SNAP in the past 12 months: 1,057
Women who had a birth in the past 12 months: 50 (38 now married, 12 unmarried) Women who did not have a birth in the past 12 months: 518 (322 now married, 194 unmarried)
Housing units in zip code 44451 with a mortgage: 557 (96 second mortgage, 90 both second mortgage and home equity loan) Houses without a mortgage: 29
Median monthly owner costs for units with a mortgage: $1,711 Median monthly owner costs for units without a mortgage: $475
Residents with income below the poverty level in 2022:
This zip code:
16.8%
Whole state:
13.4%
Residents with income below 50% of the poverty level in 2022:
This zip code:
8.6%
Whole state:
7.0%
Median number of rooms in houses and condos:
Here:
6.8
State:
6.7
Median number of rooms in apartments:
Here:
3.7
State:
4.4
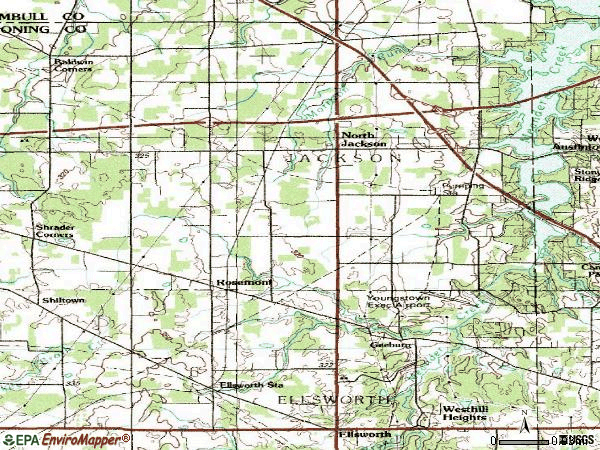
Notable locations in this zip code not listed on our city pages
Notable locations in zip code 44451: Girl Scout Camp (A), Schrader Corners (B), Lipkey Corners (C), North Jackson Station (D), Sandy Knoll Horse Farm (E), Ellsworth Station (F), Chucks Greenhouses (G), Pellin Ambulance Service Station 2 (H), National Shrine of Our Lady of Lebanon (I), Ellsworth Fire Department (J), Jackson Township Fire Department (K). Display/hide their locations on the map
Cemeteries: Eckis Cemetery (1), Covenanter Cemetery (2), Geeburg Cemetery (3), Methodist Church Cemetery (4), North Jackson Cemetery (5). Display/hide their locations on the map
In group quarters: 25 (-1 institutionalized population)
Size of family households: 382 2-persons, 341 3-persons, 71 4-persons, 65 5-persons, 26 7-or-more-persons
Size of nonfamily households: 297 1-person, 17 2-persons, 14 3-persons
458 married couples with children.
97 single-parent households (57 men, 40 women).
99.0% of residents of 44451 zip code speak English at home.
0.6% of residents speak other Indo-European language at home (94% very well, 6% well).
0.2% of residents speak other language at home (100% very well).
Foreign born population: 17 (0.6%) (82.6% of them are naturalized citizens)
This zip code:
0.6%
Whole state:
5.0%
41%United Kingdom, excluding England and Scotland
35%Sweden
29%Czechoslovakia (includes Czech Republic and Slovakia)
12%Zimbabwe
29%American
12%English
11%German
10%Irish
10%Italian
7%Polish
4%European
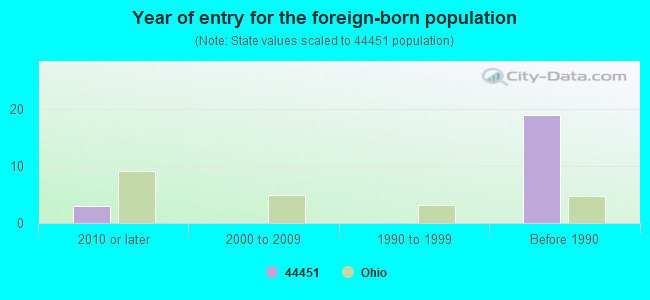
Year of entry for the foreign-born population
32010 or later
02000 to 2009
01990 to 1999
19Before 1990
Facilities with environmental interests located in this zip code:
ASC INC * (151 S BAILEY RD in NORTH JACKSON, OH)
STATE MASTER (Ohio general info) - AIR MAJOR STATE MASTER (Ohio general info) - PCS-OH0117234, National Pollutant Discharge Elimination System Permit Large Quantity Generators, more that 1000 kg of hazardous waste/month (Resource Conservation and Recovery Act (tracking hazardous waste)) - notification Organizations: DANIEL TURNER SR (CONTACT/OWNER)
Alternative names: ARCHITECTURAL STEEL PRODUCTS
ADVANCED ENVIRONMENTAL TECH SERVICES (12480B DEBARTOLO DR in NORTH JACKSON, OH)
STATE MASTER (Ohio general info) - RCRA-OHR000002444, HAZARDOUS WASTE PROGRAM Conditionally Exempt Small Quantity Generators, less than 100 kg/month of hazardous waste (Resource Conservation and Recovery Act (tracking hazardous waste)) - notification Organizations: ADVANCED ENVIRONMENTAL TECH SERVS (CONTACT/OWNER)
ALLIED CORPORATION PLANT #74 (1661 BAILEY RD in NORTH JACKSON, OH)
Housing units lacking complete plumbing facilities: 1.1% Housing units lacking complete kitchen facilities: 3.9%
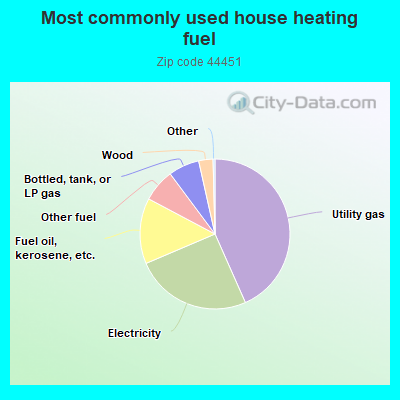
43.5%Utility gas
25.3%Electricity
14.2%Fuel oil, kerosene, etc.
7.1%Other fuel
6.7%Bottled, tank, or LP gas
3.1%Wood
Population in 1990: 2,448. Population change in the 1990s: +653 (+26.7%).
Place of birth for U.S.-born residents:
This state: 2,332
Northeast: 376
Midwest: 53
South: 159
West: 44
68% of the 44451 zip code residents lived in the same house 5 years ago. Out of people who lived in different houses, 75% lived in this county. Out of people who lived in different counties, 50% lived in Ohio.
90% of the 44451 zip code residents lived in the same house 1 year ago. Out of people who lived in different houses, 71% moved from this county. Out of people who lived in different houses, 9% moved from different county within same state. Out of people who lived in different houses, 16% moved from different state.
Private vs. public school enrollment:
Students in private schools in grades 1 to 8 (elementary and middle school): 56
Here:
18.0%
Ohio:
16.0%
Students in private schools in grades 9 to 12 (high school): 34
Here:
17.9%
Ohio:
13.1%
Students in private undergraduate colleges: 14
Here:
29.8%
Ohio:
22.3%
Occupation by median earnings in the past 12 months ($)
149,140Business and financial operations occupations
113,933Transportation occupations
108,524Architecture and engineering occupations
76,503Management occupations
74,072Production occupations
62,531Health diagnosing and treating practitioners and other technical occupations
Companies with federal contracts located in this zip code:
WASTE MANAGEMENT, INC (12201 COUNCIL DR in NORTH JACKSON, OH)
$32,000 with Air Force for Trash/Garbage Collection Services - Including Portable Sanitation Services. Signed on 2003-10-01. Completion date: 2004-09-30.
SOVEREIGN CIRCUITS, INC (12080 DEBARTOLO DR in NORTH JACKSON, OH; small business)
$20,419 with Navy for Miscellaneous Electrical and Electronic Components. Signed on 2004-11-01. Completion date: 2004-12-15.
EVERBRITE INC (12546 MAHONING AVE in NORTH JACKSON, OH; small business) : $4,470 in 3 contractsin 2003
$2,400 with Army for Snow Removal/Salt Service (also spreading aggregate or other snow melting material). Signed on 2003-11-01. Completion date: 2004-10-31.
$2,070, same as above.Signed on 2003-05-05. Completion date: 2003-10-31.
$0, same as above.Signed on 2003-05-05. Completion date: 2003-10-31.
Top industries in this zip code by the number of employees in 2005:
People in group quarters in 2010:
38 people in college/university student housing
People in group quarters in 2000:
19 people in other noninstitutional group quarters
8 people in college dormitories (includes college quarters off campus)
Fatal accident statistics in 2014:
Fatal accident count: 1
Vehicles involved in fatal accidents: 1
Fatal accidents caused by drunken drivers: 1
Fatalities: 1
Persons involved in fatal accidents: 1
Pedestrians involved in fatal accidents: 0
Fatal accident statistics in 2013:
Fatal accident count: 1
Vehicles involved in fatal accidents: 2
Fatal accidents caused by drunken drivers: 0
Fatalities: 2
Persons involved in fatal accidents: 5
Pedestrians involved in fatal accidents: 0
Home Mortgage Disclosure Act Aggregated Statistics For Year 2009 (Based on 6 partial tracts)
A) FHA, FSA/RHS & VA Home Purchase Loans
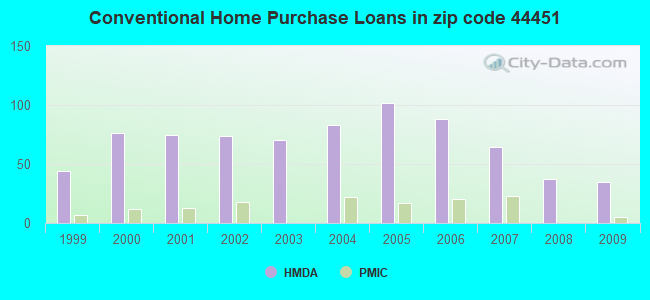
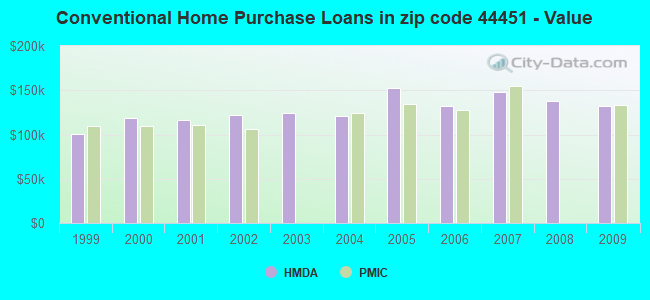
B) Conventional Home Purchase Loans
C) Refinancings
D) Home Improvement Loans
F) Non-occupant Loans on < 5 Family Dwellings (A B C & D)
G) Loans On Manufactured Home Dwelling (A B C & D)
Number
Average Value
Number
Average Value
Number
Average Value
Number
Average Value
Number
Average Value
Number
Average Value
LOANS ORIGINATED
16
$93,898
35
$131,696
138
$126,991
14
$66,833
14
$137,011
5
$84,810
APPLICATIONS APPROVED, NOT ACCEPTED
0
$0
2
$76,790
17
$167,989
1
$51,190
1
$168,120
0
$0
APPLICATIONS DENIED
4
$122,220
7
$144,506
88
$144,006
15
$38,236
3
$66,277
2
$28,035
APPLICATIONS WITHDRAWN
2
$100,325
0
$0
33
$134,965
2
$309,435
2
$99,345
0
$0
FILES CLOSED FOR INCOMPLETENESS
2
$119,650
0
$0
3
$183,643
0
$0
0
$0
0
$0
Aggregated Statistics For Year 2008 (Based on 6 partial tracts)
A) FHA, FSA/RHS & VA Home Purchase Loans
B) Conventional Home Purchase Loans
C) Refinancings
D) Home Improvement Loans
F) Non-occupant Loans on < 5 Family Dwellings (A B C & D)
G) Loans On Manufactured Home Dwelling (A B C & D)
Number
Average Value
Number
Average Value
Number
Average Value
Number
Average Value
Number
Average Value
Number
Average Value
LOANS ORIGINATED
13
$135,532
37
$138,066
74
$137,125
22
$35,622
8
$190,071
1
$115,390
APPLICATIONS APPROVED, NOT ACCEPTED
0
$0
5
$148,696
18
$81,397
0
$0
1
$77,620
0
$0
APPLICATIONS DENIED
2
$92,120
15
$85,788
59
$113,054
10
$22,093
4
$98,888
1
$72,570
APPLICATIONS WITHDRAWN
0
$0
1
$263,720
30
$143,548
0
$0
2
$277,465
0
$0
FILES CLOSED FOR INCOMPLETENESS
0
$0
2
$84,675
5
$120,196
0
$0
0
$0
0
$0
Aggregated Statistics For Year 2007 (Based on 6 partial tracts)
A) FHA, FSA/RHS & VA Home Purchase Loans
B) Conventional Home Purchase Loans
C) Refinancings
D) Home Improvement Loans
F) Non-occupant Loans on < 5 Family Dwellings (A B C & D)
G) Loans On Manufactured Home Dwelling (A B C & D)
Number
Average Value
Number
Average Value
Number
Average Value
Number
Average Value
Number
Average Value
Number
Average Value
LOANS ORIGINATED
3
$86,703
64
$147,810
106
$111,991
27
$33,178
17
$197,370
2
$72,815
APPLICATIONS APPROVED, NOT ACCEPTED
0
$0
5
$170,206
31
$113,128
3
$127,163
2
$126,750
0
$0
APPLICATIONS DENIED
1
$45,450
15
$83,468
112
$125,418
12
$51,383
2
$72,200
2
$74,100
APPLICATIONS WITHDRAWN
0
$0
3
$120,553
40
$122,261
3
$49,667
1
$152,730
0
$0
FILES CLOSED FOR INCOMPLETENESS
1
$113,010
1
$201,500
10
$145,797
0
$0
0
$0
0
$0
Aggregated Statistics For Year 2006 (Based on 6 partial tracts)
A) FHA, FSA/RHS & VA Home Purchase Loans
B) Conventional Home Purchase Loans
C) Refinancings
D) Home Improvement Loans
F) Non-occupant Loans on < 5 Family Dwellings (A B C & D)
G) Loans On Manufactured Home Dwelling (A B C & D)
Number
Average Value
Number
Average Value
Number
Average Value
Number
Average Value
Number
Average Value
Number
Average Value
LOANS ORIGINATED
4
$108,478
88
$131,949
147
$108,109
29
$53,086
20
$115,778
4
$76,202
APPLICATIONS APPROVED, NOT ACCEPTED
0
$0
11
$110,103
33
$106,570
5
$87,264
3
$67,150
0
$0
APPLICATIONS DENIED
3
$121,653
17
$120,756
134
$131,884
18
$27,806
8
$155,039
3
$51,270
APPLICATIONS WITHDRAWN
0
$0
12
$106,141
87
$137,753
5
$68,116
2
$95,765
0
$0
FILES CLOSED FOR INCOMPLETENESS
0
$0
4
$60,318
16
$107,579
0
$0
2
$68,380
0
$0
Aggregated Statistics For Year 2005 (Based on 6 partial tracts)
A) FHA, FSA/RHS & VA Home Purchase Loans
B) Conventional Home Purchase Loans
C) Refinancings
D) Home Improvement Loans
F) Non-occupant Loans on < 5 Family Dwellings (A B C & D)
G) Loans On Manufactured Home Dwelling (A B C & D)
Number
Average Value
Number
Average Value
Number
Average Value
Number
Average Value
Number
Average Value
Number
Average Value
LOANS ORIGINATED
3
$99,030
102
$152,743
184
$107,528
22
$38,650
22
$116,851
5
$75,560
APPLICATIONS APPROVED, NOT ACCEPTED
0
$0
12
$125,288
59
$128,045
6
$65,622
9
$138,233
1
$78,830
APPLICATIONS DENIED
0
$0
24
$90,779
124
$106,439
20
$59,458
8
$54,710
5
$58,434
APPLICATIONS WITHDRAWN
3
$117,767
26
$97,851
107
$125,350
10
$116,457
12
$115,411
1
$154,160
FILES CLOSED FOR INCOMPLETENESS
0
$0
4
$56,422
28
$104,900
0
$0
3
$124,003
0
$0
Aggregated Statistics For Year 2004 (Based on 6 partial tracts)
A) FHA, FSA/RHS & VA Home Purchase Loans
B) Conventional Home Purchase Loans
C) Refinancings
D) Home Improvement Loans
F) Non-occupant Loans on < 5 Family Dwellings (A B C & D)
G) Loans On Manufactured Home Dwelling (A B C & D)
Number
Average Value
Number
Average Value
Number
Average Value
Number
Average Value
Number
Average Value
Number
Average Value
LOANS ORIGINATED
2
$94,865
83
$120,964
156
$106,076
23
$35,227
18
$80,774
2
$63,820
APPLICATIONS APPROVED, NOT ACCEPTED
0
$0
12
$76,198
38
$106,972
3
$27,037
4
$41,728
1
$81,420
APPLICATIONS DENIED
2
$83,200
14
$75,309
121
$105,495
18
$38,629
13
$86,962
5
$46,074
APPLICATIONS WITHDRAWN
1
$249,650
21
$139,176
84
$123,796
5
$41,700
1
$105,910
3
$63,193
FILES CLOSED FOR INCOMPLETENESS
0
$0
3
$93,847
19
$101,239
1
$14,480
0
$0
1
$103,690
Aggregated Statistics For Year 2003 (Based on 6 partial tracts)
A) FHA, FSA/RHS & VA Home Purchase Loans
B) Conventional Home Purchase Loans
C) Refinancings
D) Home Improvement Loans
F) Non-occupant Loans on < 5 Family Dwellings (A B C & D)
Number
Average Value
Number
Average Value
Number
Average Value
Number
Average Value
Number
Average Value
LOANS ORIGINATED
4
$129,872
70
$124,487
393
$113,224
29
$51,958
25
$130,988
APPLICATIONS APPROVED, NOT ACCEPTED
2
$59,825
10
$81,212
66
$119,619
3
$54,477
3
$76,253
APPLICATIONS DENIED
1
$197,800
16
$86,828
147
$103,691
20
$26,351
7
$61,941
APPLICATIONS WITHDRAWN
0
$0
11
$141,394
73
$130,813
0
$0
2
$93,360
FILES CLOSED FOR INCOMPLETENESS
0
$0
1
$41,820
14
$129,516
0
$0
0
$0
Aggregated Statistics For Year 2002 (Based on 6 partial tracts)
A) FHA, FSA/RHS & VA Home Purchase Loans
B) Conventional Home Purchase Loans
C) Refinancings
D) Home Improvement Loans
F) Non-occupant Loans on < 5 Family Dwellings (A B C & D)
Number
Average Value
Number
Average Value
Number
Average Value
Number
Average Value
Number
Average Value
LOANS ORIGINATED
7
$94,911
74
$122,524
243
$104,088
21
$42,633
12
$112,124
APPLICATIONS APPROVED, NOT ACCEPTED
0
$0
11
$67,430
46
$108,547
3
$5,747
3
$61,897
APPLICATIONS DENIED
0
$0
16
$129,636
115
$107,586
8
$29,498
3
$68,023
APPLICATIONS WITHDRAWN
1
$59,120
12
$121,073
72
$115,181
2
$16,435
1
$151,630
FILES CLOSED FOR INCOMPLETENESS
0
$0
3
$49,053
16
$120,489
0
$0
2
$14,725
Aggregated Statistics For Year 2001 (Based on 6 partial tracts)
A) FHA, FSA/RHS & VA Home Purchase Loans
B) Conventional Home Purchase Loans
C) Refinancings
D) Home Improvement Loans
F) Non-occupant Loans on < 5 Family Dwellings (A B C & D)
Number
Average Value
Number
Average Value
Number
Average Value
Number
Average Value
Number
Average Value
LOANS ORIGINATED
7
$93,753
75
$116,077
263
$99,933
37
$17,288
14
$89,004
APPLICATIONS APPROVED, NOT ACCEPTED
0
$0
8
$98,928
43
$72,715
7
$14,827
2
$55,985
APPLICATIONS DENIED
1
$44,410
15
$69,961
107
$91,574
14
$28,302
1
$93,710
APPLICATIONS WITHDRAWN
0
$0
10
$107,802
53
$93,434
5
$15,726
5
$123,054
FILES CLOSED FOR INCOMPLETENESS
0
$0
0
$0
18
$92,860
0
$0
0
$0
Aggregated Statistics For Year 2000 (Based on 6 partial tracts)
A) FHA, FSA/RHS & VA Home Purchase Loans
B) Conventional Home Purchase Loans
C) Refinancings
D) Home Improvement Loans
E) Loans on Dwellings For 5+ Families
F) Non-occupant Loans on < 5 Family Dwellings (A B C & D)
Number
Average Value
Number
Average Value
Number
Average Value
Number
Average Value
Number
Average Value
Number
Average Value
LOANS ORIGINATED
5
$91,330
76
$118,415
113
$75,466
31
$14,194
1
$106,990
7
$93,906
APPLICATIONS APPROVED, NOT ACCEPTED
0
$0
5
$76,488
33
$78,170
9
$10,122
0
$0
1
$113,890
APPLICATIONS DENIED
1
$93,520
33
$78,335
73
$90,591
13
$16,179
0
$0
5
$269,054
APPLICATIONS WITHDRAWN
0
$0
6
$110,092
24
$94,969
9
$33,587
0
$0
0
$0
FILES CLOSED FOR INCOMPLETENESS
0
$0
2
$143,585
13
$83,832
0
$0
0
$0
0
$0
Aggregated Statistics For Year 1999 (Based on 3 partial tracts)
A) FHA, FSA/RHS & VA Home Purchase Loans
B) Conventional Home Purchase Loans
C) Refinancings
D) Home Improvement Loans
F) Non-occupant Loans on < 5 Family Dwellings (A B C & D)
2002 - 2018 National Fire Incident Reporting System (NFIRS) incidents
Based on the data from the years 2002 - 2018 the average number of fires per year is 26. The highest number of reported fires - 49 took place in 2003, and the least - 3 in 2005. The data has an increasing trend.
When looking into fire subcategories, the most reports belonged to: Mobile Property/Vehicle Fires (34.9%), and Structure Fires (31.9%).
Fire incident types reported to NFIRS in Zip Code 44451


 Nearest zip codes: 44440, 44401, 44481, 44515, 44429, 44406.


 Based on the data from the years 2002 - 2018 the average number of fires per year is 26. The highest number of reported fires - 49 took place in 2003, and the least - 3 in 2005. The data has an increasing trend.
 When looking into fire subcategories, the most reports belonged to: Mobile Property/Vehicle Fires (34.9%), and Structure Fires (31.9%).