Estimated zip code population in 2022: 1,954 Zip code population in 2010: 2,011 Zip code population in 2000: 2,347
Houses and condos: 816 Renter-occupied apartments: 249
% of renters here:
31%
State:
33%
March 2022 cost of living index in zip code 44613: 89.6 (less than average, U.S. average is 100)
Land area: 1.9 sq. mi. Water area: 0.0 sq. mi.
Population density: 1,002 people per square mile
(low).
OSM Map
General Map
Google Map
MSN Map
OSM Map
General Map
Google Map
MSN Map
OSM Map
General Map
Google Map
MSN Map
OSM Map
General Map
Google Map
MSN Map
Please wait while loading the map...
Real estate property taxes paid for housing units in 2022:
This zip code:
1.1% ($1,560)
Ohio:
1.3% ($2,639)
Median real estate property taxes paid for housing units with mortgages in 2022: $1,517 (1.1%) Median real estate property taxes paid for housing units with no mortgage in 2022: $1,832 (1.3%)
Estimated median house/condo value in 2022: $140,187
44613:
$140,187
Ohio:
$204,100
Median resident age:
This zip code:
50.8 years
Ohio median age:
39.9 years
Average household size:
This zip code:
2.3 people
Ohio:
2.4 people
Averages for the 2020 tax year for zip code 44613, filed in 2021:
Average Adjusted Gross Income (AGI) in 2020: $45,591 (Individual Income Tax Returns)
Here:
$45,591
State:
$67,288
Salary/wage: $43,145 (reported on 83.0% of returns)
Here:
$43,145
State:
$55,628
(% of AGI for various income ranges: 1134.3% for AGIs below $25k, 3743.8% for AGIs $25k-50k, 6491.4% for AGIs $50k-75k, 9390.0% for AGIs $75k-100k, 16140.0% for AGIs $100k-200k)
Taxable interest for individuals: $279 (reported on 24.0% of returns)
This zip code:
$279
Ohio:
$1,518
(% of AGI for various income ranges: 5.7% for AGIs below $25k, 8.5% for AGIs $25k-50k, 13.6% for AGIs $50k-75k, 14.0% for AGIs $75k-100k, 10.0% for AGIs $100k-200k)
Ordinary dividends: $638 (reported on 8.0% of returns)
Here:
$638
State:
$7,167
(% of AGI for various income ranges: 9.6% for AGIs $25k-50k, 10.7% for AGIs $50k-75k, 18.3% for AGIs $100k-200k)
Net capital gain/loss in AGI: +$3,814 (reported on 7.0% of returns)
Here:
+$3,814
State:
+$18,919
(% of AGI for various income ranges: 45.7% for AGIs below $25k, 84.3% for AGIs $50k-75k, 88.0% for AGIs $75k-100k)
Profit/loss from business: +$7,733 (reported on 6.0% of returns)
Here:
+$7,733
State:
+$13,744
(% of AGI for various income ranges: 49.1% for AGIs below $25k, 55.4% for AGIs $25k-50k, 147.9% for AGIs $50k-75k)
Taxable individual retirement arrangement distribution: $9,444 (reported on 9.0% of returns)
44613:
$9,444
Ohio:
$18,876
(% of AGI for various income ranges: 65.7% for AGIs below $25k, 96.9% for AGIs $25k-50k, 319.3% for AGIs $50k-75k)
Earned income credit: $1,913 (reported on 15.0% of returns)
Here:
$1,913
State:
$2,304
(% of AGI for various income ranges: 51.3% for AGIs below $25k, 65.0% for AGIs $25k-50k)
Percentage of individuals using paid preparers for their 2020 taxes: 95.0%
Here:
95%
State:
94%
(% for various income ranges: 93.5% for AGIs below $25k, 94.1% for AGIs $25k-50k, 94.7% for AGIs $50k-75k, 100.0% for AGIs $75k-100k, 100.0% for AGIs $100k-200k)
Averages for the 2012 tax year for zip code 44613, filed in 2013:
Average Adjusted Gross Income (AGI) in 2012: $38,326 (Individual Income Tax Returns)
Here:
$38,326
State:
$54,926
Salary/wage: $36,433 (reported on 85.6% of returns)
Here:
$36,433
State:
$45,869
(% of AGI for various income ranges: 71.2% for AGIs below $25k, 81.7% for AGIs $25k-50k, 86.4% for AGIs $50k-75k, 83.7% for AGIs $75k-100k, 75.5% for AGIs $100k-200k)
Taxable interest for individuals: $226 (reported on 27.8% of returns)
This zip code:
$226
Ohio:
$1,297
(% of AGI for various income ranges: 0.3% for AGIs below $25k, 0.2% for AGIs $25k-50k, 0.1% for AGIs $50k-75k, 0.1% for AGIs $75k-100k)
Ordinary dividends: $650 (reported on 10.3% of returns)
Here:
$650
State:
$5,821
(% of AGI for various income ranges: 0.3% for AGIs below $25k, 0.2% for AGIs $25k-50k, 0.2% for AGIs $50k-75k)
Profit/loss from business: +$3,025 (reported on 8.2% of returns)
Here:
+$3,025
State:
+$12,773
(% of AGI for various income ranges: 2.2% for AGIs below $25k, 1.2% for AGIs $25k-50k)
Taxable individual retirement arrangement distribution: $7,825 (reported on 8.2% of returns)
44613:
$7,825
Ohio:
$14,511
(% of AGI for various income ranges: 3.9% for AGIs below $25k, 1.2% for AGIs $25k-50k, 3.2% for AGIs $50k-75k)
Total itemized deductions: $13,594 (22% of AGI, reported on 17.5% of returns)
Here:
$13,594
State:
$21,278
Here:
22.5% of AGI
State:
18.8% of AGI
(% of AGI for various income ranges: 4.9% for AGIs below $25k, 4.5% for AGIs $25k-50k, 6.2% for AGIs $50k-75k, 6.8% for AGIs $75k-100k, 11.7% for AGIs $100k-200k)
Charity contributions: $2,636 (reported on 11.3% of returns)
Here:
$2,636
State:
$3,943
(% of AGI for various income ranges: 0.6% for AGIs $25k-50k, 0.6% for AGIs $50k-75k, 2.2% for AGIs $75k-100k)
Taxes paid: $4,129 (reported on 17.5% of returns)
44613:
$4,129
State:
$9,568
(% of AGI for various income ranges: 0.9% for AGIs below $25k, 1.3% for AGIs $25k-50k, 1.8% for AGIs $50k-75k, 2.2% for AGIs $75k-100k, 4.3% for AGIs $100k-200k)
Earned income credit: $1,800 (reported on 17.5% of returns)
Here:
$1,800
State:
$2,285
(% of AGI for various income ranges: 4.3% for AGIs below $25k, 0.9% for AGIs $25k-50k)
Percentage of individuals using paid preparers for their 2012 taxes: 57.7%
Here:
58%
State:
51%
(% for various income ranges: 52.6% for AGIs below $25k, 59.4% for AGIs $25k-50k, 62.5% for AGIs $50k-75k, 62.5% for AGIs $75k-100k, 66.7% for AGIs $100k-200k)
Averages for the 2004 tax year for zip code 44613, filed in 2005:
Average Adjusted Gross Income (AGI) in 2004: $32,100 (Individual Income Tax Returns)
Here:
$32,100
State:
$44,480
Salary/wage: $30,709 (reported on 87.7% of returns)
Here:
$30,709
State:
$39,198
(% of AGI for various income ranges: 85.9% for AGIs below $10k, 74.7% for AGIs $10k-25k, 83.6% for AGIs $25k-50k, 88.4% for AGIs $50k-75k, 83.6% for AGIs $75k-100k, 85.0% for AGIs over 100k)
Taxable interest for individuals: $638 (reported on 39.3% of returns)
This zip code:
$638
Ohio:
$1,532
(% of AGI for various income ranges: 2.6% for AGIs below $10k, 2.4% for AGIs $10k-25k, 0.5% for AGIs $25k-50k, 0.3% for AGIs $50k-75k, 0.4% for AGIs $75k-100k, 0.5% for AGIs over 100k)
Taxable dividends: $476 (reported on 14.0% of returns)
Here:
$476
State:
$3,496
(% of AGI for various income ranges: 0.6% for AGIs below $10k, 0.5% for AGIs $10k-25k, 0.2% for AGIs $25k-50k, 0.2% for AGIs $50k-75k, 0.2% for AGIs $75k-100k)
Net capital gain/loss: +$1,094 (reported on 9.4% of returns)
Here:
+$1,094
State:
+$8,582
(% of AGI for various income ranges: -0.2% for AGIs $10k-25k, 0.7% for AGIs $25k-50k, 0.2% for AGIs $50k-75k, 0.3% for AGIs $75k-100k)
Profit/loss from business: +$5,618 (reported on 8.7% of returns)
Here:
+$5,618
State:
+$10,813
(% of AGI for various income ranges: 0.9% for AGIs below $10k, 2.0% for AGIs $10k-25k, 2.0% for AGIs $25k-50k, 1.5% for AGIs $50k-75k)
IRA payment deduction: $1,846 (reported on 1.3% of returns)
44613:
$1,846
Ohio:
$2,794
Total itemized deductions: $12,191 (24% of AGI, reported on 22.5% of returns)
Here:
$12,191
State:
$17,503
Here:
24.5% of AGI
State:
20.8% of AGI
(% of AGI for various income ranges: 5.5% for AGIs $10k-25k, 8.3% for AGIs $25k-50k, 10.4% for AGIs $50k-75k, 15.7% for AGIs $75k-100k)
Charity contributions deductions: $1,678 (3% of AGI, reported on 17.9% of returns)
Here:
$1,678
State:
$3,087
Here:
3.3% of AGI
State:
3.4% of AGI
(% of AGI for various income ranges: 0.7% for AGIs $10k-25k, 0.8% for AGIs $25k-50k, 1.3% for AGIs $50k-75k, 1.5% for AGIs $75k-100k)
Total tax: $3,051 (reported on 74.9% of returns)
44613:
$3,051
State:
$6,781
(% of AGI for various income ranges: 1.2% for AGIs below $10k, 4.0% for AGIs $10k-25k, 6.5% for AGIs $25k-50k, 8.0% for AGIs $50k-75k, 10.8% for AGIs $75k-100k, 13.7% for AGIs over 100k)
Earned income credit: $1,610 (reported on 14.3% of returns)
Here:
$1,610
State:
$1,696
Percentage of individuals using paid preparers for their 2004 taxes: 55.0%
Here:
55%
State:
55%
(% for various income ranges: 42.3% for AGIs below $10k, 59.3% for AGIs $10k-25k, 57.6% for AGIs $25k-50k, 56.8% for AGIs $50k-75k, 71.4% for AGIs $75k-100k)
Household received Food Stamps/SNAP in the past 12 months: 51 Household did not receive Food Stamps/SNAP in the past 12 months: 751
Women who had a birth in the past 12 months: 12 (13 now married, 0 unmarried) Women who did not have a birth in the past 12 months: 335 (148 now married, 186 unmarried)
Housing units in zip code 44613 with a mortgage: 347 (21 second mortgage, 12 both second mortgage and home equity loan) Houses without a mortgage: 38
Median monthly owner costs for units with a mortgage: $988 Median monthly owner costs for units without a mortgage: $468
Residents with income below the poverty level in 2022:
This zip code:
8.5%
Whole state:
13.4%
Residents with income below 50% of the poverty level in 2022:
This zip code:
6.5%
Whole state:
7.0%
Median number of rooms in houses and condos:
Here:
6.0
State:
6.7
Median number of rooms in apartments:
Here:
5.6
State:
4.4
Notable locations in this zip code not listed on our city pages
In group quarters: 84 (-1 institutionalized population)
Size of family households: 335 2-persons, 83 3-persons, 71 4-persons, 34 5-persons, 17 6-persons, 4 7-or-more-persons
Size of nonfamily households: 226 1-person, 31 2-persons
133 married couples with children.
167 single-parent households (79 men, 88 women).
98.5% of residents of 44613 zip code speak English at home.
0.6% of residents speak Spanish at home (100% very well).
0.9% of residents speak other Indo-European language at home (100% very well).
Foreign born population: 12 (0.6%) (100.0% of them are naturalized citizens)
This zip code:
0.6%
Whole state:
5.0%
50%France
33%North Macedonia (Macedonia)
31%American
13%English
9%Romanian
9%Italian
9%German
6%Irish
3%Slovak
Year of entry for the foreign-born population
02010 or later
52000 to 2009
01990 to 1999
5Before 1990
Facilities with environmental interests located in this zip code:
BREWSTER PWS (310 S WABASH AVE in BREWSTER, OH)
STATE MASTER (Ohio general info) - PCS-OH0008630, National Pollutant Discharge Elimination System Permit, SDWIS-7600512, DRINKING WATER PROGRAM National Pollutant Discharge Elimination System NON-MAJOR (Tracking pollutant discharge elimination systems) - permit COMMUNITY WATER SYSTEM (SDWIS) - SDWIS-OH7600512 1, WATER TREATMENT PLANT WATER TREATMENT PLANT (SDWIS) Business SIC classification: SEWERAGE SYSTEMS Organizations: VILLAGE OF BREWSTER (CONTACT/OWNER)
Alternative names: VILLAGE OF BREWSTER
BREWSTER DAIRY CONTROL PLANT (675 S WABASH AVE in BREWSTER, OH)
STATE MASTER (Ohio general info) - PCS-OH0052191, National Pollutant Discharge Elimination System Permit, AIR MAJOR, EPCRA, SDWIS-7631512, DRINKING WATER PROGRAM National Pollutant Discharge Elimination System NON-MAJOR (Tracking pollutant discharge elimination systems) - permit Business SIC classification: NATURAL, PROCESSED, AND IMITATION CHEESE Organizations: BREWSTER DAIRY INC (CONTACT/OWNER)
BREWSTER STP (862 S WABASH in BREWSTER, OH)
STATE MASTER (Ohio general info) - PCS-OH0020567, National Pollutant Discharge Elimination System Permit National Pollutant Discharge Elimination System NON-MAJOR (Tracking pollutant discharge elimination systems) - permit Business SIC classification: SEWERAGE SYSTEMS Alternative names: BREWSTER, VILLAGE OF, VILLAGE OF BREWSTER
Housing units lacking complete kitchen facilities: 0.4%
81.9%Utility gas
14.2%Electricity
3.4%Bottled, tank, or LP gas
0.6%Other fuel
Population in 1990: 2,129. Population change in the 1990s: +218 (+10.2%).
Place of birth for U.S.-born residents:
This state: 1,736
Northeast: 62
Midwest: 32
South: 85
West: 23
68% of the 44613 zip code residents lived in the same house 5 years ago. Out of people who lived in different houses, 73% lived in this county. Out of people who lived in different counties, 50% lived in Ohio.
94% of the 44613 zip code residents lived in the same house 1 year ago. Out of people who lived in different houses, 73% moved from this county. Out of people who lived in different houses, 18% moved from different county within same state. Out of people who lived in different houses, 9% moved from different state.
Private vs. public school enrollment:
Students in private schools in grades 1 to 8 (elementary and middle school):
Here:
0.0%
Ohio:
16.0%
Students in private schools in grades 9 to 12 (high school): 11
Here:
15.5%
Ohio:
13.1%
Students in private undergraduate colleges: 10
Here:
13.8%
Ohio:
22.3%
Occupation by median earnings in the past 12 months ($)
62,633Installation, maintenance, and repair occupations
58,196Sales and related occupations
56,062Health diagnosing and treating practitioners and other technical occupations
48,328Management occupations
45,942Business and financial operations occupations
43,861Transportation occupations
Top industries in this zip code by the number of employees in 2005:
Health Care and Social Assistance: Nursing Care Facilities (100-249 employees: 1 establishment)
Other Services (except Public Administration): Civic and Social Organizations (10-19: 2)
Accommodation and Food Services: Limited-Service Restaurants (10-19: 1)
Finance and Insurance: Commercial Banking (5-9: 2)
Other Services (except Public Administration): Religious Organizations (5-9: 2)
Professional, Scientific, and Technical Services: Administrative Management and General Management Consulting Services (5-9: 1)
People in group quarters in 2010:
53 people in nursing facilities/skilled-nursing facilities
36 people in group homes intended for adults
People in group quarters in 2000:
86 people in nursing homes
Home Mortgage Disclosure Act Aggregated Statistics For Year 2009 (Based on 2 partial tracts)
A) FHA, FSA/RHS & VA Home Purchase Loans
B) Conventional Home Purchase Loans
C) Refinancings
D) Home Improvement Loans
F) Non-occupant Loans on < 5 Family Dwellings (A B C & D)
Number
Average Value
Number
Average Value
Number
Average Value
Number
Average Value
Number
Average Value
LOANS ORIGINATED
4
$82,848
2
$85,605
11
$126,160
0
$0
0
$0
APPLICATIONS APPROVED, NOT ACCEPTED
1
$42,970
0
$0
2
$72,400
0
$0
0
$0
APPLICATIONS DENIED
2
$86,110
0
$0
14
$98,600
1
$35,950
1
$36,450
APPLICATIONS WITHDRAWN
0
$0
1
$77,580
3
$111,747
0
$0
0
$0
FILES CLOSED FOR INCOMPLETENESS
0
$0
0
$0
1
$47,820
0
$0
0
$0
Aggregated Statistics For Year 2008 (Based on 2 partial tracts)
A) FHA, FSA/RHS & VA Home Purchase Loans
B) Conventional Home Purchase Loans
C) Refinancings
D) Home Improvement Loans
F) Non-occupant Loans on < 5 Family Dwellings (A B C & D)
G) Loans On Manufactured Home Dwelling (A B C & D)
Number
Average Value
Number
Average Value
Number
Average Value
Number
Average Value
Number
Average Value
Number
Average Value
LOANS ORIGINATED
4
$96,515
5
$104,166
10
$100,270
2
$24,995
2
$44,140
1
$59,860
APPLICATIONS APPROVED, NOT ACCEPTED
0
$0
1
$59,360
2
$100,990
0
$0
0
$0
1
$34,110
APPLICATIONS DENIED
1
$84,770
3
$50,997
16
$95,482
3
$29,817
1
$65,710
1
$67,550
APPLICATIONS WITHDRAWN
0
$0
0
$0
2
$154,325
0
$0
0
$0
0
$0
FILES CLOSED FOR INCOMPLETENESS
0
$0
0
$0
1
$111,190
0
$0
0
$0
0
$0
Aggregated Statistics For Year 2007 (Based on 2 partial tracts)
A) FHA, FSA/RHS & VA Home Purchase Loans
B) Conventional Home Purchase Loans
C) Refinancings
D) Home Improvement Loans
G) Loans On Manufactured Home Dwelling (A B C & D)
Number
Average Value
Number
Average Value
Number
Average Value
Number
Average Value
Number
Average Value
LOANS ORIGINATED
1
$137,770
7
$90,121
15
$76,845
3
$34,667
2
$50,745
APPLICATIONS APPROVED, NOT ACCEPTED
0
$0
1
$189,440
4
$84,688
1
$29,430
1
$48,490
APPLICATIONS DENIED
1
$41,470
2
$104,835
17
$100,999
4
$53,212
1
$33,110
APPLICATIONS WITHDRAWN
0
$0
1
$168,040
5
$129,914
1
$65,210
0
$0
FILES CLOSED FOR INCOMPLETENESS
0
$0
1
$209,840
2
$126,070
0
$0
0
$0
Aggregated Statistics For Year 2006 (Based on 2 partial tracts)
A) FHA, FSA/RHS & VA Home Purchase Loans
B) Conventional Home Purchase Loans
C) Refinancings
D) Home Improvement Loans
F) Non-occupant Loans on < 5 Family Dwellings (A B C & D)
G) Loans On Manufactured Home Dwelling (A B C & D)
Number
Average Value
Number
Average Value
Number
Average Value
Number
Average Value
Number
Average Value
Number
Average Value
LOANS ORIGINATED
1
$111,860
14
$94,791
20
$80,097
6
$24,077
3
$54,563
1
$88,110
APPLICATIONS APPROVED, NOT ACCEPTED
0
$0
1
$88,280
6
$86,247
1
$12,040
1
$46,650
0
$0
APPLICATIONS DENIED
0
$0
4
$92,795
18
$103,794
4
$32,438
2
$75,825
2
$60,360
APPLICATIONS WITHDRAWN
0
$0
1
$92,630
8
$108,199
1
$28,260
0
$0
0
$0
FILES CLOSED FOR INCOMPLETENESS
0
$0
0
$0
3
$89,340
0
$0
0
$0
0
$0
Aggregated Statistics For Year 2005 (Based on 2 partial tracts)
A) FHA, FSA/RHS & VA Home Purchase Loans
B) Conventional Home Purchase Loans
C) Refinancings
D) Home Improvement Loans
F) Non-occupant Loans on < 5 Family Dwellings (A B C & D)
G) Loans On Manufactured Home Dwelling (A B C & D)
Number
Average Value
Number
Average Value
Number
Average Value
Number
Average Value
Number
Average Value
Number
Average Value
LOANS ORIGINATED
1
$87,280
14
$87,553
18
$84,027
3
$30,933
2
$47,985
1
$73,400
APPLICATIONS APPROVED, NOT ACCEPTED
0
$0
2
$61,780
7
$92,987
1
$51,000
1
$23,070
1
$40,800
APPLICATIONS DENIED
0
$0
4
$63,075
21
$102,071
3
$52,723
0
$0
1
$56,180
APPLICATIONS WITHDRAWN
0
$0
2
$121,305
15
$98,993
2
$150,565
1
$25,750
0
$0
FILES CLOSED FOR INCOMPLETENESS
0
$0
1
$78,750
3
$105,727
0
$0
0
$0
0
$0
Aggregated Statistics For Year 2004 (Based on 2 partial tracts)
A) FHA, FSA/RHS & VA Home Purchase Loans
B) Conventional Home Purchase Loans
C) Refinancings
D) Home Improvement Loans
F) Non-occupant Loans on < 5 Family Dwellings (A B C & D)
G) Loans On Manufactured Home Dwelling (A B C & D)
Number
Average Value
Number
Average Value
Number
Average Value
Number
Average Value
Number
Average Value
Number
Average Value
LOANS ORIGINATED
1
$91,120
12
$84,073
25
$90,589
3
$52,277
2
$64,455
1
$100,320
APPLICATIONS APPROVED, NOT ACCEPTED
0
$0
1
$136,100
8
$83,078
1
$74,400
0
$0
1
$39,290
APPLICATIONS DENIED
0
$0
3
$91,570
21
$96,785
3
$36,783
0
$0
2
$65,795
APPLICATIONS WITHDRAWN
0
$0
2
$64,205
16
$107,290
1
$41,630
0
$0
1
$28,260
FILES CLOSED FOR INCOMPLETENESS
0
$0
1
$49,160
2
$98,230
0
$0
0
$0
0
$0
Aggregated Statistics For Year 2003 (Based on 2 partial tracts)
A) FHA, FSA/RHS & VA Home Purchase Loans
B) Conventional Home Purchase Loans
C) Refinancings
D) Home Improvement Loans
F) Non-occupant Loans on < 5 Family Dwellings (A B C & D)
Number
Average Value
Number
Average Value
Number
Average Value
Number
Average Value
Number
Average Value
LOANS ORIGINATED
2
$72,230
9
$81,389
47
$85,436
2
$13,625
2
$41,965
APPLICATIONS APPROVED, NOT ACCEPTED
0
$0
2
$50,660
7
$75,670
1
$21,570
0
$0
APPLICATIONS DENIED
0
$0
3
$60,583
21
$88,393
2
$23,660
1
$56,010
APPLICATIONS WITHDRAWN
0
$0
2
$70,140
14
$94,121
0
$0
0
$0
FILES CLOSED FOR INCOMPLETENESS
0
$0
0
$0
2
$85,190
0
$0
0
$0
Aggregated Statistics For Year 1999 (Based on 1 partial tract)
Detailed PMIC statistics for the following Tracts:7148.01
2002 - 2018 National Fire Incident Reporting System (NFIRS) incidents
According to the data from the years 2002 - 2018 the average number of fire incidents per year is 19. The highest number of reported fire incidents - 41 took place in 2010, and the least - 4 in 2009. The data has a decreasing trend.
When looking into fire subcategories, the most incidents belonged to: Structure Fires (58.5%), and Outside Fires (30.1%).
Fire incident types reported to NFIRS in Zip Code 44613

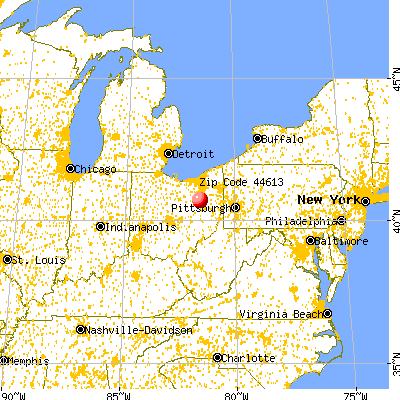


 Nearest zip codes: 44662, 44608, 44689, 44647, 44618, 44659.


 According to the data from the years 2002 - 2018 the average number of fire incidents per year is 19. The highest number of reported fire incidents - 41 took place in 2010, and the least - 4 in 2009. The data has a decreasing trend.
 When looking into fire subcategories, the most incidents belonged to: Structure Fires (58.5%), and Outside Fires (30.1%).